If you’re shopping for the most efficient LED grow lights, you’re trying to solve a real-world problem: how to hit your target PPFD at the canopy without paying for wasted watts. The challenge is that many product pages show impressive “PPFD” numbers without telling you the measurement height, the footprint, the uniformity, or the true input power during testing.
This guide explains how to judge efficiency the way professional growers and utility programs do: by connecting photon output, distribution, and power draw to a real grow footprint and real crop targets. You’ll learn how to translate µmol/J into expected canopy performance, how to read PPFD maps, and how to avoid the traps that make “high PPFD” quietly expensive to run.
Table of Contents
What “Most Efficient LED Grow Lights” Actually Means

Plants don’t care about lumens
General lighting often uses lumens per watt, but horticulture focuses on photons in the photosynthesis waveband. Standards and horticulture programs typically treat PAR as the 400–700 nm range for photosynthesis, which is why PPFD and DLI are built around that band. ASABE Tech Library
The metrics that matter (and what they really tell you)
PPF (µmol/s) is the total photosynthetic photons emitted by a fixture, while PPFD (µmol/m²/s) is what your plants receive at the canopy. PPE (µmol/J) links photon output to electrical input, which is why it’s the core “efficiency” metric for comparing fixtures across wattages. DLC’s measurement resource is a helpful reference for how PAR can be reported as PPF and PPFD, and how to interpret these terms consistently. DesignLights
Why “high PPFD” can be misleading
PPFD is not a fixed property of the fixture; it changes with hanging height, footprint, and layout. A brand can report a very high center PPFD at a very low mounting height, while your real canopy corners stay underlit. When you compensate by raising power, adding fixtures, or lowering height too far, “efficient” becomes “expensive.”
How to Compare Efficiency Fairly
Look for disciplined testing language
In solid-state lighting, ANSI/IES LM-79 is widely used for electrical and photometric measurements of SSL products, and it’s often referenced as the backbone for credible performance reporting. Even when a brand markets horticulture-specific results, LM-79-style discipline is a useful credibility signal because it ties optical output to electrical input under defined conditions. The ANSI Blog
If you want a public benchmark for how horticultural performance can be structured and reported, the DLC HORT Technical Requirements V3.0 (PDF) is a practical reference point. DesignLights
Ask for a PPFD map that matches your footprint
A PPFD map is one of the most buyer-protective documents you can request, because it shows uniformity (edges, corners, hot spots). Compare maps only when they share the same hanging height and the same footprint size, because PPFD is strongly height-dependent.
If two products are mapped differently, their PPFD numbers are not directly comparable. In that case, treat both PPFD claims as “marketing,” and insist on a map at the same height and footprint before making an efficiency decision.
Use PPE as a filter, then judge distribution
A practical buying approach is simple: shortlist by strong fixture-level PPE (µmol/J), then choose the fixture with the smoothest PPFD map and the best controllability for your canopy. Newer DLC policies also emphasize reporting of photosynthetic photon efficacy tied to test reports, which is another reason to value transparent measurement. DesignLights
“Chip efficacy” is not fixture efficacy
Marketing often quotes LED package performance, but what matters is fixture-level performance after driver losses, thermal losses, and optical losses. If you cannot find fixture-level PPE tied to real input wattage, treat the listing as incomplete. Over a full crop cycle, fixture-level truth beats “diode marketing” every time.
PPFD vs DLI: How to Choose the Right Target Without Wasting Watts
PPFD is the speed; DLI is the daily dose
PPFD tells you the instantaneous photon rate at the canopy. Daily Light Integral (DLI) tells you the total photosynthetic photons delivered in a day (mol/m²/day), which is often a better way to connect lighting to growth goals because it combines intensity and duration. Extension resources describe DLI as daily PAR received as a function of PPFD and photoperiod. Purdue Extension
If you want a clear, grower-friendly explanation, Purdue Extension’s Measuring Daily Light Integral in a Greenhouse (PDF) is an excellent reference. Purdue Extension
The DLI formula you can use immediately
Use this formula: DLI (mol/m²/day) ≈ PPFD (µmol/m²/s) × photoperiod (hours) × 3600 / 1,000,000. It converts a canopy PPFD target into a daily “dose” you can plan around and measure.
Example: If you run 18 hours and want 20 mol/m²/day, your average PPFD target is about 309 µmol/m²/s. That number surprises many growers, and it’s one reason over-lighting is common (and costly) in early stages.
Crop examples to ground your targets
For greenhouse lettuce, extension guidance gives an example stating lettuce grows well at a DLI close to 15 mol·m⁻²·d⁻¹, which can often be reached with moderate PPFD depending on photoperiod.
For indoor cannabis, peer-reviewed studies have tested multiple PPFD levels (including 600–1,000+ µmol·m⁻²·s⁻¹), showing yield increases with increasing light intensity under the tested conditions. That evidence supports using higher PPFD when your system can support it, but it also highlights that “high PPFD” should be a deliberate choice, not a default setting. PMC
What Makes a Grow Light Truly Efficient in the Real World
Diode strategy: more diodes, lower current density
Driving many diodes gently can produce higher fixture-level PPE than driving fewer diodes aggressively. Lower current density reduces heat per diode, helps maintain output, and typically improves long-term stability. This is one of the most common design patterns behind “high PPFD, low power consumption.”
Driver quality: efficiency, dimming, and reliability
Driver losses are pure waste: they turn into heat instead of photons. A high-quality driver also enables smooth dimming and stable output at lower power, which is a direct energy-saving tool for propagation and early vegetative stages. Over time, driver reliability can also determine whether a fixture stays efficient or becomes a maintenance headache.
Thermal design: efficiency you keep over time
LED performance is temperature dependent. If a fixture runs hot, it may deliver less output per watt and degrade faster, forcing you to increase power to maintain PPFD. Good heat sinks, sensible spacing, and airflow paths protect both efficiency and lifespan.
Optics and distribution: usable PPFD beats hot spots
Two fixtures can have the same PPE but produce very different canopies if one has better spread and uniformity. Better distribution reduces the need to oversize wattage “just to fix the corners,” which is one of the most common hidden energy costs. In practical grow rooms, uniformity is often the difference between dimming down and paying full power.
Spectrum Choices That Preserve Efficiency and Plant Results
Don’t trade crop outcomes for a tiny PPE advantage
A spectrum that produces awkward morphology or inconsistent flowering can cost more than it saves. Balanced white-based spectra with supplemental deep red are popular because they support strong plant development while maintaining practical human visibility. For many buyers, that visibility is part of efficiency because it speeds scouting and reduces mistakes.
UV and far-red: use intentionally, not automatically
Extra channels can raise power draw without guaranteed ROI. Controlled studies in indoor cannabis report that increasing PPFD can increase yield, while adding UV did not provide commercially relevant yield benefits under the conditions tested. If your goal is low power consumption, treat UV as an optional tool that must justify itself with measured outcomes and a safety plan.
Color rendition helps you detect issues early
In working grow spaces, being able to spot nutrient issues or pests quickly matters. The IES TM-30 method documents a more comprehensive approach to evaluating color rendition than older CRI-only thinking, which can be relevant when selecting white-spectrum fixtures for operations where scouting accuracy matters. ies.org
Controls: The Lowest-Cost Efficiency Upgrade
Dimming makes “efficient” practical across the crop cycle
Seedlings and clones rarely need flowering-level PPFD. A fixture that dims smoothly and remains stable allows you to deliver the photons the plants can actually use, rather than paying for excess. In many operations, dimming is the fastest path to a lower electric bill without sacrificing performance.
Intensity vs duration: hit the same DLI multiple ways
Because DLI is intensity × time, you can often reach the same daily dose with a lower PPFD over more hours (or vice versa). The most efficient plan is the one that meets crop needs while minimizing total system energy, including HVAC. This is why serious growers plan by DLI, not by “maximum PPFD.”
Greenhouse supplemental lighting: chase DLI, not maximum PPFD
In greenhouses, sunlight provides a variable baseline. Supplemental lighting is often most efficient when it fills the DLI gap rather than attempting to maintain very high PPFD all night long. DLI-focused thinking is widely used in greenhouse guidance and planning. Purdue Extension
Reading PPFD Maps Without Getting Tricked
Average PPFD vs center PPFD
A PPFD map should give you a grid of values and a clearly stated hanging height and footprint. Don’t let a single “max PPFD” number drive your decision, because max PPFD is usually the center point and often overestimates what your plants receive across the canopy.
For efficiency decisions, focus on average PPFD (what your whole canopy gets) and minimum PPFD (how weak the corners get). If your minimum is too low, you’ll be tempted to increase power or lower the fixture, which can create hotspots and reduce uniformity even more.
Uniformity is a hidden energy lever
Uniformity is not just “nice growth.” It is literal energy efficiency, because uniformity reduces over-lighting in the center. In many tents and rooms, growers run lights harder than necessary because edges are underlit even though the center is already above target.
A practical rule: if two fixtures have similar PPE, choose the one with the smoother PPFD map. You’ll often run that fixture at a lower dimming level to achieve the same average PPFD, which is exactly what “low power consumption” looks like.
Hanging height changes everything
Lowering a fixture increases center PPFD quickly, but it often worsens edge performance. Raising a fixture improves spread and uniformity, but lowers intensity, which may require more fixtures or more wattage. There is no “best height” without a PPFD map, because optics and diode layout vary widely between products.
Walls, tents, and reflectivity
Reflective walls can raise average PPFD by bouncing photons back to the canopy, but they don’t fix poor distribution. A weak corner on a PPFD map often remains a weak corner in real life, especially once the canopy absorbs light and blocks side reflections. If you rely heavily on reflections to meet targets, small canopy changes can cause big PPFD shifts, making “minimum necessary wattage” harder to maintain.
Efficiency Is a System: Light + Heat + Dehumidification
Every watt becomes heat (and often humidity-management cost)
Indoor growers sometimes focus only on lighting kWh, but the room also pays for cooling and often for dehumidification. Lighting power becomes heat, heat drives HVAC demand, and higher transpiration under higher PPFD can increase moisture load, which further increases energy use. When you shop for the most efficient LED grow lights, you’re also shopping for a lower climate-control burden.
Why LEDs still win (even when you account for heat)
Energy programs have documented the improvement of LED energy efficiency over time and their savings potential compared with conventional lighting. Even if your facility needs heat in winter, the controllability and directional nature of LEDs usually provides more useful photons per input watt than legacy technologies.
CO₂, PPFD, and When “High PPFD” Is Actually Efficient
High PPFD can deliver better ROI under enriched CO₂
At higher CO₂, plants can often use more light before hitting diminishing returns, which can make higher PPFD economically sensible. Without enriched CO₂ (or without enough nutrients and environmental control), pushing PPFD can waste electricity because photosynthesis becomes limited by something else. This is why “efficient” always depends on the entire grow system, not just the fixture.
Use research to calibrate expectations
Indoor cannabis research has evaluated yield and physiology across multiple PPFD target levels, and multiple studies report yield increases as PPFD increases through the tested ranges. That supports the idea that “high PPFD” can be productive, but it also implies you should pair high PPFD with the right climate and nutrition plan to avoid wasting photons. PMC
Quick Math: Turning Specs Into Power Cost and Coverage

From PPE and watts to PPF
A useful shortcut is: PPF (µmol/s) ≈ PPE (µmol/J) × input power (W). Example: a 600 W fixture at 2.7 µmol/J produces about 1620 µmol/s of PPF, which is a fast sanity check when a listing claims “extreme PPFD.”
A rough “average PPFD” estimate (sanity check)
A rough estimate is Average PPFD ≈ PPF ÷ canopy area. This is optimistic because it ignores losses and distribution, but it can still catch exaggerated claims. If the math doesn’t make sense, ask for the PPFD map and confirm hanging height.
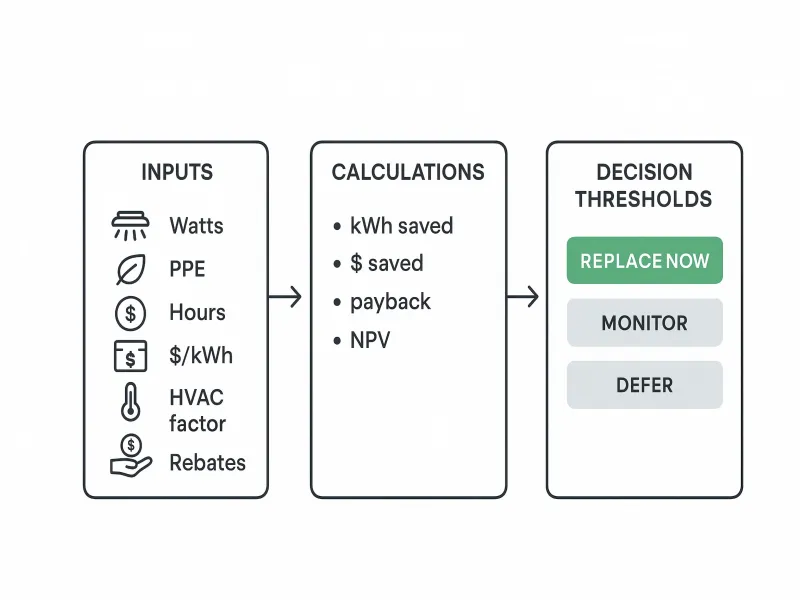
The energy formula behind your electricity bill
A common energy-use formula is: kWh = Watts × hours/day × days ÷ 1000. Once you have kWh, multiply by your electricity rate to estimate monthly cost, and compare fixtures only when they achieve the same canopy target. Adams-Columbia Electric Cooperative
Worked comparison (one example you can reuse)
Imagine a 4×4 canopy and a flowering target average PPFD of 800 µmol/m²/s. You compare two 650 W fixtures, one at 2.6 µmol/J and one at 2.9 µmol/J, and both have credible PPFD maps for your height. If the higher-PPE fixture can hit your target at 550 W while the other needs the full 650 W, the monthly savings at 12 h/day is (650 − 550) × 12 × 30 ÷ 1000 = 36 kWh/month per fixture.
That number looks small until you scale it across multiple fixtures and multiple years. In commercial rooms, those watts also reduce HVAC load, so the total savings can be larger than lighting kWh alone.
Efficiency Myths That Waste Money
Myth 1: Higher wattage always means better results
More watts can increase PPFD, but if your crop is already meeting its DLI target, extra photons may deliver diminishing returns. Efficiency is about right-sized PPFD, not maximum PPFD. The fastest way to waste electricity is to buy a light sized for “peak flowering” and run it at peak all the time.
Myth 2: Center PPFD equals canopy performance
A single hotspot number is meaningless without a map. If a PPFD map shows weak corners, you will likely overdrive the fixture to compensate, which wastes energy and can create stress in the center. A smoother map often lets you run lower power for the same harvest consistency.
Myth 3: UV always boosts yield
UV can have targeted uses in some research contexts, but controlled indoor cannabis studies have reported that UV additions did not provide commercially relevant yield benefits under the conditions tested. If your goal is low power consumption, extra channels should be justified by a clear outcome and verified measurements, not by hype.
Safety and Compliance: Efficient Should Also Be Safe
UL 8800 and horticulture-specific safety
Grow environments can be damp, wet, and hot, and fixtures may be mounted and moved frequently. UL describes UL 8800 as a published standard designed for horticultural lighting equipment and systems, including evaluation for suitability in damp/wet environments and elevated ambient temperatures. UL Solutions LATAM
If you want an official overview from UL, see UL’s horticultural lighting testing and certification page. UL Solutions
IEC 62471 and photobiological safety
High-output LEDs can be uncomfortable or unsafe to stare at directly. IEC 62471 provides a framework for evaluating photobiological safety and classifying products into risk groups based on exposure limits, and manufacturers often reference this standard in safety documentation.
Blue light hazard: use the term correctly
The CIE has published a position statement clarifying how “blue light hazard” should be interpreted and when it applies. In practice, treat intense grow fixtures as “don’t stare into it” equipment and use appropriate eyewear during canopy work, especially at full power and close distances. CIE Files
If you want the primary source, read the CIE Position Statement on the Blue Light Hazard (PDF). CIE Files
Practical Setup Guides for Efficient Coverage

2×4 tent
In 2×4 footprints, a single compact light can create a strong center and weak edges. Bar-style layouts or multi-module layouts often improve uniformity, letting you run lower wattage for the same average canopy PPFD. In real grows, this can be the difference between dimming at 60–80% versus running at 100% “just to help the corners.”
4×4 tent
4×4 is where edge performance matters most. Efficient solutions prioritize spread so you don’t have to oversize wattage just to keep corners productive. When you compare two fixtures for 4×4, treat a good PPFD map as a bigger deal than a small PPE difference.
Multi-tier racks
In racks, low mounting height and heat build-up are critical constraints. Efficient rack lighting emphasizes uniform distribution at short distance and strong thermal/driver reliability, because maintenance across many tiers is expensive. If you can dim per tier and per stage, you can keep watts low while maintaining consistent growth across shelves.
Greenhouse supplemental lighting
Efficiency in greenhouses is about meeting a DLI target with smart scheduling and controls. Extension guidance also notes that greenhouses typically receive less light than outdoors due to glazing and structural losses, reinforcing why DLI planning is more useful than chasing maximum PPFD.
Keeping Efficiency High Over Time
Clean optics and heat sinks
Dust and residue reduce output, which makes you turn fixtures up. A simple cleaning schedule preserves PPFD and keeps your “efficient” fixture efficient for years. Maintenance is boring, but it is one of the cheapest efficiency upgrades you’ll ever do.
Measure instead of guessing
A quantum sensor and a simple grid measurement routine can confirm actual canopy PPFD. Once you have real numbers, you can dim down confidently and lock in energy savings without fear of under-lighting. This is how professional growers maintain both crop quality and low power consumption.
Why SLTMAKS Focuses on High PPFD With Low Power Consumption
Efficiency is not one number; it’s a system outcome. The most efficient LED grow lights deliver the PPFD you actually need, across the canopy you actually have, at the lowest stable power draw, with controls that let you adapt across stages and seasons.
If you share your canopy size, crop, photoperiod, and whether you run enriched CO₂, we can translate that into a realistic PPFD/DLI target. Once the target is clear, recommending a fixture becomes a measurable engineering match instead of a marketing gamble.