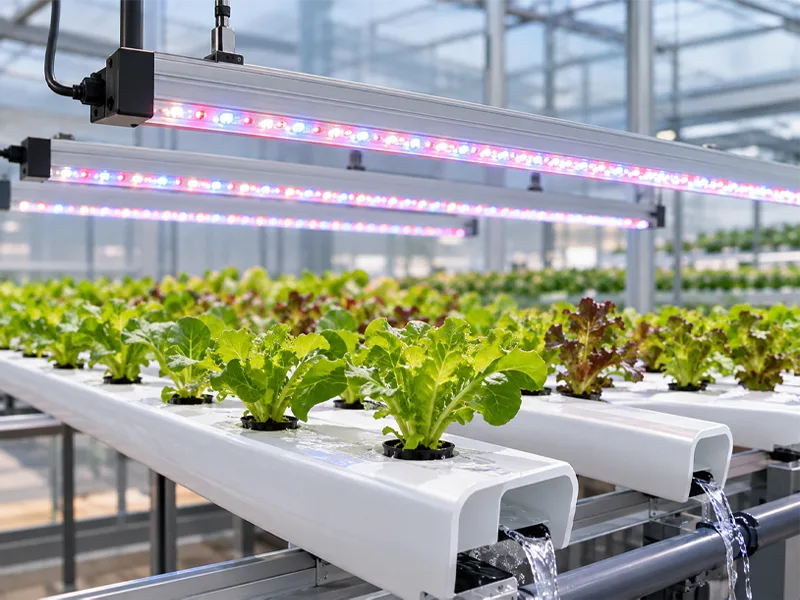
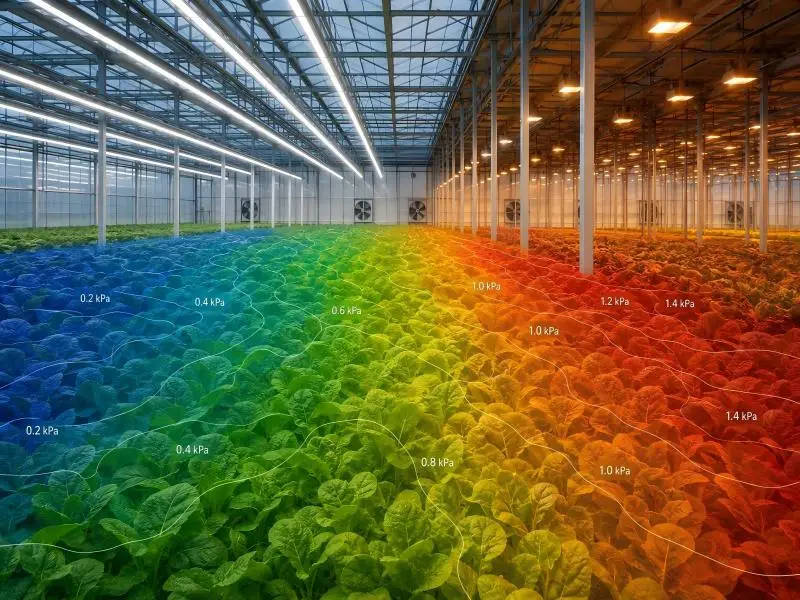
Two greenhouses can run identical air temperature, relative humidity, and thermostat setpoints, and still present their crops with completely different vapor pressure deficit (VPD). More often than not, the difference is the light source overhead.
That gap matters because VPD is not a setting you dial in. It is an indicator you calculate — dependent on the water-vapor pressure at the leaf surface as much as the moisture in the room air. Add supplemental lighting, and you change the leaf’s energy balance before you change anything your room sensor can see.
This guide covers the mechanism connecting photon delivery to leaf-level water loss, how LED and HPS fixtures diverge in the canopy conditions they produce, and the control and commissioning practices that hold VPD inside target through a lighting change.
Table of Contents
VPD Fundamentals
What VPD measures
VPD is the difference between the water-vapor pressure air could hold at saturation and the pressure it actually holds, expressed in kilopascals (kPa). It is a pressure gradient, not a humidity percentage, which is why 70% relative humidity maps to very different VPD values in a cool room and a warm one.
Growers describe humidity in relative terms, but the plant responds to the driving force across its leaf surface. A room at 70% RH and 18 °C carries a far weaker drying gradient than the same 70% RH at 28 °C. That is why the metric earns a place in your climate model rather than alongside it — kilopascals are the currency of every greenhouse VPD control setpoint you will set.
Leaf vs. Air VPD
Most VPD charts and controllers are built from air temperature. The correct input is leaf surface temperature, because that is where evaporation occurs. Extension guidance from UMass Amherst on managing light, temperature, and relative humidity in greenhouses uses the leaf as the reference point for the gradient, and the e-GRO series on why tracking VPD matters in controlled environments makes the same point for indoor production.
Under full-intensity LED lighting with good airflow, leaves commonly run roughly 1.5–2.5 °C cooler than the surrounding air. Under heavy radiant load, they can run warmer. That offset is not a rounding error: it shifts effective VPD in the opposite direction to the assumption baked into the chart.
Target Bands by Crop Stage
Targets are crop- and stage-specific, not universal. Daytime bands for vegetable crops sit around 0.8–1.2 kPa, with vegetative stages of high-value flowering crops placed lower and generative stages higher. Very high VPD suppresses stomatal conductance and closes the leaf down; very low VPD blunts transpiration and the carbon dioxide uptake that comes with it.
| Crop stage | Typical daytime VPD band | Practical note |
|---|---|---|
| Propagation/seedling | 0.4–0.8 kPa | Young tissue has limited water transport capacity |
| Vegetative | 0.8–1.2 kPa | Sustain transpiration to drive calcium and nutrient movement |
| Generative / flowering | 1.1–1.5 kPa | Rising demand supports dry-matter accumulation |
| Dark period | Allow a controlled rise | Ventilation losses are lower than during the day |
Treat these as starting points to verify against your own crop response, and pair them with the daily light integral your photoperiod is engineered to deliver — see this walkthrough of greenhouse supplemental lighting calculation by latitude and DLI for how target DLI converts into fixture runtime. Because greenhouse VPD control under supplemental lighting depends on both light and climate scheduling, the two plans should be built together rather than tuned against each other after installation.
Mechanisms under Supplemental Lighting
Leaf Temperature and Stomata
A leaf absorbs radiation and sheds that energy three ways: re-radiated longwave, convective exchange with air, and latent heat carried away by evaporating water. Increase photon flux and leaf temperature settle where those pathways balance.
Stomata respond within minutes. A 2020 study in Environment Control in Biology found that supplemental lighting at modest intensity drove photosynthesis and induced stomatal opening, raising transpiration measurably during the illuminated window. Open stomata lower the leaf’s vapor pressure gradient by releasing water — but only if the air around the leaf can accept it.
Transpiration and Boundary Layer
Every leaf carries a thin film of nearly saturated air against its surface. That boundary layer is the real interface between plant and room, and its thickness governs how readily water vapor escapes. Air movement thins it; still air thickens it.
This is where VPD and airflow become inseparable. Raise PPFD and the leaf generates more vapor; if the boundary layer cannot be swept away, humidity accumulates at the surface, and the effective gradient collapses regardless of what the room sensor reports. Transpiration rises roughly linearly with radiation and airspeed when other factors are not limiting, which is why airflow design belongs in the same conversation as lighting design.
Spectrum and Photosynthetic Demand
Spectrum changes the demand side of the equation. Blue and red wavebands drive photosynthesis at different quantum efficiencies, and far-red influences stomatal behavior and leaf expansion in ways that alter canopy architecture and the airflow within it. Any spectrum that raises photosynthetic rate also raises the water the crop must move to support it.
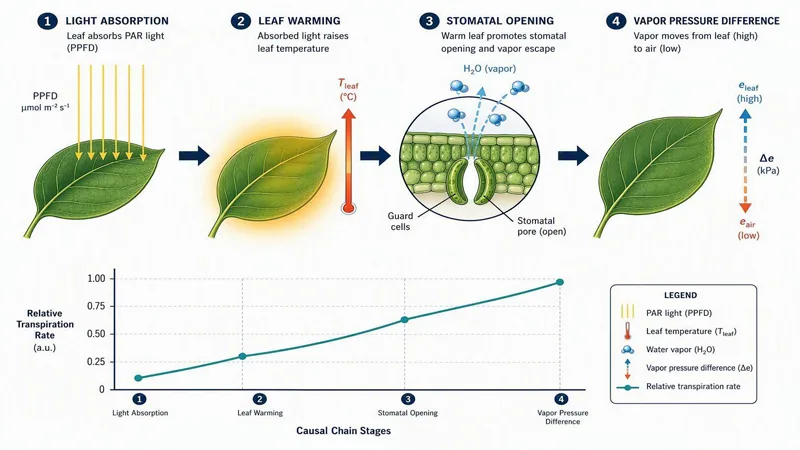
The practical takeaway: the crop does not experience your lighting decision and your climate decision separately. A 20% PPFD increase is also a transpiration increase, and it lands in the same hour as your dehumidification schedule.
LED vs HPS Impacts on VPD
/
Radiant Heat and Leaf-Air Delta T
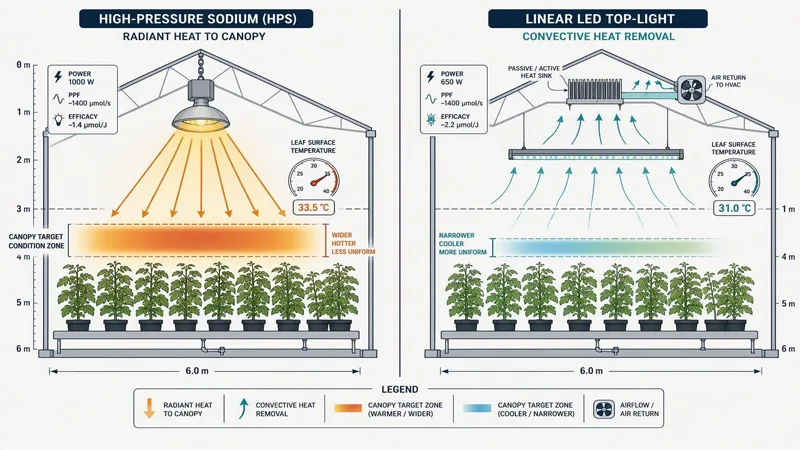
The largest difference between legacy and modern fixtures is how their heat reaches the canopy. High-pressure sodium (HPS) converts a substantial share of its input power into longwave and near-infrared radiation that travels directly to the leaf, warming it above air temperature. LED fixtures convert a higher share into photosynthetically active radiation and dissipate the balance by convection from the fixture body and driver.
The consequence is precise: after a conversion, the same thermostat reading no longer corresponds to the same leaf temperature, and therefore not to the same VPD. Facilities that keep pre-retrofit setpoints unchanged typically find effective VPD has dropped, transpiration has slowed, and nutrient mobility has changed with it.
How much heat reaches the canopy is largely a mechanical property of the fixture. SLTMAKS fixtures use passive aluminum heat-sink geometry to move thermal energy into the air stream rather than down onto the leaf surface, keeping the leaf-air delta small and the VPD correction predictable — worth more than a marginal efficiency gain, because it lets an operator hold a setpoint that still means something after the retrofit.
Broad-spectrum output with Samsung diodes keeps photosynthetic demand and stomatal behavior aligned with the intensity delivered. Certification belongs in the same breath: ETL and CE listing, RoHS and DLC QPL status, and UL 8800 compliance on commercial models are what let a facility pass an authority having jurisdiction (AHJ) review — the local inspector who signs off on the electrical installation — and document submittals through procurement. A lighting change that alters climate setpoints but fails inspection is not a retrofit; it is an open item.
Distribution and Microclimates
HPS fixtures concentrate output from a few high-output sources, so their radiant footprint carries bright cores and dim margins. LED top-lights distribute photons across many lower-output emitters, giving flatter uniformity but a different heat signature. For VPD, distribution matters less than the canopy conditions each layout produces — and those differ in ways a single sensor will not show.
Both layouts produce microclimates, but of different kinds. HPS tends to create hot, fast-drying zones beneath each lamp with cooler perimeter areas; LED uniformity reduces that spread while shifting the climate load toward the room’s bulk air. With a sensor in one location, each architecture biases the reading differently, and the bias can exceed your control deadband.
HVAC/D Load Shifting
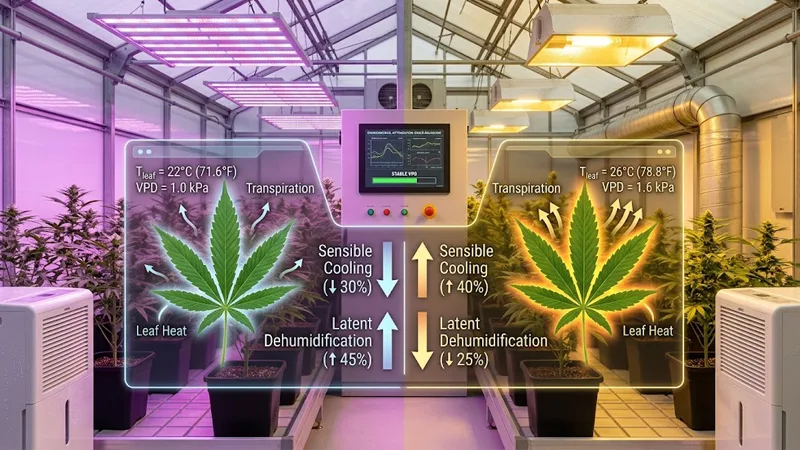
Because LED fixtures deliver less radiant heat, the room’s sensible load drops and cooling demand usually falls with it, often by 30% or more on the lighting-linked portion. The latent load does not disappear. Higher photon delivery means higher transpiration, so dehumidification now does more of the work radiant heat previously offset.
This is the load shift that catches operators by surprise: cooling tonnage declines, dehumidification runtime climbs, and if the two run as one sequence on a single setpoint, the room oscillates between too dry and too humid. Capital and control have to be modeled together. The HPS-to-LED retrofit climate adjustment is where most projects lose ground: the fixture swap is a known quantity, while the setpoint revision that must follow it often gets left to whoever is on shift. The retrofit path and its commissioning checkpoints are laid out in how to retrofit HPS to LED for commercial greenhouses, and the financial framing sits in the LED vs HPS commercial greenhouse ROI and deployment playbook.
Control Strategies for Supplemental Lighting VPD
DLI/PPFD-Aware Dimming
Treat dimming as a climate lever, not only an energy lever. When PPFD rises, leaf temperature and transpiration follow, so the room needs more dehumidification and often more airflow. When climate headroom is tight — hot afternoons, a chiller near capacity, a humid spell — trimming output by 10–20% lowers leaf temperature and vapor load at a fraction of the yield cost of a VPD excursion.
A useful rule: cap delivered PPFD at the level your mechanical systems can support at target VPD, then let dimming absorb the variability. That also smooths seasonal DLI shifts without opening vents and losing conditioned air.
Integrating HVAC and Dehumidification
Run dehumidification as a staged response to rising humidity rather than one large on/off correction. Staging prevents the canopy-level oscillation an oversized unit creates when it cycles against the setpoint. Coordinate the stages with your lighting schedule, since the fixtures are the largest scheduled moisture source in the room.
Then close the loop on the VPD setpoint rather than on temperature and humidity separately. When VPD drifts low, increase dehumidification or air exchange; when it drifts high, ease light intensity, add humidity, or reduce exchange if the climate allows. The right response depends on which side of the band you are on, and on how much capacity the mechanical systems have left. The tonnage math behind that decision is worked through in this analysis of LED grow light heat radiation and HVAC impact.
Airflow and Sensor Placement
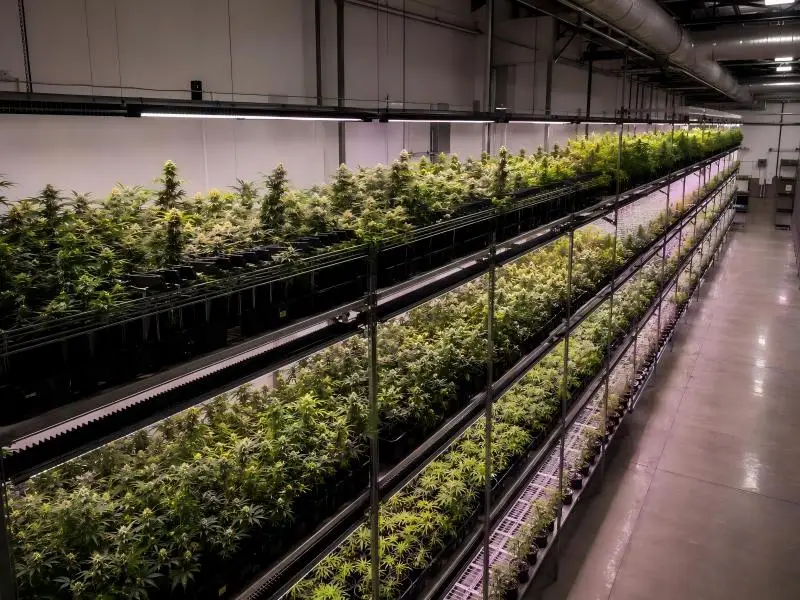
Target roughly 0.5–1.0 m/s at the top of the canopy for most crops, moving toward 1.25–1.5 m/s at high PPFD where you need to homogenize leaf surface temperature. Vertical racks often need only 0.3–0.5 m/s at leaf level to clear the boundary layer, but they need it distributed evenly, because a single fan does not create a uniform microclimate across tiers.
Sensor placement decides whether any of this is measurable. Put the primary temperature and humidity sensor at canopy height, centered in a representative crop zone — not at the ceiling, not on a wall, and not in the path of supply air or direct fixture radiation. Add infrared spot checks or a dedicated leaf sensor for surface temperature, and reposition sensors as the canopy grows so they stay at canopy height. The governing rule: canopy VPD sensor placement must represent the crop, not the corner of the room the sensor happened to be installed in.
Commissioning and Validation after Retrofit
Pre/Post Mapping and Setpoints
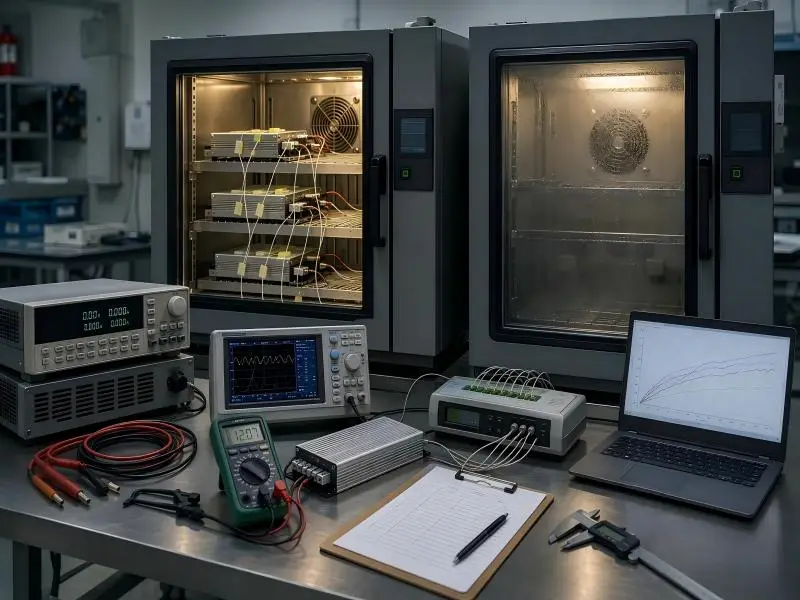
Before changing a fixture, map the room as it is. Log canopy PPFD, air temperature and relative humidity at canopy height, and leaf surface temperature at several representative points through a full photoperiod, then derive the leaf-level VPD those conditions produce. That dataset is your baseline — the only defensible reference for judging what the retrofit changed.
Repeat the identical mapping under the new fixtures, at the same crop stage if possible. Compare leaf-level VPD rather than air-level VPD, and adjust temperature and humidity setpoints as a set: raising room temperature while holding relative humidity constant pushes VPD the wrong way.
Canopy-Level Sensing and Alarms
Set alarms on leaf-level VPD, not on relative humidity, with a deadband wide enough to avoid nuisance trips during light ramps and irrigation events. Alert on sustained excursions rather than momentary crossings.
Add a second layer that watches for the failure mode the mechanism sections predict: a widening gap between leaf and air temperature. Under stable light levels, that gap growing usually means airflow has degraded, or a sensor has drifted, and it appears before crop symptoms do.
Stepwise Tuning for Stability
Change one variable per adjustment cycle and hold it long enough to observe the crop’s response. A staged ramp — reduced output in the first week with canopy mapping, progressive increases as delivered PPFD and leaf temperature are verified, full target output only after the climate sequence proves stable at each step — lets you find the new setpoints deliberately rather than discovering them through a yield event. That staged approach applied to a full conversion is documented in this guide to transitioning cannabis from HPS to LED without yield loss.
Conclusion
Three points carry the operational weight. VPD is a calculated leaf-level quantity, so leaf temperature — not room air temperature — is the input that matters, and the leaf-air offset changes the moment your light source does. The LED retrofit shifts load rather than removing it: sensible cooling falls while latent dehumidification rises, and controlling those two together keeps VPD stable. The correction is also measurable, so measure it rather than assume it.
The common pitfalls are versions of one mistake: keeping pre-retrofit setpoints and expecting the same canopy conditions, chasing relative humidity instead of the vapor-pressure gradient, and treating commissioning as a formality rather than the phase where the new climate model is proven. Add an unlisted fixture and you have also introduced a compliance problem no setpoint adjustment resolves.
The next step is a baseline measurement campaign in one representative zone — canopy PPFD, leaf surface temperature, and humidity at canopy height, logged across a full photoperiod — followed by a setpoint revision and a staged ramp under the new fixtures. If you want that planned against your specific rooms and crop targets, the SLTMAKS team can review your climate data and photometric layout with you.
FAQ
Does supplemental lighting raise or lower VPD?
Does supplemental lighting raise or lower VPD?
It usually pushes VPD up, but only indirectly. A light fixture doesn’t set VPD — it changes the temperature and humidity that determine it. Photons add heat, and warmer air holds more moisture at the same relative humidity, so the gradient across the leaf steepens. Lighting also opens stomata and lifts transpiration, which loads the room with water vapor and can pull VPD back down if dehumidification doesn’t keep pace. UMass Amherst’s guidance on managing light, temperature, and relative humidity treats all three as one system for exactly this reason. The direction of the net change depends on which effect wins in your room.
Why is my VPD lower than the chart says after switching to LED?
Why is my VPD lower than the chart says after switching to LED?
Because most charts are built on air temperature, and LED leaves run cooler than the air around them. With less radiant heat reaching the canopy, leaf surface temperature can sit roughly 1.5–2.5 °C below room air under good airflow, and the e-GRO series on tracking VPD in controlled environments notes that leaf temperature is the correct reference for the gradient. A cooler leaf carries a weaker drying force, so effective VPD lands below what your chart predicts. The fix isn’t guesswork — log leaf surface temperature alongside air readings and recalculate.
What VPD should I target under greenhouse LEDs?
What VPD should I target under greenhouse LEDs?
Targets are stage-specific rather than universal. Propagation generally sits near 0.4–0.8 kPa, vegetative growth around 0.8–1.2 kPa, and generative stages higher, often 1.1–1.5 kPa. The reason for running LED rooms a touch warmer or drier is the leaf-air offset above: if your leaves are a couple of degrees cooler than the chart assumes, holding the same air setpoint gives you less drying force than intended. Verify against your own crop response rather than adopting a number wholesale, and adjust temperature and humidity as a pair, never one at a time.