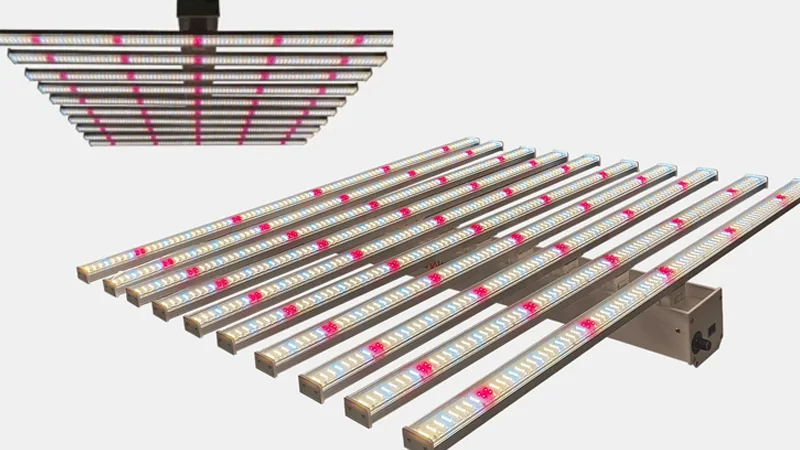
Engineer the perfect light spectrum for optimal plant growth. Boost your yields and cultivate year-round with our energy-efficient LED solutions. Tell us your needs for a customized lighting strategy and quote.
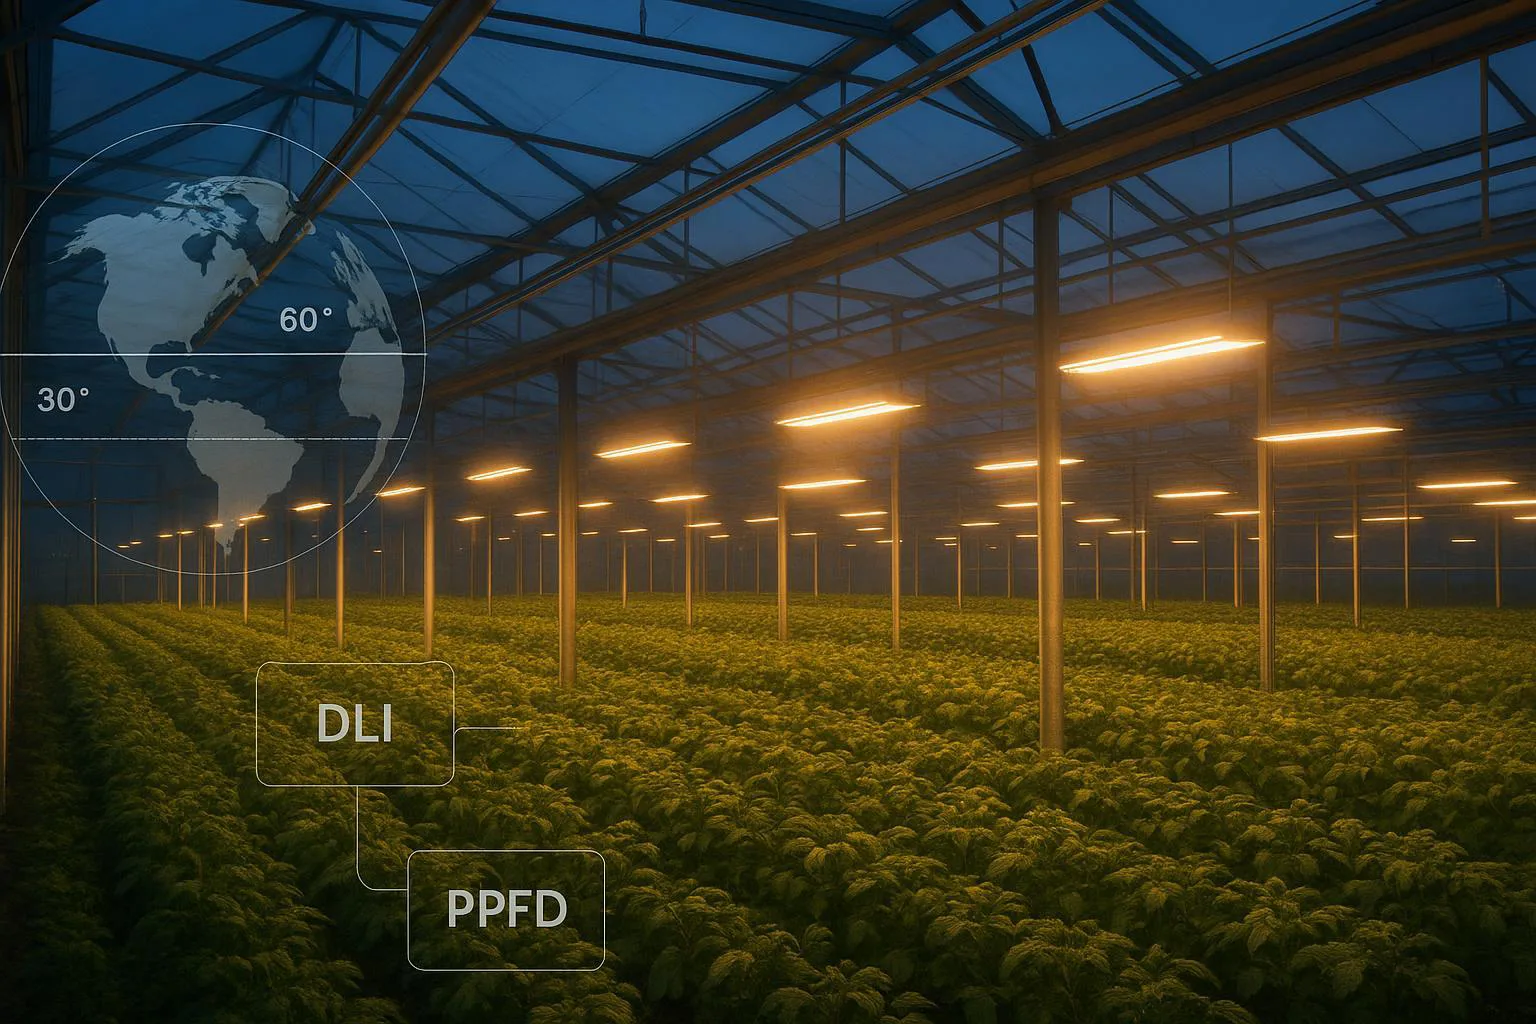
Greenhouse lighting plans fall apart when they ignore two realities: latitude and season. The same crop in Arizona and Michigan can have the same target DLI. Still, the outdoor DLI available in winter is not even close—so the supplemental strategy (PPFD, hours, fixture count, energy, and controls) shouldn’t be the same either.
This guide shows a calculation workflow that starts with latitude-driven outdoor DLI, then layers in greenhouse transmission, crop target DLI, and finally converts the deficit into supplemental PPFD and electrical power. It’s written for cultivation + facilities + procurement teams who need math that’s clear enough for audit.
Inputs you’ll gather:
Site latitude and the seasonal outdoor DLI you want to design for (often the darkest month)
Greenhouse transmission at crop height (or a defensible estimate)
Crop target DLI range and your chosen setpoint
Lighting window (hours per day) and operational constraints (photoperiod, curfew rates, demand charges)
Fixture efficacy (µmol/J) and photometrics (PPFD distribution)
Outputs you’ll compute:
Indoor natural-light DLI (sunlight after transmission losses)
DLI deficit (mol/m²/day) to be supplied electrically
Average PPFD required during your lighting window (µmol/m²/s)
A design PPFD after utilization/uniformity factors
Power density (W/m²), energy (kWh/m²/day), and a layout plan using photometrics
Why it matters: the same calculations feed design, controls programming, and ROI. When the math is consistent, you can compare fixtures on real inputs (efficacy, distribution, dimming behavior, serviceability) instead of on marketing claims.
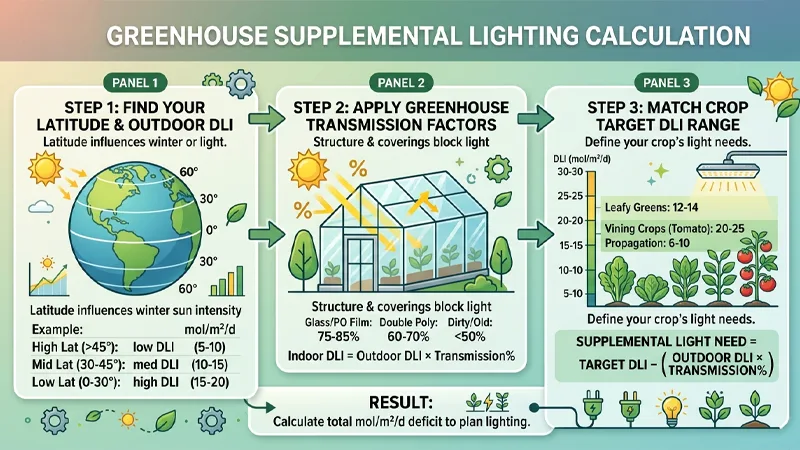
Start with the best available estimate of outdoor DLI (mol/m²/day) for your greenhouse location and season.
Three practical approaches:
Use outdoor DLI maps or calculators tied to latitude and month. Many operations are designed around the darkest month average (often December or January at mid/high latitudes) because that’s when supplementation is the limiting factor.
Use your own weather + PAR dataset if you have it. If you already log outside PPFD with a quantum sensor, convert it to DLI by integrating PPFD over the day. Apogee’s discussion of converting instantaneous PPFD to integrated values is a good sanity-check reference for how the integration behaves in practice (Apogee’s PPFD integration conversion).
Use a conservative design percentile. If you’re planning for production contracts, you might design for a lower percentile of outdoor DLI (more “guaranteed” light supply) instead of a monthly average.
Pro Tip: Don’t mix “sunny day” intuition with month averages. A couple of clear days don’t fix a winter-long DLI deficit at higher latitudes.
In practice, many growers use one combined number measured at canopy height.
Typical ranges (use as a starting point, then measure):
Many commercial greenhouses end up around ~45–60% PAR transmission at the canopy when you include structure, angle-of-incidence losses, aging, and operational shading.
High-performance structures may aim for ~70%+ at the crop level.
Thermal screens and shade curtains can reduce light substantially; treat them as multiplicative losses.
Measurement approach (field-friendly): measure PPFD or even footcandles inside and outside simultaneously and compute inside/outside ratio as an estimate of transmission. Grower-focused guidance in Greenhouse Product News notes footcandle meters can be acceptable for transmission checks even though they’re not ideal for plant-light metrics (“Greenhouse light” in GPN).
What to record for your calculation file:
Transmission measurement date + sky condition (hazy/bright overcast is often more stable than partly cloudy)
Sensor height (crop plane) and number of points
Screen/shade state during measurement
Crop target DLI ranges
Choose your target DLI by crop, cultivar, growth stage, and your economics (yield response vs. energy cost). Target ranges vary widely, but a few common greenhouse references:
Leafy greens (e.g., lettuce): often ~12–17 mol/m²/day in commercial greenhouse contexts. A grower-oriented discussion of managing DLI for leafy greens provides useful framing for winter conditions and crop response (GPN: “Managing the Daily Light Integral for Leafy Greens”).
Tomatoes: often cited in the ~20–40 mol/m²/day range, with many operations targeting ~30–40 mol/m²/day for fruiting when economics support it.
Set a single design setpoint within the range (example: 14 for leafy greens, 30 for tomatoes) so the rest of the math is deterministic.
⚠️ Warning: If you’re adding light to a crop that’s already temperature- or CO₂-limited, higher DLI won’t automatically translate into yield. Make sure the rest of the growth environment can support the extra photons.
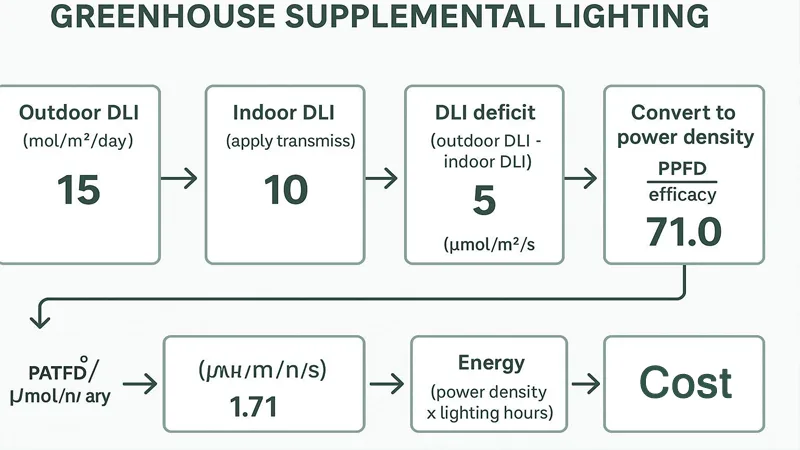
Compute DLI deficit
Adjust outdoor to indoor DLI
Compute the indoor natural-light DLI at crop height:
DLI_indoor_natural = DLI_outdoor × T_total
Where:
DLI_outdoor is the seasonal outdoor DLI you’re designing for
T_total is total transmission as a decimal (e.g., 0.55)
If you only have a glazing transmission spec, don’t stop there. The crop doesn’t grow under a lab test. Structure, gutters, screens, and dust often dominate the real number.
DLI deficit formula and checks
Compute the DLI deficit (what electric light must supply):
If DLI_deficit is negative, set it to 0 (you don’t “owe” negative light).
If your T_total assumption is optimistic, your deficit will be understated. Run a sensitivity later.
Decide whether your target is average or minimum. Many design calculations assume a season-average target; operations often manage day-to-day with controls.
Choose the lighting hours window
Now choose the daily lighting window (hours_on). This is an operational decision that drives the PPFD requirement.
Key constraints:
Photoperiod biology: Some crops care about day length and night interruption; others mainly care about DLI. Avoid making the lighting window so long that you create unintended photoperiod responses.
Utility pricing: Longer hours at lower PPFD can reduce fixture count, but may push runtime into expensive tariff windows.
Demand charges: Concentrated high PPFD in fewer hours can raise peak kW.
Curtain schedules: If thermal screens are deployed during part of the day, transmission changes, and so does the effective deficit.
A common greenhouse supplementation strategy is 14–18 hours/day during the darkest periods, but you should set this to match your crop strategy and energy model.
Convert deficit to PPFD (DLI deficit to PPFD conversion)
Average PPFD from DLI deficit
This is the core conversion.
Because 1 mol = 1,000,000 µmol, and PPFD is in µmol/m²/s, the relationship is:
This conversion is widely documented in DLI guidance; for example, Virginia Tech Extension’s introductory DLI guide covers how DLI relates to PPFD and photoperiod (Virginia Tech Extension DLI guide).
A quick numeric feel:
If you need 10 mol/m²/day of supplemental light over 16 hours, the average PPFD is:
The PPFD_avg You just computed a dose average. Real greenhouses have:
PPFD gradients (hotspots under fixtures, lower PPFD in aisles)
edge losses
obstructions
variation from the mounting height and overlap
So you typically convert PPFD_avg into a design PPFD by dividing by a utilization/uniformity factor U (0 < U ≤ 1):
PPFD_design = PPFD_avg / U
How to pick U:
If you have photometric simulations and a uniformity target, you can back-calculate U from predicted average vs. minimum.
If you don’t, treat U as a conservative factor (for example, 0.75–0.90 depending on layout density and how strict your minimum PPFD requirement is).
The point is not to “add safety margin.” It’s to acknowledge that plants experience spatially variable light, and your target DLI is usually about the crop average and acceptable uniformity.
Design PPFD to meet targets
At this point, you have a PPFD number you can spec against.
Record three values in your worksheet:
PPFD_avg (what the DLI math says)
U (your distribution factor assumption)
PPFD_design (what you’ll ask the lighting layout to deliver)
Size fixtures and power
From PPFD to W/m² via efficacy (PPFD to watts per square meter)
Once you have PPFD_design, you can estimate electrical power density using fixture efficacy (also called PPE, in µmol/J).
If a fixture delivers PPE_fixture (µmol/J) at the system level, then:
W/m² ≈ PPFD_design / PPE_fixture
Reason: 1 W = 1 J/s. If you need PPFD_design µmol/s per m² and you get PPE_fixture µmol per joule, then dividing gives joules per second per m².
Typical commercial horticultural LED fixtures often land around ~2.0–3.0 µmol/J, and higher values exist but should be verified against credible test data. A practical discussion of plant-light efficacy and why it matters is available from Greenhouse Product News (plant lighting efficacy (µmol/J)).
Reality checks:
Make sure you’re using fixture/system PPE, not a diode datasheet claim.
Optics, drivers, and thermal conditions change delivered PPE.
Daily kWh/m² and run cost basics
Compute daily energy per square meter:
kWh/m²/day = (W/m² × hours_on) / 1000
Then multiply by your energy rate to estimate operating cost:
$/m²/day = kWh/m²/day × $/kWh
If you have demand charges or TOU rates, track:
Peak kW contribution (from your total installed kW)
Hours in expensive windows
Whether dimming control can shift the load
This is where lighting controls start paying for themselves: a fixed schedule assumes every day is equally dark. In many climates, that’s untrue.
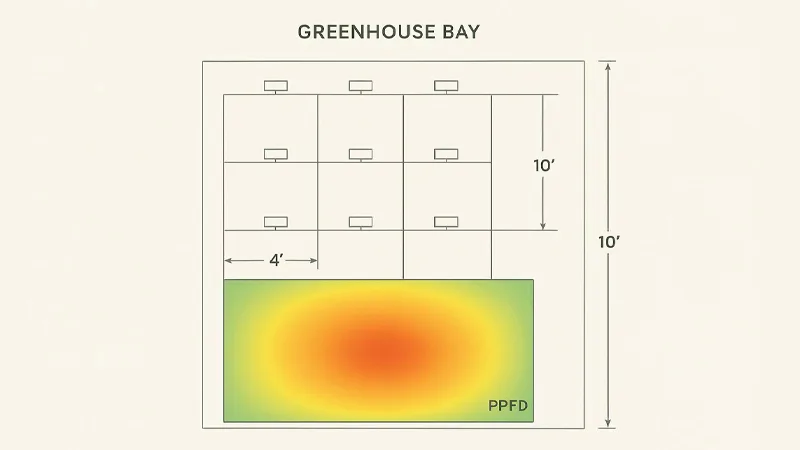
Fixture count and spacing with photometrics
The calculations above get you to the target average PPFD. To turn that into a fixture plan, you need photometrics:
Fixture PPF (µmol/s)
Spatial distribution (IES/LDT file or manufacturer PPFD maps at defined heights)
Mounting height and aiming
Overlap patterns between bays and aisles
Basic count estimate (rough):
Compute total photons required:
PPF_total (µmol/s) = PPFD_design × Area (m²)
Estimate fixture count:
#fixtures ≈ PPF_total / PPF_fixture
Then you validate spacing and uniformity using the photometric distribution.
Controls, HVAC, and compliance
DLI-based dimming and photoperiod (DLI-based lighting controls)
A fixed “lights on for 16 hours” schedule is easy to operate, but it’s rarely optimal.
A DLI-based strategy:
Measures delivered natural-light DLI in real time (or predicts from outside radiation + transmission)
Targets a daily total DLI
Dims fixtures to supply only the deficit
This reduces wasted kWh on brighter winter days and keeps the daily light dose consistent.
For a practical discussion of smart DLI control strategies in greenhouse supplementation, see SLTMAKS (useful as an internal reference for control features to ask vendors about). If you’re still defining your baseline spec, SLTMAKS greenhouse LED grow lights is another internal overview that can help you sanity-check terminology and layout considerations before you request photometrics.
Thermal load and microclimate impacts
Even efficient LED lights turn a large fraction of input power into heat in the space.
What changes when you add supplemental lighting:
Canopy temperature: Radiant + convective heat can shift leaf temperature and VPD.
HVAC interplay: In cold climates, lighting heat may offset heating load; in mild/warm climates, it may increase dehumidification or cooling.
Stratification: Fixture placement and airflow patterns can create temperature gradients.
If your energy model assumes “lighting adds heat so it’s free in winter,” treat that as a hypothesis. Validate with sensor data during a pilot bay.
Safety listings, DLC QPL, and rebates
Two compliance buckets matter in the US:
Electrical safety listing (NRTL). For many jurisdictions, fixtures need testing/listing by a Nationally Recognized Testing Laboratory (NRTL) such as UL or ETL (and acceptance can be AHJ-specific).
Performance qualification for incentives. Many utility rebate programs reference the DesignLights Consortium (DLC) Horticultural Qualified Products List (QPL). DLC explains their horticultural technical requirements and thresholds (DLC horticultural technical requirements) and maintains a public list of qualified products (DLC Horticultural QPL).
Practical takeaway: when you’re building an ROI case, DLC QPL status can simplify the rebate path, but it does not replace electrical safety listing, and safety listing does not guarantee horticultural performance.
Worked examples at ~45°N
The goal here isn’t to claim universal numbers. It’s to show the workflow with defensible assumptions.
Assumptions shared across examples:
Latitude: ~45°N
Darkest-month outdoor DLI (design): 10 mol/m²/day (example value; substitute your real map or sensor value)
At this point, your limiting factor may shift from “can we hit DLI?” to “can our electrical + HVAC systems support the added kW and heat?”
Sensitivity: transmission, hours, efficacy
This is where you can quickly see what matters most.
Transmission (T_total): If transmission drops from 0.55 to 0.45 due to aging/dirty glazing or frequent screen deployment, the indoor natural DLI falls by ~18%. Your deficit (and energy) rises almost one-for-one.
Lighting hours (hours_on): More hours reduce the required PPFD linearly. Going from 16 to 18 hours reduces PPFD by ~11%, but increases runtime. The optimal point depends on your tariff and demand charges.
Efficacy (µmol/J): Power density is inversely proportional to PPE. Moving from 2.3 to 2.9 µmol/J is a ~21% reduction in W/m² for the same PPFD target—if those PPE numbers are real under your operating temperature and driver conditions.
Choose luminaires
Efficacy, photometrics, and durability
When procurement compares fixtures, treat “µmol/J” as necessary but not sufficient.
What to evaluate:
Verified efficacy (system PPE) under stated conditions
Photometrics for greenhouse mounting heights (IES/LDT + PPFD maps)
Driver quality and dimming behavior at low output
Ingress protection (IP) and corrosion resistance for wet, fertilizer-rich environments
Safety & compliance: NRTL listing details (UL/ETL), environmental ratings (IP), and any DLC documentation if you plan to pursue rebates
Warranty: coverage term, what’s included/excluded, and the process + SLA for replacements
To make this concrete, SLTMAKS selection conversations usually come down to the same set of engineering and risk controls: verified efficacy (so W/m² estimates hold up), relevant certifications (ETL/CE/RoHS depending on jurisdiction), thermal design that protects output over long photoperiods, and a warranty process that reduces downtime risk across multiple bays or sites. The point isn’t the logo—it’s the discipline of buying fixtures with documentation that matches your operating reality.
Conclusion
Standardizing your greenhouse supplemental lighting calculation is mostly about being disciplined with inputs and units:
Start from seasonal outdoor DLI driven by latitude and your design month
Convert to crop-level indoor DLI using a defensible transmission factor
Compute the DLI deficit, then convert to PPFD over your chosen lighting window
Apply a utilization/uniformity factor so design PPFD matches real layouts
Translate PPFD to W/m² with verified µmol/J, then to kWh and run cost
To validate the design, don’t rely on a single measurement point. Use sensors and a pilot bay:
Grid PPFD at crop height (average + uniformity)
Track delivered DLI over days with different weather
Monitor canopy temperature, RH/VPD, and any HVAC knock-on effects
Next actions that keep projects moving:
Build a one-page worksheet with your variables (DLI_outdoor, T_total, DLI_target, hours_on, U, PPE_fixture)
Request photometrics + certification documentation early
If incentives matter, check DLC QPL status and rebate program rules before locking a SKU
FAQ
How do I calculate supplemental greenhouse lighting from DLI?
Calculate indoor natural DLI (DLI_outdoor × transmission), then the deficit (DLI_target − DLI_indoor). Convert deficit to average PPFD: PPFD = (DLI_deficit × 1,000,000) / (hours × 3600).
What is the relationship between PPFD and DLI?
DLI is PPFD integrated over time. Use: DLI = PPFD × hours × 0.0036 (PPFD in µmol/m²/s, DLI in mol/m²/day).
What greenhouse light transmission value should I use?
Use a measured canopy-level inside/outside PPFD ratio if possible. As a rough starting range, many commercial greenhouses are ~45–60% PAR transmission at crop level, depending on structure, screens, and cleanliness.
How do I estimate watts and energy cost from a PPFD target?
Estimate power density with fixture efficacy (PPE): W/m² ≈ PPFD_design / µmol/J. Then energy: kWh/m²/day = (W/m² × hours) / 1000.