Engineer the perfect light spectrum for optimal plant growth. Boost your yields and cultivate year-round with our energy-efficient LED solutions. Tell us your needs for a customized lighting strategy and quote.
Welcome to the SLTMAKSknowledge hub. If you want to achieve professional results, using a Grow LED Light Full Spectrum setup is the first step toward success. If you have spent any time browsing for horticultural lighting, you have undoubtedly encountered colorful, wavy graphs known as spectral distribution charts.
As someone who has spent years on the factory floor overseeing the R&D of full-spectrumgrow lights, I know that these charts can appear abstract to the untrained eye. However, to a master grower or an engineer, that wavy line is the DNA of the light fixture; it tells you exactly how that light will interact with your plants’ biology.
Choosing the right lighting is not just about brightness or power consumption; it is about the quality of the photons you are delivering to your canopy. At SLTMAKS, we believe that an educated grower is a successful grower. In this comprehensive guide, we will demystify the science of spectrum charts, breaking down the physics of light into actionable data that will help you select the perfect full-spectrum grow LED light solution for your specific cultivation goals.
Table of Contents
The Fundamentals of Plant Lighting and Spectrum
To understand a spectrum chart, we must first understand what “light” actually means to a plant. While human eyes are evolved to see functionality in the green and yellow parts of the spectrum (which is why high-visibility vests are those colors), plants have evolved over millions of years to utilize a much broader range of solar radiation. When we talk about a grow light full-spectrum, we are referring to a light source that attempts to mimic the sun’s broad output, covering the critical wavelengths that drive photosynthesis and photomorphogenesis.
Defining “Full Spectrum” in the LED Era
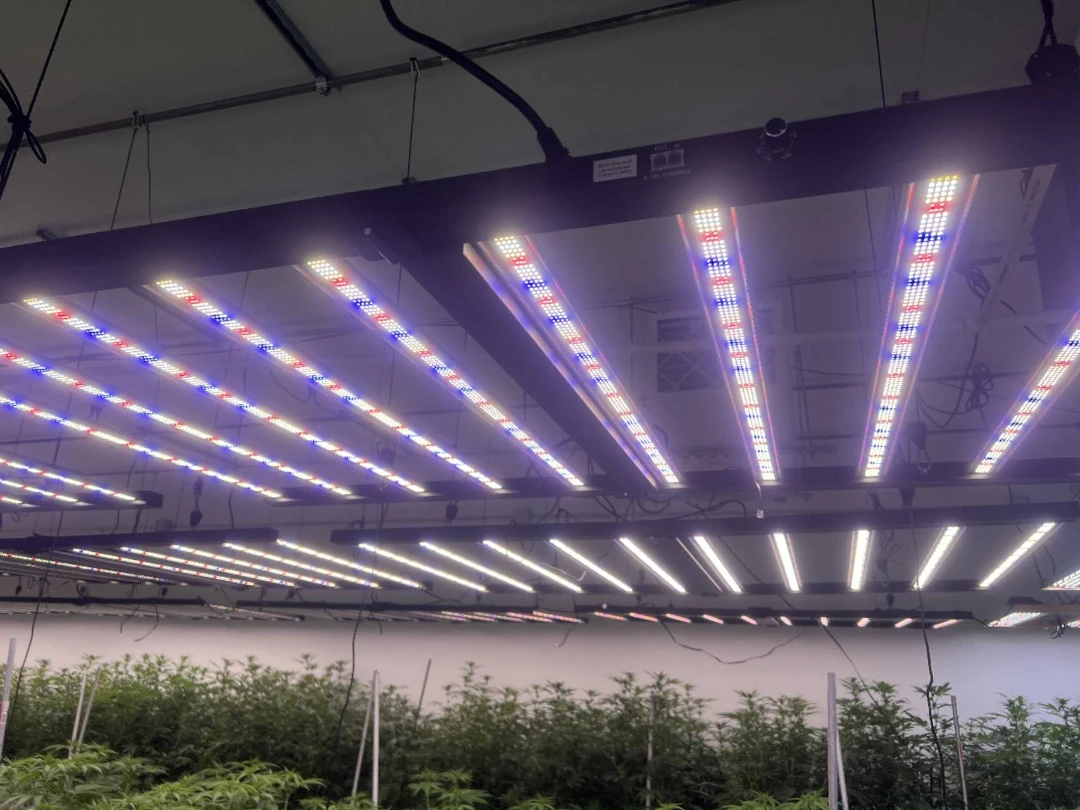
In the early days of LED technology, “grow lights” were often a harsh combination of red and blue diodes, creating a purple or “blurple” hue. While these lights were energy-efficient, they lacked the complexity of natural sunlight. Today, a modern grow light full-spectrum fixture typically utilizes white LEDs (which are actually blue diodes with a phosphor coating) mixed with specific monochromatic red diodes. This creates a light that looks white to the human eye but is rich in the specific photons plants need.
The term “full spectrum” is a marketing term, but scientifically, it generally refers to a light source that covers the PAR (Photosynthetically Active Radiation) range of 400nm to 700nm, and increasingly, the PBAR range (Plant Biologically Active Radiation), which extends from 280nm (UV) up to 800nm (Far-Red). A true grow light full-spectrum fixture provides energy across this entire band, ensuring that, beyond just growing biomass, the plant creates secondary metabolites, terpenes, and robust root structures.
The Difference Between Lux, Lumens, and PAR
One of the most common mistakes new growers make is trying to evaluate a grow light using a standard light meter that measures Lux or Lumens. Lumens are a measure of how bright a light appears to the human eye. Because our eyes are most sensitive to green light, a light source that peaks in green will have a high lumen rating but might be terrible for growing plants.
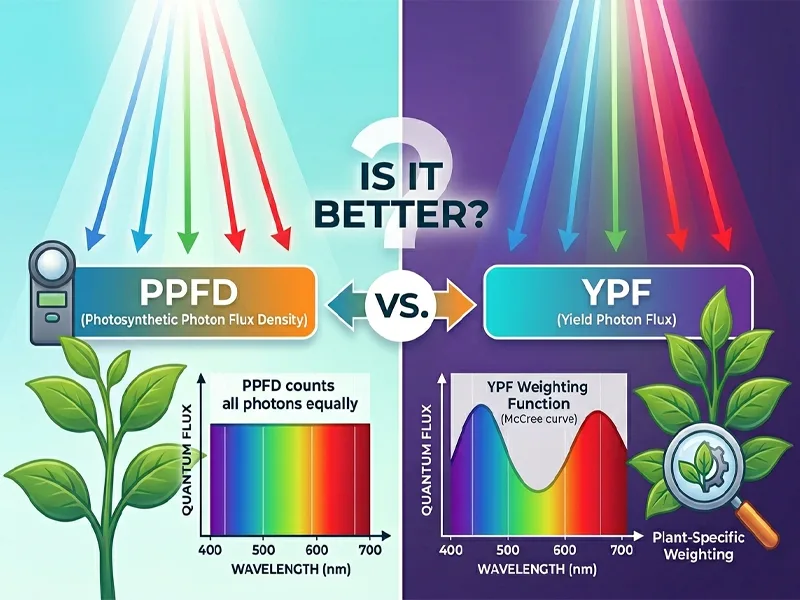
Conversely, PAR (measured in PPFD – Photosynthetic Photon Flux Density) counts the actual number of photons hitting a specific area that are available for photosynthesis. When reading a spectrum chart, we are essentially looking at a map of where that PAR energy is coming from. Is it mostly blue? Is it heavy on the red? This distinction is vital because a high-lumen warehouse light is fundamentally different from a high-PAR grow LED light full-spectrum fixture designed for high-yield agriculture.
Decoding the X and Y Axes of a Spectrum Chart
When you look at the technical specifications of a light on our SLTMAKS website, or any reputable manufacturer’s site, you will see a graph. To read it, you need to understand the coordinate system it uses. It is much simpler than it looks once you know the variables.
The X-Axis: Wavelength (Nanometers)
The horizontal line at the bottom of the chart represents the wavelength of the light, measured in nanometers (nm). This axis usually starts around 300nm or 350nm (Ultraviolet) on the left and goes up to 800nm or 850nm (Infrared) on the right. This is the “rainbow” of the graph.
380-450nm: Violet and Blue light.
495-570nm: Green light.
590-620nm: Yellow and Orange light.
620-750nm: Red and Far-Red light.
As you move from left to right, you are moving from high-energy, short-wavelength photons (UV/Blue) to lower-energy, long-wavelength photons (Red/IR).
The Y-Axis: Relative Intensity (Spectral Irradiance)
The vertical axis represents the relative intensity of the light at each specific wavelength. This is often normalized, meaning the highest peak on the chart is set to 1.0 (or 100%), and everything else is measured relative to that peak.
If the chart shows a peak at 450nm (Blue) reaching 1.0, and the curve at 660nm (Red) only reaches 0.5, it means the fixture emits twice as much radiant energy in the blue spectrum as it does in the red. However, in most high-quality grow LED light full-spectrum fixtures, you will often see dual peaks—one in the blue and a higher one in the red—because red light is the most efficient driver of photosynthesis.
The “Big Three” Ranges: Blue, Green, and Red
To truly analyze a grow LED light full spectrum chart, you need to look at the area under the curve for the three primary color bands. Each band triggers specific hormonal and chemical responses in the plant. At SLTMAKS, we tune our drivers and diode layouts to optimize these ratios.
The Blue Spectrum (400nm – 500nm)
The left side of the chart is dominated by blue light. This wavelength is crucial for the vegetative stage of plant growth. Blue photons strike the cryptochrome and phototropin receptors in the plant, which are responsible for regulating the circadian rhythm and directional growth.
Effects: Promotes compact growth, short internodal spacing, and thick leaves. It also stimulates stomatal opening, allowing the plant to breathe and transpire.
Reading the Chart: If you see a massive spike around 450nm, this light is likely excellent for seedlings, clones, and leafy greens (like lettuce) that need to stay short and dense.
The Green Gap (500nm – 600nm)
For decades, there was a myth that “plants don’t use green light” because they look green (reflecting the color). This has been scientifically debunked. While it is true that chlorophyll absorbs green light less efficiently than red or blue, green light has a unique superpower: penetration.
Effects: Green light can penetrate deeper into the canopy and pass through the top leaves to reach the lower foliage. This drives photosynthesis in the shaded areas of the plant, increasing overall yield.
Reading the Chart: A “white” LED spectrum will have a significant “bump” or broad curve in the green/yellow region. If the chart drops to zero in the green section (like old blue lights), you are missing out on canopy penetration and the ability to visually inspect your plants for pests and disease accurately.
The Red Spectrum (600nm – 700nm)
The right side of the visible spectrum is where the heavy lifting happens. Red light is the most efficient wavelength for driving the photosynthetic reaction. It aligns perfectly with the absorption peaks of Chlorophyll A and B.
Effects: Red light stimulates stem elongation, biomass production, and most importantly, flowering and fruiting.
Reading the Chart: A quality grow light full-spectrum fixture for flowering plants will almost always have a distinct, sharp peak around 660nm. This is often achieved by adding specific mono-red diodes to the white LED board. This peak signals the plant to produce flowers and fruit.
Beyond the Visible: UV and Far-Red
Advanced growers know that the magic often happens at the edges of the visible spectrum. When reviewing charts for high-end horticultural lights, you should look for activity below 400nm and above 700nm.
Ultraviolet (UV) Light (300nm – 400nm)
While high doses of UV can be damaging, small amounts of UV-A (and sometimes UV-B) act as a stressor that signals the plant to protect itself.
The Defense Response: Plants produce sunscreen-like compounds (trichomes, resins, and antioxidants) to protect against UV radiation. For medicinal crops, this means higher potency and terpene production.
Chart Check: Look for a small “tail” on the far left of the graph. Most standard LEDs don’t emit UV, so if a manufacturer claims UV inclusion, you should see a bump in the 380nm range on their spectral chart.
Far-Red Light (700nm – 750nm) and the Emerson Effect
Far-red light is invisible to our eyes but vital for plants. It interacts with the phytochrome system (specifically the Pr to Pfr conversion), which tells the plant when the day is starting and ending.
The Emerson Effect: Research discovered by Robert Emerson shows that when 660nm (Red) and 730nm (Far-Red) light are provided simultaneously, the rate of photosynthesis is higher than the sum of the two lights provided separately. This synergistic effect turbocharges growth.
Shade Avoidance: An abundance of Far-Red can trigger a “shade avoidance response,” causing plants to stretch. However, when balanced correctly in a grow LED light full-spectrum fixture, it promotes rapid flowering and bulkier fruit.
Comparing Spectrum Types: What to Look For
Not all “full spectrum” lights are created equal. Depending on your crop and growth stage, the “shape” of the ideal spectrum chart will look different. Here is a breakdown of common spectral shapes you will encounter in the market.
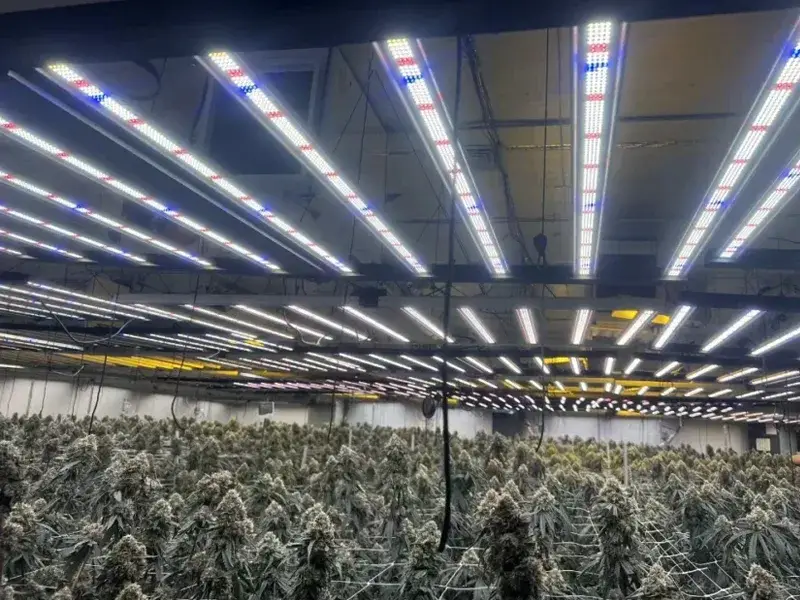
Balanced curve with peaks in Blue and Red, significant Green.
Full cycle growing (Seed to Harvest).
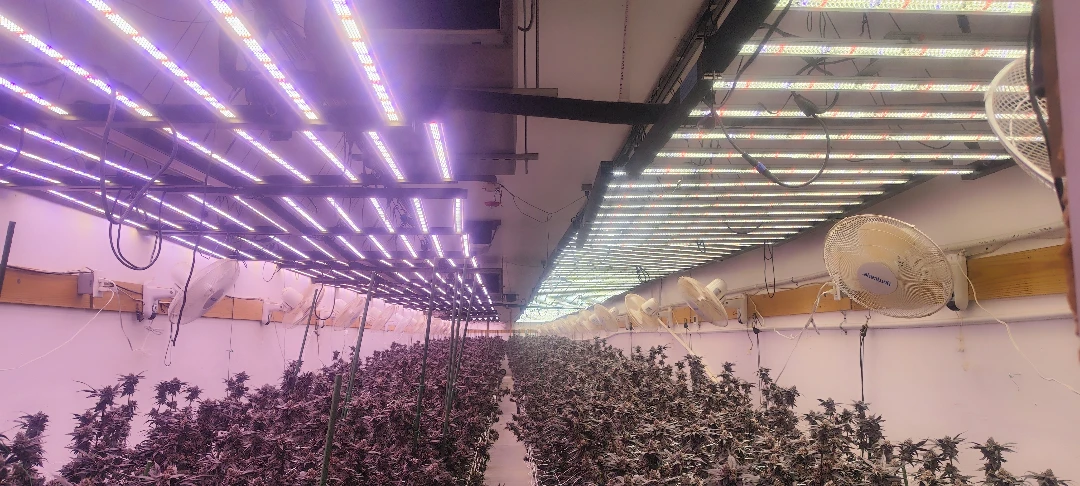
Blurple (Narrow Band)
Pink / Purple
Sharp spikes at 460nm and 660nm only. Valleys at 500-600nm.
Low-budget setups, supplemental lighting.
The 3000K vs. 5000K Debate
You will often see LED lights described by their Correlated Color Temperature (CCT), measured in Kelvin (K).
5000K (Cool White): The chart will show a dominant blue peak. This simulates spring/summer sunlight and is ideal for vegetative growth.
3000K (Warm White): The chart will show a broader, flatter curve that leans heavily into the red/orange/yellow wavelengths. This simulates the lower angle of the autumn sun, signaling plants to flower.
The SLTMAKS Approach: For a versatile grow light full-spectrum solution, we often combine 3000K and 5000K diodes on the same board and accent them with 660nm Deep Red. This results in a “balanced” spectrum chart that offers the best of both worlds.
How to Match the Spectrum to Your Crop
As an editor and a lighting engineer, I often get asked: “What is the best spectrum?” The answer is always: “What are you growing?” Reading the chart is only useful if you know what your plant craves.
Leafy Greens and Herbs
Lettuce, basil, kale, and microgreens do not need to flower. Their value lies in their vegetative mass.
Target Chart: Look for a chart that is “Blue Heavy.” You want a high peak in the 400-500nm range. This ensures the leaves are thick, the flavor is potent, and the plants do not stretch and become leggy. A grow light full-spectrum with a 5000K baseline is usually perfect here.
Fruiting and Flowering Crops
Tomatoes, cucumbers, peppers, and medicinal herbs require high energy to produce fruit.
Target Chart: You need the “Red Hump.” The chart should show significant energy from 600nm to 700nm. Without this, yields will be low, and fruit development will be slow. The red light provides the raw energy needed for the heavy lifting of carbon fixation during the bloom phase.
The Full Cycle Solution
For many hobbyists and commercial growers, changing lights between veg and bloom is impractical.
Target Chart: This is where the modern grow light’s full-spectrum shines. You want a chart that looks somewhat flat but with distinct peaks in both blue and red. It essentially covers all bases. While it might not be 100% optimized for one specific week of growth, it performs exceptionally well from seed to harvest without requiring fixture swaps.
The Relationship Between Spectrum and Efficiency (PPE)
When you look at a spectrum chart, you are also looking at an efficiency map. Different colors of light require different amounts of electricity to produce.
Red Efficiency: Red LEDs are generally very efficient at converting electricity into photons.
Green/White Efficiency: Creating white light involves phosphor conversion, which results in a slight energy loss (Stokes shift).
Blue Efficiency: Blue LEDs are the core technology and are highly efficient.
When you see a grow light with a full spectrum and a very high PPE (Photosynthetic Photon Efficacy) rating (e.g., 2.8 µmol/J or higher), check the spectrum chart. You will likely see a very strong red peak. Manufacturers often boost the red content not just for plant growth, but because it boosts the overall efficiency rating of the fixture on paper. As a buyer, ensure that this high efficiency hasn’t come at the cost of a completely unbalanced spectrum.
Interpreting Data: Common Marketing Tricks
In my years in the industry, I have seen many misleading charts. Here is how to spot them so you can buy with confidence.
The “Smoothed” Curve
Some manufacturers use low-resolution spectrometers to generate their charts. This results in a smooth, pretty line that hides gaps in the spectrum. A real grow light full-spectrum chart should look a bit jagged or spiky, especially around the peaks. This detail proves that the data is high-resolution and authentic.
Ignoring the Y-Axis Scale
Always check if the Y-axis is linear or logarithmic. Most are linear. Also, ensure that the chart isn’t just a generic “theoretical” graph of a diode. You want the actual spectral test report of the entire fixture. The presence of a glass lens or a conformal coating over the LEDs can slightly shift the spectrum and reduce UV transmission, which a theoretical diode chart won’t show.
The “Sunlight” Claim
Many companies simply overlay the solar spectrum onto their LED chart to show how “close” they are. While mimicking the sun is a good goal, the sun wastes a lot of energy in UV and Heat (IR) that you don’t necessarily want to pay for on your electric bill. A perfect match to sunlight isn’t always the most efficient grow light. A tailored grow light with a full spectrum focuses energy where plants need it most, rather than wasting watts on wavelengths that provide diminishing returns.
Scientific Validation: Why Spectrum Matters
The impact of spectrum is not just anecdotal; it is backed by rigorous plant physiology research. The McCree Action Spectrum was one of the first studies to map exactly which wavelengths plants use for photosynthesis. McCree found that plants use virtually all visible light, but with peaks in efficiency in the red and blue.
Furthermore, studies from institutions like Utah State University’s Crop Physiology Laboratory have redefined our understanding of light, helping to push the industry from simple PAR measurements to ePAR (extended PAR), acknowledging the vital role of Far-Red light in driving photosynthesis. This scientific backing is why modern grow light full-spectrum fixtures are designed the way they are—they are engineering solutions to biological questions.
How SLTMAKS Designs for the Ideal Spectrum
At SLTMAKS, our R&D process begins with the plant, not the hardware. We study the photobiological requirements of target crops and reverse-engineer the spectrum to match.
Diode Selection: We source top-tier diodes that offer consistent wavelength output. We bin our LEDs to ensure that a 660nm red diode is actually 660nm, not 650nm.
Spectral Tuning: We simulate different ratios of 3000K, 5000K, 660nm, and 730nm diodes.
Real-World Testing: We don’t just rely on charts. We grow plants. We measure internodal spacing, terpene profiles, and total biomass yield.
When you buy an SLTMAKS grow LED light full-spectrum fixture, you aren’t just buying metal and plastic; you are buying a calibrated instrument designed to replicate the best days of summer, every single day, indoors.
Empowering Your Growth with Data
Reading a spectrum chart is a superpower. It allows you to look past the marketing hype, the flashy packaging, and the bold claims, and see the naked truth of the light fixture. By understanding the balance between blue for structure, green for penetration, and red for biomass, you can predict exactly how your plants will grow before you even plant a seed.
A grow light with a full spectrum is the engine of your indoor garden. The spectrum chart is the blueprint of that engine. We hope this guide has illuminated the technical nuances of spectral science. At SLTMAKS, we are committed to transparency and performance. We encourage you to analyze our spectrum charts, compare them with the competition, and see the difference that precision engineering makes.
Whether you are a commercial facility manager looking to maximize gram-per-watt or a home hobbyist trying to grow the perfect tomato in winter, understanding light quality is your key to success. If you have further questions about interpreting our charts or need a recommendation for your specific setup, our team of experts is always here to assist.
FAQ
What exactly is a “Grow LED Light Full Spectrum”?
A Grow LED Light Full Spectrum refers to an artificial lighting system that mimics natural sunlight. It provides a continuous range of wavelengths—typically from 380nm (UV) to 780nm (IR)—to support plants through every stage of their life cycle, from seedling to harvest.
Why are Red and Blue wavelengths prioritized in the spectrum chart?
Red and Blue are the primary drivers of photosynthesis. Blue light (400-500nm) is essential for healthy vegetative growth and strong stems, while Red light (600-700nm) is most efficient for photosynthesis and is critical for triggering flowering and fruit production.
How do I read the PPFD values in a full-spectrum guide?
PPFD (Photosynthetic Photon Flux Density) measures the amount of light that actually reaches the plant canopy. A high-quality Grow LED Light Full Spectrum guide will show PPFD maps to ensure your plants receive the right intensity (µmol/m²/s) for their specific growth stage, preventing light burn or stunting.
Is the green light useful in a Grow LED Light Full Spectrum?
Yes. While plants reflect some green light, they also absorb a significant portion of it. Green light penetrates deeper into the plant canopy than red or blue light, reaching lower leaves and improving overall photosynthetic efficiency in dense indoor gardens.
What are the benefits of including UV and IR in the spectrum?
Including UV (Ultraviolet) can increase secondary metabolites like oils and resins, enhancing plant defense and potency. IR (Infrared/Far-red) helps trigger the “shade avoidance response,” which can promote stretching when needed and speed up the transition from the vegetative to the flowering stage.