Introduction
This guide is for commercial indoor cultivation operators who already know LED basics—and now need a defensible way to answer a harder question: when is it rational to replace fixtures that still turn on, but may no longer deliver the canopy performance you budgeted for?
You will learn:
- Why L90/Q90 ratings are useful for planning but insufficient for replacement decisions on their own.
- How to treat canopy PPFD mapping and PPFD uniformity as the control variables.
- How to convert performance drift into a simple ROI decision using payback and (optionally) NPV.
Table of Contents
Who This Guide is for and What You Will Learn
If you’re responsible for multi-room consistency, budgeting, and inspection-ready documentation, you’ve likely seen the pattern:
- A room still “meets spec” on paper.
- Meanwhile, edges drift low, minimum PPFD falls, and growers compensate with dimming headroom, hanging-height tweaks, or more hours.
- The crop becomes less predictable before anything “fails.”
This post is written to help you replace lighting based on measured canopy outcomes, not guesswork.
Why L90/Q90 Alone is Not Enough—Focus on Canopy PPFD
L90 is a lumen-maintenance life point: a product retains 90% of its initial light output at a stated operating time. According to the definition of lumen maintenance, lumen maintenance is the percentage of initial luminous flux remaining at a selected time (e.g., L90 = 90% maintained).
That definition is not wrong—it’s just not the whole cultivation story.
In commercial indoor rooms, your replacement decision should answer:
- Are you still hitting your target canopy PPFD where the crop actually is?
- Are you still hitting it uniformly enough that the minimum zones aren’t dictating quality and schedule?
- Are you paying more (energy, HVAC, labor, downtime) to “hold the line” than a replacement would cost?
A fixture can be “alive” and still be a poor production asset if your canopy plane and uniformity are drifting.
How to Decide When to Replace LED Grow Lights Using ROI
Replacement is a capex decision. The trigger must ultimately be financial—not emotional.
A workable operator approach:
- Baseline the room at commissioning: PPFD grid + uniformity + controls settings.
- Monitor on a cadence: spot checks and periodic re-maps.
- Diagnose the cause of drift (soiling, thermal constraints, drivers, layout change).
- Model ROI using conservative assumptions.
- Replace when payback clears your threshold and operational risk is rising.
The recommendations below use conservative defaults and clearly label them as starting points.
Replacement Triggers to Replace LED Grow Lights
The cleanest replacement trigger is not “hours on the clock.” It’s performance delivered at the canopy, plus whether that performance can still be maintained efficiently and reliably.
Think in three layers:
- Photometric triggers (PPFD / uniformity/headroom)
- Operational triggers (maintenance and failure modes that predict instability)
- Financial triggers (ROI / payback/opportunity cost)
L90/Q90 vs. Canopy PPFD
This is the practical heart of the decision: L90 vs PPFD.
L90/Q90 metrics are helpful as fleet-planning milestones but blunt as room-control metrics.
Why L90 can diverge from canopy PPFD in real rooms
- The canopy plane changes. Crops grow, benches shift, and the reference height drifts unless you enforce it.
- Optics get dirty. Even light haze can reduce PPFD and can distort distribution.
- Thermals change. Dust-loaded heat sinks and restricted airflow push component temperatures up.
- Electronics drift. Drivers can drift before they fail.
What matters operationally is not “hours to L90,” but delivered canopy PPFD and uniformity at your real operating settings.
Key Takeaway: Use L90/Q90 for budget planning; use canopy PPFD mapping for replace/monitor decisions.
Uniformity and Headroom Thresholds
For commercial production, minimum PPFD is often the first place you pay the price. Averages can look fine while edges and overlap zones drift below target.
Two metrics to track continuously:
- Average canopy PPFD at your reference plane
- Uniformity as min/avg across a repeatable grid (your PPFD uniformity score)
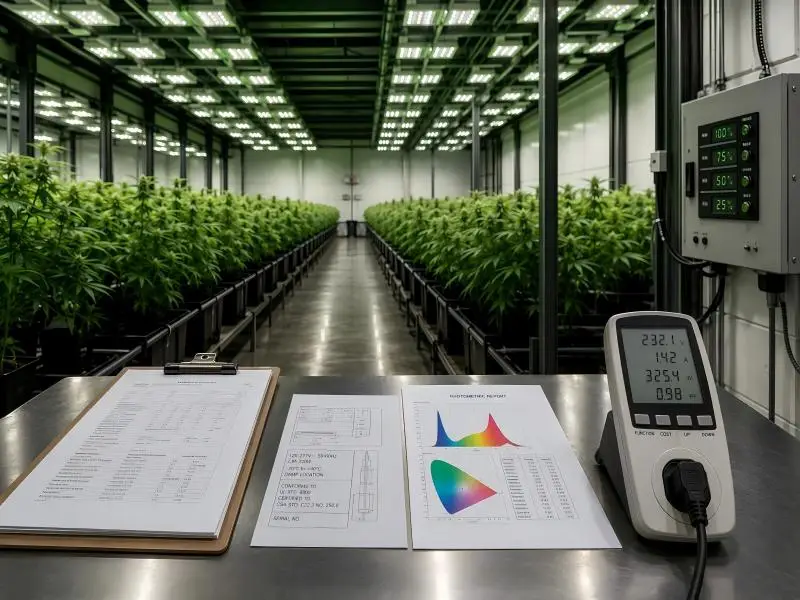
A professional light-mapping workflow emphasizes canopy-level measurement, edge/corner inclusion, and uniformity-first interpretation. Flexstar’s light mapping guide is a good example of that framing.
Conservative default thresholds (start here, then tune)
Use these as operator defaults when you don’t already have internal triggers:
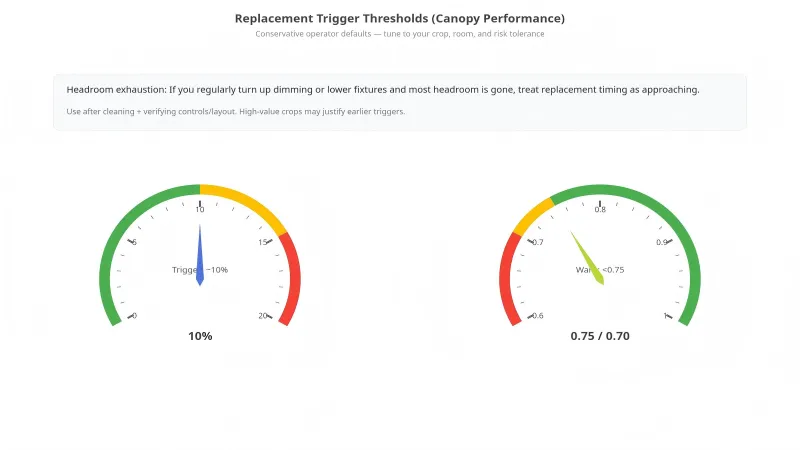
- Average canopy PPFD decline: sustained ~10% drop from your post-commissioning baseline (after cleaning and after ruling out controls/layout changes).
- Uniformity (min/avg) floor: if min/avg falls below ~0.75, you should expect variability costs (uneven morphology, uneven finish times). If it approaches ~0.70, treat it as a red flag.
- Headroom exhaustion: if you’re repeatedly compensating by turning up dimming or lowering fixtures and you’ve consumed most of your dimming headroom, you’ve effectively pulled replacement forward.
These are conservative because they’re meant to be safe across crops and room types. High-value crops and tight production scheduling often justify earlier triggers.
Operational Warning Signs
Photometrics tell you what is happening. Operational symptoms often tell you what will happen next.
Treat these as replacement triggers—especially when they correlate with PPFD drift:
- Output instability: visible flicker, intermittent dimming behavior, or inconsistent output at the same control input.
- Rising driver events: nuisance trips, growing driver replacement rate, hot-to-touch driver housings.
- Ingress/connector issues: corrosion, moisture intrusion, repeated connector reseating.
- Heat-related symptoms: fixtures running hotter than historical norms; localized hot spots around clogged fins.
- Maintenance burden creep: optics haze returns faster; cleaning time is increasing; residue becomes “normal.”
The key operator insight: when warning signs stack, replacement becomes a risk-management decision, not only an efficiency decision.
Diagnostics and Degradation
Replacement decisions improve dramatically when you run diagnostics like a production asset program—because you can separate issues you can fix (cleaning, airflow, driver swaps) from issues that justify capex.
Field PPFD Mapping Cadence
A PPFD map only helps if it is repeatable.
A disciplined program includes:
- A fixed measurement plane (your canopy reference height)
- A consistent grid that includes edges/corners
- Stable operating settings (warm-up, dimming %, photoperiod)
- Recorded metadata (sensor calibration, room, fixture batch, canopy height)
A practical cadence for commercial rooms
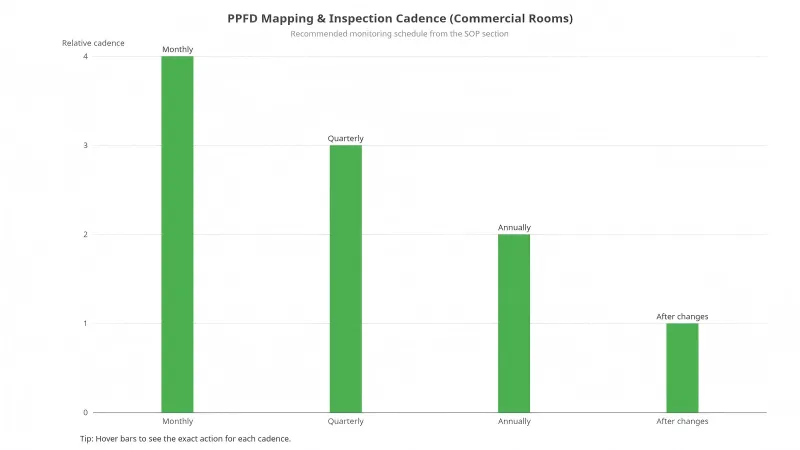
- Monthly: visual inspection (optics haze, heat sink dust, connectors, corrosion).
- Quarterly: PPFD spot checks at fixed points (center + corners) and a quick uniformity sanity check.
- Annually: representative-zone PPFD grid mapping and a review of dimming stability.
- After changes: re-map after any change in mounting height, layout, crop strategy, or control setpoints.
If you manage multiple rooms or sites, make the grid and reference plane part of the SOP. Consistency is what makes drift measurable.
Thermal, Soiling, and Driver Aging
In the field, PPFD decline is rarely a single cause. It’s usually an interaction of:
- Soiling and optical loss
- Thermal constraints
- Driver aging and electrical drift
Soiling: optics are a photometric variable
Commercial grow rooms are not clean rooms. Dust, aerosols, and sanitation cycles create haze on optics that reduces PPFD and can distort distribution.
A good SOP treats cleaning as a controlled task:
- Lockout/tagout (LOTO)
- Choose methods based on fixture IP rating
- Avoid solvents/abrasives that damage lenses and seals
- Verify recovery with PPFD spot checks
A practical reference is the SOP-style workflow in SLTMAKS: How to Safely Clean Commercial LED Grow Lights, which ties cleaning discipline to measurable PPFD recovery.
Thermal: when heat sinks become a replacement trigger
Clogged fins and restricted airflow raise operating temperature. Before anything fails, it can show up as:
- Output sag during the photoperiod
- Increased driver stress
- Faster long-term degradation
If you see a rising heat trend and the fixture design makes thermal cleaning difficult (or risky), replacement can be justified sooner because maintenance labor and downtime risk become part of TCO.
Driver aging: drift before failure
Drivers can drift before they die. Watch for:
- Inconsistent output at the same control input
- Flicker or instability under dimming
- Increasing nuisance trips
Even if you’re not ready to replace an entire room, tracking driver drift by batch helps you decide between “service this batch” and “replace this bay.”

Spectrum Stability Checks
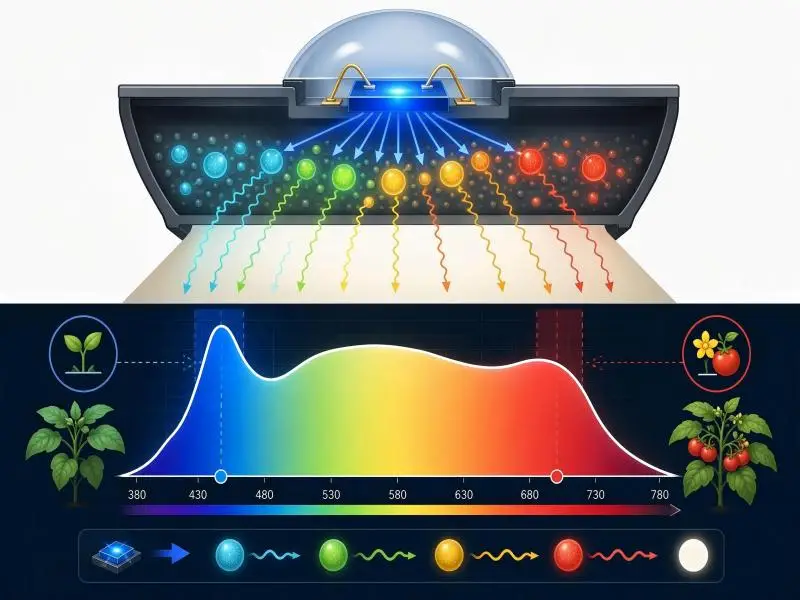
Spectrum stability is often discussed in marketing terms, but operators should treat it as a process-control variable.
If spectrum or channel behavior drifts across fixtures, you can see:
- Inconsistent morphology across a room
- Unpredictable stretch/compactness
- Harder-to-control finishing consistency
A practical field protocol
Define a repeatable protocol that fits your resources:
- What: channel behavior (if tunable), overall spectral shape stability, and PPFD stability at fixed points.
- Where: one representative zone per room at a fixed measurement geometry.
- When: commissioning baseline, after major maintenance events, and periodically (often annual) if spectrum is part of your quality spec.
If you have access to a spectrometer, log relative spectral distribution at the same geometry and compare against the baseline. If you don’t, you can still catch many failures by validating:
- PPFD stability at fixed points
- Repeatable dimming response
- Absence of flicker or channel inconsistency
How maintenance-friendly design supports stability (SLTMAKS example)
Thermal and optical serviceability isn’t just convenience—it affects how feasible it is to keep fixtures operating within intended conditions over long duty cycles.
In practical terms:
- Thermal design that is easy to keep clean supports lower operating temperatures and more stable long-run behavior.
- Optical design that tolerates real grow-room cleaning helps you recover PPFD without creating haze, scratches, or seal damage that cause ongoing distribution drift.
When evaluating replacement candidates, ask vendors to show the maintenance logic (how optics and heat sinks are cleaned safely and repeatably) and to explain how they validate spectrum stability over time.
As one example, SLTMAKS positions its commercial fixtures around maintenance-friendly thermal management and serviceable optics so routine cleaning and inspection are achievable at facility cadence—and it frames spectrum stability as something that should be validated with a method, not asserted with a chart.
ROI Thresholds and Payback
Photometrics tell you whether you’re drifting. ROI tells you whether you should spend capex now.
A replacement model should answer:
If we replace fixtures to recover PPFD headroom and/or improve PPE, do the annual savings and risk reduction pay back fast enough to justify the disruption?
Inputs for the ROI Mini-worksheet
At the consideration stage, your model should be simple enough for procurement conversations but auditable.
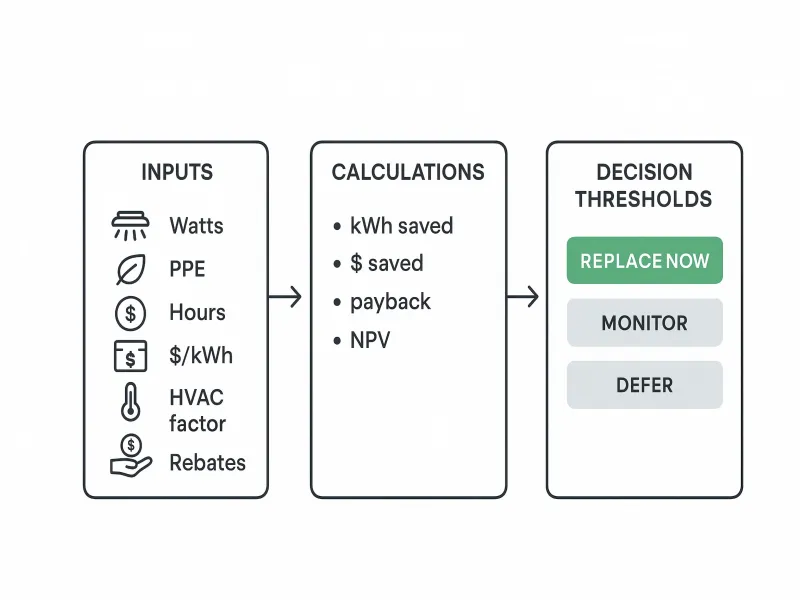
Inputs:
- Current fixture wattage (W_old)
- Proposed fixture wattage at the same target PPFD (W_new)
- Number of fixtures (N)
- Operating hours (hours/day, days/year)
- Electricity rate (kWh)
- Current PPE and proposed PPE (to justify W_new assumptions)
- HVAC interaction assumption (cooling-limited or not; HVAC efficiency if known)
- Rebates/incentives ($)
- Installation and electrical work ($)
- Maintenance labor/parts delta (year)
If you need a structured template, FYTech’s LED grow light ROI calculator framing uses the same core inputs (watts, hours, $/kWh, HVAC factor, rebates) to organize the math.
PPE Gains and HVAC Interaction
If a new system delivers the same canopy PPFD with fewer watts, you typically benefit twice:
- Lower lighting electricity
- Lower heat load into the room, often lowering cooling energy in mechanically cooled rooms
A practical linkage is:
- 1 W ≈ 3.412 BTU/hr
This relationship is commonly used to connect lighting wattage to heat load. For horticulture rooms specifically, SLTMAKS’ HVAC discussion uses the same conversion to show why lighting efficiency interacts with cooling.
Conservative operator advice:
- Add HVAC savings only when you have reason to believe the room is cooling-limited during lights-on hours.
- If you have HVAC efficiency data, model it; if you don’t, keep the HVAC factor modest so you don’t overstate payback.
Incentives and Replacement Timing
Rebates can move the decision boundary, but only if you can qualify.
Best practices:
- Confirm eligibility early (listing requirements and documentation).
- Treat rebates as a reduction to net capex, not as guaranteed revenue.
- If incentives have a deadline, align replacement batches to the incentive window.
SOP and Risk Management
The best replacement outcomes come from treating lighting like a validated production system: baseline it, monitor it, and change it under change control.
Commissioning and Baselines
If you don’t have baselines, you can’t prove drift—and you can’t defend replacement timing.
A commissioning baseline should include:
- PPFD grid map at the canopy reference plane (representative zone)
- Uniformity as min/avg
- Dimming setpoints used during mapping
- Sensor model + calibration date
- Mounting height and layout notes
Phased Replacement Strategy
Full-room swaps concentrate risk. A phased strategy reduces exposure:
- Replace one representative bay/zone.
- Commission it (PPFD + uniformity + control behavior).
- Run at least one cycle to confirm stability.
- Scale in batches aligned to downtime windows.
This also improves procurement alignment: acceptance criteria are defined before the full PO.
Compliance and Documentation
Commercial facilities should assume major lighting changes will be reviewed by safety teams, insurers, and local authorities.
Maintain:
- Fixture safety listings and suitability for the space
- Installation documentation and as-builts
- Maintenance SOPs and cleaning records
- Commissioning PPFD maps and uniformity metrics
For washdown and high-humidity environments, IP ratings are not a marketing detail; they’re a reliability boundary condition. A practical reference is SLTMAKS’ IP rating guidance for commercial grow environments, which ties sanitation reality to ingress risk at connectors and cable glands.
Conclusion
You don’t replace LED grow lights because the calendar says so. You replace them when measured canopy performance no longer meets targets efficiently—and when the ROI math says capex is cheaper than drift.
Actionable starting thresholds you can implement immediately:
- Establish a repeatable canopy PPFD mapping baseline (average + min/avg).
- Treat a sustained ~10% average PPFD decline from baseline (after cleaning and verification) as the point to model replacement ROI.
- Treat min/avg dropping below ~0.75 as an early-warning uniformity issue; treat ~0.70 as a red flag.
- If you’ve consumed most of your dimming headroom to keep minimum PPFD on target, assume replacement timing is approaching.
The operational thread is consistent: diagnostics (mapping + maintenance) create measurable inputs; those inputs drive ROI; ROI drives scheduling.
If you want, I can convert the ROI mini-worksheet into a one-page commissioning-and-replacement checklist your team can use across rooms and sites.
FAQ
What does L90 mean for LED grow lights—and does it indicate failure?
L90 is a lumen-maintenance life point: it means a light source is expected to maintain 90% of its initial luminous flux at a stated operating time. It’s a depreciation milestone, not a hard “end-of-life” failure point. For definitions and context, see Wikipedia’s lumen maintenance overview.
How long should you let LED grow lights stabilize before taking PPFD readings?
For repeatable measurements, you want the fixture output to be stable before logging values. Some field guidance suggests about 1 minute is enough for LEDs, and recommends monitoring the reading until it stops drifting before recording. See Grow Light Meter’s Photone calibration guide for a practical warm-up/stability check.
What is “PPFD mapping,” and why do edges and corners matter?
A PPFD map is a grid of PPFD readings at the canopy plane that shows spatial distribution across the entire grow area. Including edges and corners matters because center-only readings can hide weak zones that drive crop variability. For a practical explanation of professional light-mapping and uniformity framing, see Flexstar’s light mapping guide.
What does “uniformity” usually mean in horticulture lighting, and how is it calculated?
Uniformity is commonly assessed by comparing the lowest and average light levels across a measurement grid (often expressed as min/avg in cultivation workflows). Definitions and common ways to evaluate it are summarized in PL Light’s uniformity article and discussed from a horticulture perspective in IES FIRES: Lighting Uniformity in Horticulture.