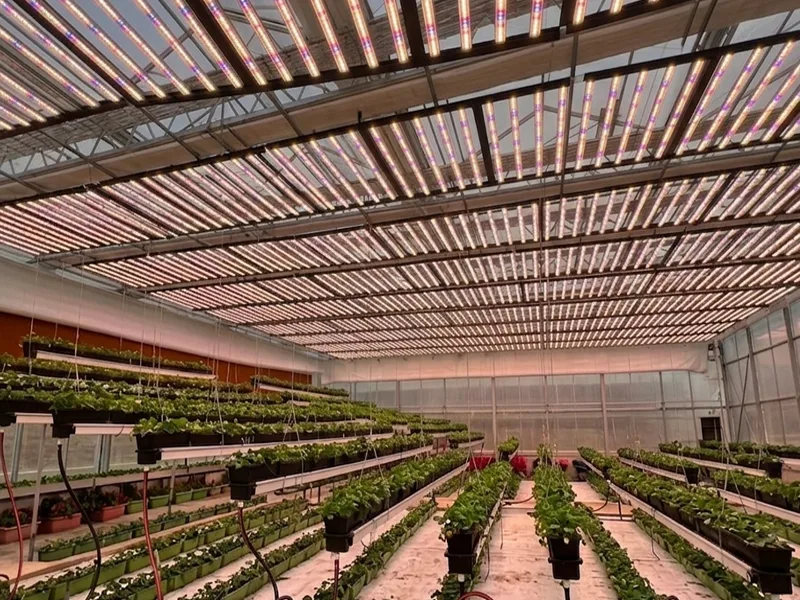
Engineer the perfect light spectrum for optimal plant growth. Boost your yields and cultivate year-round with our energy-efficient LED solutions. Tell us your needs for a customized lighting strategy and quote.
If you’re evaluating Emerson effect grow lights for a commercial indoor farm, you’re not chasing a novelty wavelength—you’re looking for a measurable way to increase output per kWh, reduce risk in a tight production window, or simplify standardization across rooms and sites.
That’s why the 660 nm + 730 nm pairing keeps coming up. Deep red around 660 nm is a workhorse for photon efficiency and flowering-heavy recipes. Far‑red around 730 nm is often treated as “morphology lighting,” but it also has a photosynthesis mechanism when it’s paired correctly.
The Emerson enhancement effect (sometimes called the Emerson effect) is the reason: photosynthesis can increase more than additively when shorter-wavelength red photons and far‑red photons hit the leaf at the same time, because the two photosystems are being excited in a more balanced way. For a historical definition, see the Emerson effect overview (Wikipedia, updated 2025) and then rely on peer‑reviewed work for the operational details.
This guide is written for operators who need deployment control: how to set targets without inducing unwanted stretch, how to measure far‑red as part of ePAR (extended photosynthetically active radiation), how to wire and schedule a two‑channel system, and how to keep procurement and inspectors comfortable with the installation.
Table of Contents
Mechanism and physiology
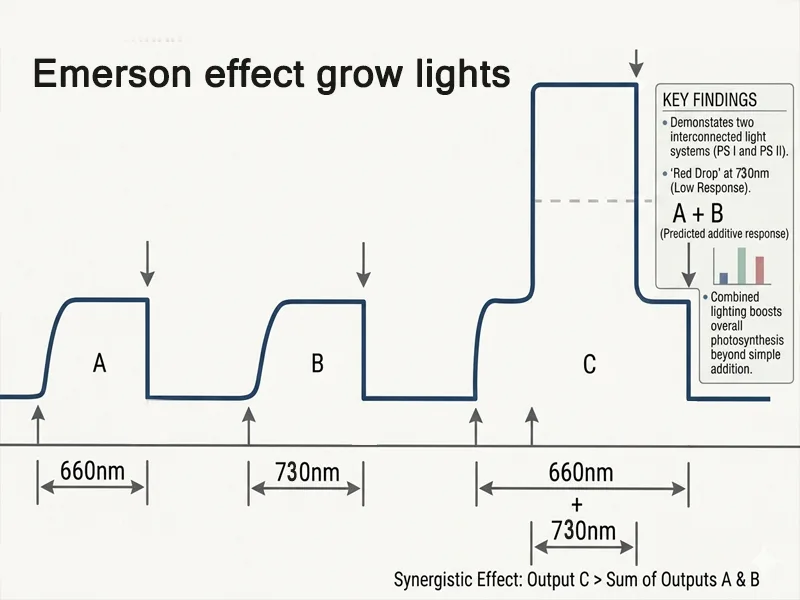
Balancing PSI/PSII to overcome the red drop
The quickest way to make the Emerson effect practical is to stop thinking in “colors” and start thinking in Photosystem II (PSII) and Photosystem I (PSI).
660 nm deep red strongly drives PSII.
730 nm far‑red preferentially excites PSI.
When you push one photosystem harder than the other, you create a bottleneck in the electron transport chain. The classic “red drop” describes a sharp decline in photosynthetic efficiency when illumination is dominated by longer wavelengths beyond ~680–700 nm. Far‑red photons alone don’t sustain strong photosynthesis because PSII isn’t being sufficiently excited.
The Emerson enhancement effect shows up when the spectrum gives both photosystems what they need at the same time. A modern example is described in the peer‑reviewed paper “Revisiting the Enhancement Effect in Photosynthesis…” (2025), which reports that adding far‑red to a broadband spectrum can raise the quantum yield of CO₂ fixation beyond what an additive model would predict—especially in shade‑like conditions where far‑red is already a meaningful fraction of the spectrum.
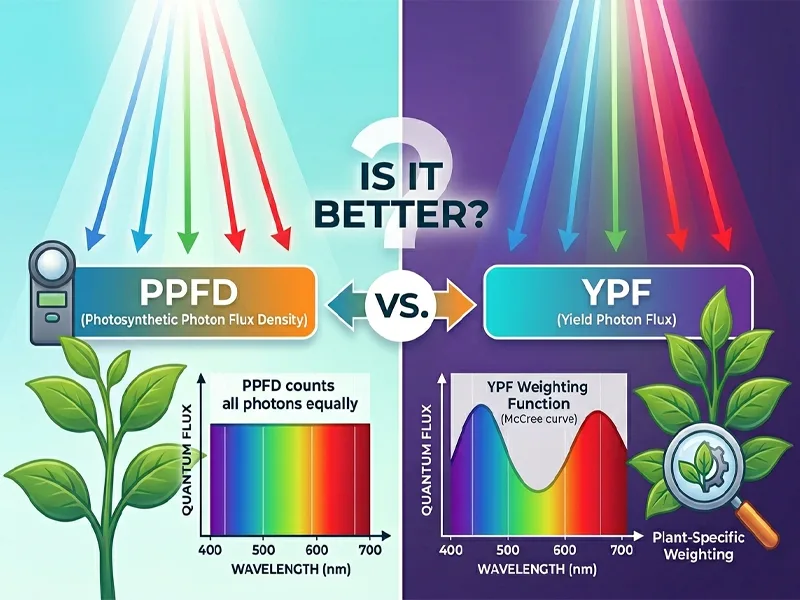
Operationally, that translates to a rule of thumb: 660 + 730 works best as a balancing tool, not as a replacement for PAR photons or as a “magic yield switch.” You still need sufficient PPFD (photosynthetic photon flux density, 400–700 nm) and the rest of your environmental controls (CO₂, VPD, nutrition) to make the biology pay off.
From photons to ePAR: positioning 701–750 nm in practice
Traditional PAR definitions stop at 700 nm, which can under-describe what a red+far‑red system is doing. The industry is moving toward ePAR 400–750 nm to capture the contribution of far‑red photons in the 701–750 nm band.
For operators, the key point is not academic. It’s control—and it’s how you keep an Emerson effect grow lights deployment measurable across rooms.
If you’re budgeting energy, checking recipe compliance across zones, or comparing fixtures, you can’t tune what you don’t measure. A PAR-only meter may report “no change” while you’ve materially changed canopy photons in the far‑red band.
Morphology via phytochrome and PSS targets
Far‑red isn’t just a photosynthesis contributor. It’s also a signal.
Plants use phytochrome to sense the balance between red and far‑red, shifting between Pr and Pfr forms. That signal changes morphology (internode length, leaf expansion, canopy architecture) and can interact with flowering responses depending on species and photoperiod strategy.
In practice, operators often track one or more of these:
R: FR ratio (red far-red ratio; definitions vary by band)
FR% (far‑red fraction as a share of photons in a defined range)
PSS (phytochrome PSS; phytochrome photostationary state). This is the control-friendly way many teams track far‑red signaling without over-fixating on a single red far-red ratio.
The important control insight is that photosynthesis goals and morphology goals are not always aligned. If you add far‑red to “capture Emerson” without guardrails, you can get a stretch you didn’t plan for. If you avoid far‑red entirely to prevent stretch, you may leave photosynthetic efficiency on the table in certain canopy and intensity conditions.
If you want a deeper, SLTMAKS-specific primer on the signaling side (Pr/Pfr and practical target thinking), see SLTMAKS: phytochrome control and PSS targets. In the field, this is the difference between “660 730 nm grow light” as a buzz-phrase and a recipe you can actually govern.
Practical ranges and timing
Red:far‑red ratios and FR fractions that work
There isn’t a single universal “best” R: FR or FR% that travels cleanly across crops, cultivars, and facility designs. But you can build practical targets if you keep two principles in mind.
First: choose a measurement definition and stick to it. R: FR can be calculated using narrow bands (e.g., 655–665 and 725–735 nm) or broader integration windows, and it can change materially under mixed spectra.
Second: treat far‑red targets as bands with guardrails, not as a fixed number.
A workable operator approach:
Define a baseline recipe (your existing 660‑heavy program).
Add a controlled far‑red fraction to test the Emerson response and morphology impact.
Track outcomes by stage (veg/transition/flower) instead of trying to force one setting across the whole cycle.
⚠️ Warning: The same far‑red addition that improves light interception via leaf expansion can also increase internode extension. If height, spacing, or airflow margins are tight, treat far‑red as a commissioning variable, not an afterthought.
If your team searches for a preset, the query is usually some version of “far-red 730 nm end of day” (far-red 730 nm end of day). The reality is you’re choosing between a photosynthesis co‑illumination strategy and a signaling strategy.
Two patterns show up in commercial facilities:
Continuous far‑red (low, steady):
Used when the goal is a consistent spectral environment.
Easier to standardize in multi-zone facilities because the schedule is simple.
More likely to interact with canopy architecture over time.
End‑of‑day far‑red (EOD‑FR):
Used when you want a strong phytochrome signal with limited energy and limited impact on the full photoperiod.
Operationally attractive when you’re controlling stretch tightly or you want a distinct “day close” routine.
The key is to decide what you’re trying to control:
If you’re chasing photosynthesis synergy, your relevant variable is the co-illumination window where 660 and 730 are present together.
If you’re chasing signaling, your relevant variable is the PSS shift you create near lights‑off.
Guardrails by PPFD, CO2, and crop stage
Treat far‑red tuning as part of an environment package, not an isolated channel.
PPFD: Far‑red is not a substitute for insufficient intensity. If you’re below your target PPFD, fix the base photon budget first.
CO₂: Under enriched CO₂, the ceiling on photosynthesis moves upward; if your canopy and airflow can supply CO₂ effectively, the incremental value of balanced photosystem excitation can become easier to realize.
Crop stage: Early-stage morphology decisions are compound. A far‑red strategy that is acceptable late in the cycle may be a structural problem early on.
A controlled way to deploy is to define stage-specific “allowed ranges” for far‑red contribution and to enforce them in the controller with hard limits.
Measurement and controls
ePPFD/eDLI logging with extended‑range sensors
If you’re going to tune 730, measure it.
ePPFD is the photon flux density across 400–750 nm.
eDLI is the daily light integral across that same band.
A practical instrumentation path is to adopt an ePAR-capable sensor (or a setup that logs PAR and far‑red bands separately) and to standardize sensor placement at canopy height across rooms.
For measurement background and definitions, Apogee’s ePAR explainer is a clean reference. If you want a quick operational framing of why ePAR changes “effective photons,” MSU’s 2024 ePAR note is also useful.
From a controls standpoint, your minimum viable logging stack is:
time-stamped ePPFD (or PAR + FR)
photoperiod schedule (including any EOD window)
zone identifiers
CO₂ setpoints and actuals
That’s enough to run disciplined A/B trials and to defend spectrum decisions internally.
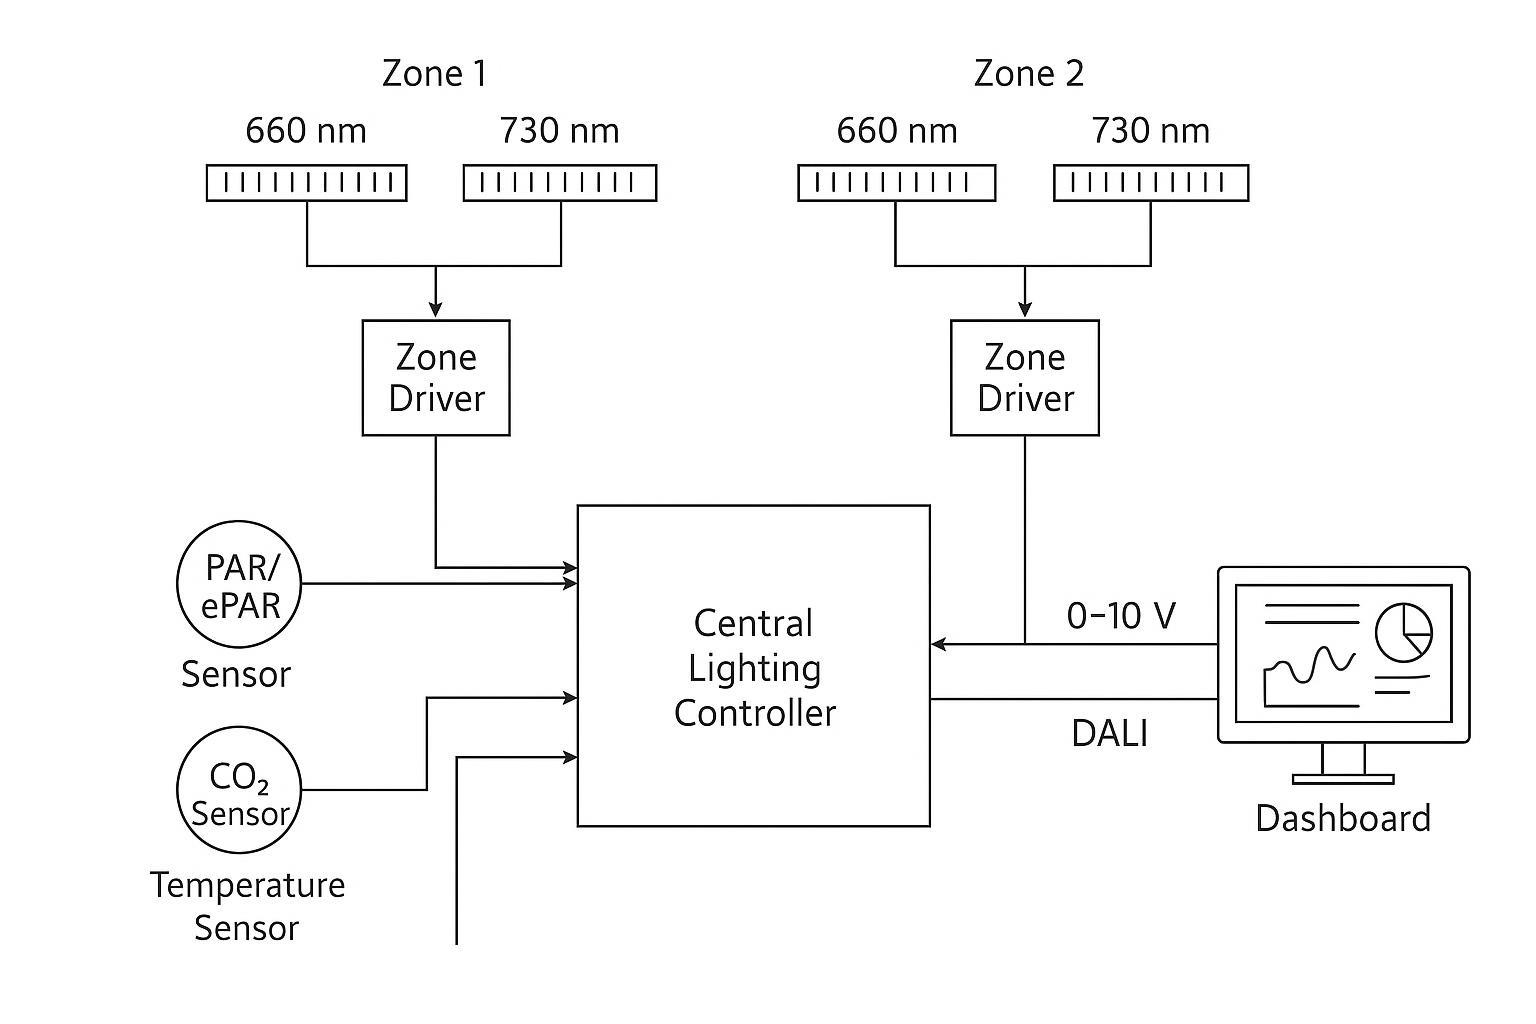
0–10 V/DALI scheduling and zone tuning
Most commercial facilities can run two-channel spectral control with either:
0–10 V: simple analog dimming per channel/zone.
DALI (Digital Addressable Lighting Interface): addressable control with better monitoring and commissioning overhead.
A practical selection rule:
If you need basic recipe schedules and a small number of zones, 0–10 V is often sufficient.
If you need per‑fixture addressing, diagnostics, and tighter commissioning records, DALI can justify itself.
Either way, treat “zones” as your operational unit: zones let you run controlled trials, compensate for racking differences, and accommodate crop staging without rewiring the building.
Interpreting fluorescence and spectrum data
Fluorescence tools can be valuable, but only if they answer a decision you can act on.
A pragmatic interpretation approach:
Use fluorescence indicators to detect stress or photosystem imbalance before it shows up as yield loss.
Use spectrum measurements to verify that your commanded 660/730 schedule is what the plants actually received at canopy height.
Don’t use fluorescence as a substitute for control discipline. Pair it with ePPFD/eDLI logs and consistent environmental records.
Integration and compliance
Fixtures, drivers, and thermal/HVAC interplay
For commercial rooms, the “spectrum decision” becomes real only when it survives installation constraints: driver placement, wiring, heat rejection, cleaning routines, and uptime requirements.
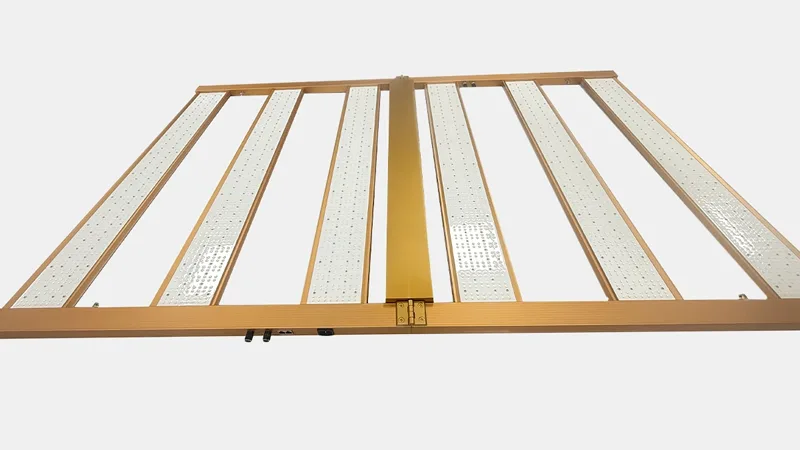
A practical two‑channel approach is to specify fixtures with independently controllable 660 nm and 730 nm channels, so you can separate:
photosynthesis-driven deep red output
signaling or balancing-driven far‑red output
As an example of how this can be implemented without turning into a lab project, SLTMAKS offers fixtures with 660/730 tunable channels and common commercial documentation expectations like ETL, CE, and RoHS markings (verify the exact listing scope for your model and jurisdiction during procurement).
Thermal planning is part of ROI.
If you run drivers on board, you’re adding heat to the room.
If you use remote-driver cooling (drivers placed outside the grow area or in managed spaces), you can reduce heat density at the canopy level and make service access more predictable.
The point isn’t that one architecture is always “better.” It’s that your far‑red strategy changes run hours and channel loading, which changes where heat shows up. Facilities and cultivation should review this together, not sequentially.
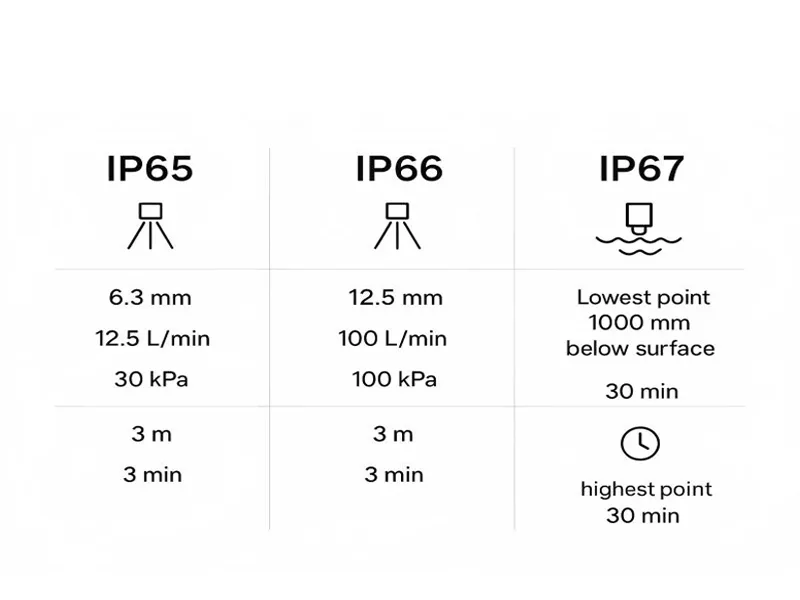
Electrical safety, IP ratings, and inspector readiness
If you operate in the US, compliance conversations often involve an AHJ (Authority Having Jurisdiction) and may reference an NRTL (Nationally Recognized Testing Laboratory) listing.
What to keep audit-ready:
fixture safety documentation (e.g., ETL listing details where applicable)
wiring diagrams and control schematics
driver locations and access plan
Ingress protection (IP) rating evidence for washdown/humidity conditions
maintenance and cleaning SOPs that match the rating claims
The practical goal: when you change spectra, you shouldn’t create new electrical risk or documentation ambiguity.
Compatibility with racking, power, and controls
Two common failure modes show up in multi-site rollouts:
Control incompatibility: the fixture channels are tunable in theory, but the installed control system can’t independently schedule them by zone.
Power density surprises: adding a new channel changes loading, breaker grouping assumptions, or driver thermal behavior.
Before standardizing a 660/730 recipe, verify compatibility end-to-end:
controls protocol per channel (0–10 V, DALI)
how many fixtures per control run without signal degradation
racking geometry and sensor placement plan
driver approach (constant current vs. constant voltage) and serviceability (especially if you’re mixing driver locations). SLTMAKS has a practical explainer on constant current vs. constant voltage drivers.
spare parts and driver serviceability
ROI and rollout
Modeling yield, quality, and energy use efficiency
A credible ROI model separates what you know from what you’re testing.
Known inputs typically include:
energy cost ($/kWh)
fixture electrical draw per channel at setpoints
HVAC penalty or benefit (depends on driver placement and room design)
labor and downtime costs for service access
Tested inputs should be treated as scenario variables:
If you need scientific justification for why far‑red can improve photosynthetic efficiency under mixed spectra (without claiming a guaranteed outcome), refer to the 2025 peer‑reviewed enhancement analysis cited earlier and treat your facility trial as the validation layer.
Payback scenarios and utility incentives
Incentives vary by utility territory and program rules, but two consistent points help operators:
Programs often care about efficacy, controllability, and qualified listings, not about specific spectral claims.
Having clean documentation and standardized measurement (including ePAR where relevant) reduces friction.
If you’re exploring rebates, it’s worth being familiar with the DesignLights Consortium (DLC) horticultural program ecosystem; start with DLC’s update on horticultural lighting technical requirements (2025) and then confirm current rules with your local program administrator.
A/B trials and multi‑site standardization
The fastest path to confidence is a controlled rollout.
Start with one room (or a subset of zones) where canopy uniformity is already strong.
Define “A” (baseline 660 recipe) and “B” (660 + defined 730 schedule).
Once you have a clear result, standardize in layers:
recipe templates per crop stage
controller profiles per zone type
commissioning checklist per site
This is where two-channel fixtures pay off: you can replicate settings precisely and still adapt to local room constraints.
FAQ
1) What is the Emerson enhancement effect in plant lighting?
It’s a photosynthesis “synergy” effect where red light (around 660 nm) and far‑red light (around 730 nm) delivered at the same time can increase photosynthetic performance more than you’d expect by adding the two effects separately. In practice, it’s most relevant when the spectrum better balances PSII and PSI excitation.
2) Is 730 nm far‑red included in PAR and PPFD measurements?
Usually no. Traditional PAR/PPFD metrics cover 400–700 nm, so 730 nm far‑red isn’t counted by a standard PAR meter. If you’re using far‑red, measure ePAR/ePPFD (400–750 nm) or log PAR plus a separate far‑red band so your recipe is measurable across rooms.
3) Will adding 730 nm far‑red make plants stretch?
It can, because far‑red is also a phytochrome signal that influences morphology (like internode length and leaf expansion). To reduce unwanted stretch, keep far‑red within stage-specific limits, verify R: FR / PSS targets, and consider tactics as lower continuous far‑red or end‑of‑day far‑red, depending on your goal.
Conclusion
660 nm + 730 nm is valuable when you treat it as a controlled system, not a marketing claim.
Deep red around 660 nm is a reliable photosynthesis driver. Far‑red around 730 nm can improve photosynthetic efficiency through photosystem balancing (the Emerson enhancement effect) and change morphology through phytochrome signaling. The operational win comes from separating those mechanisms so you can tune for output without losing control of plant architecture.
If you want a practical next step, build a one-room pilot with three deliverables:
a written 660/730 schedule (including any EOD‑FR window)
ePPFD/eDLI logging by zone
an inspector-ready documentation packet (fixture listings, wiring, IP rating, and driver placement)
To support the measurement side, you may also want to review SLTMAKS’s internal reference on ePAR (400–750 nm) reporting before you lock your trial design.