Engineer the perfect light spectrum for optimal plant growth. Boost your yields and cultivate year-round with our energy-efficient LED solutions. Tell us your needs for a customized lighting strategy and quote.
As the horticultural lighting industry evolves, ePAR grow lights are fundamentally changing how we evaluate fixture performance. For years, most grow-light evaluation workflows have treated “PAR” as the full story: count photons from 400–700 nm, compare PPFD maps, and move on. That approach was workable when most fixtures looked similar spectrally. It’s less defensible now that commercial LEDs routinely add meaningful far-red output—and far-red changes both plant response and how you should interpret a spec sheet.
For commercial indoor farms, this isn’t academic. The metric you standardize on affects:
Yield and morphology risk (canopy closure, internode stretch, flowering signals)
Energy and HVAC load (watts in, heat out, and what your crop actually uses)
Utility incentives and documentation (what you can prove in lab reports and files)
Compliance and inspections (what you can hand to a rebate administrator, AHJ, or QA team)
This article explains why ePAR (400–750 nm) is becoming the practical standard for evaluating grow lights, what changes in photon accounting, and how to operationalize ePAR in procurement and at-canopy validation.
Table of Contents
PAR vs. ePAR
What changes in photon accounting
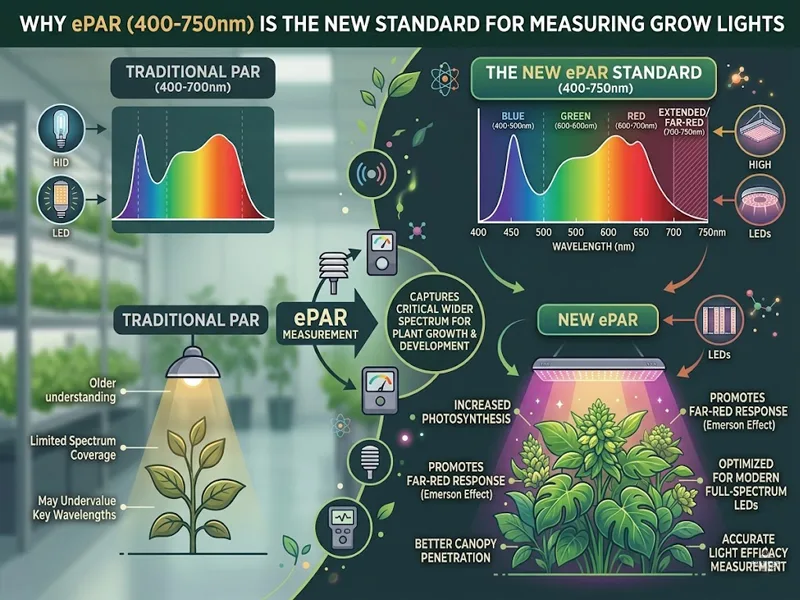
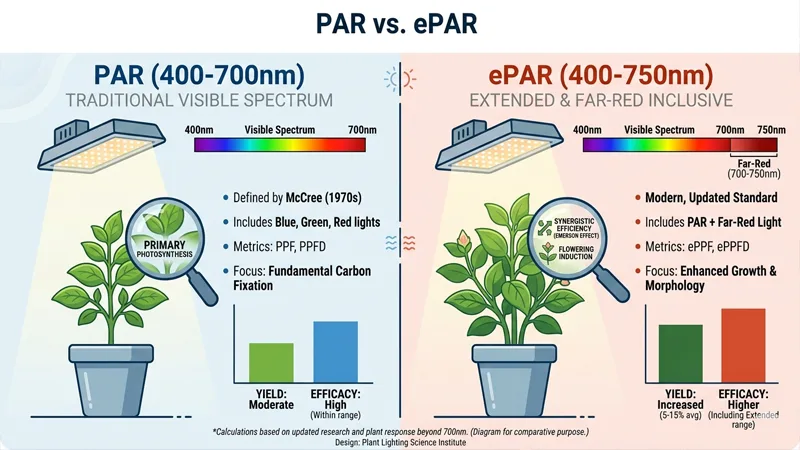
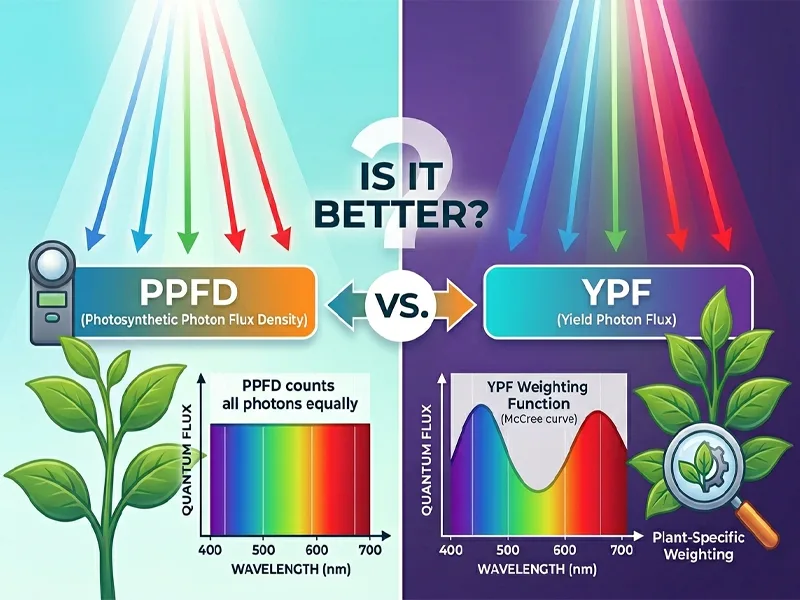
Think of lighting metrics as photon accounting: you’re deciding what “counts” as photosynthetically useful. Traditional PAR counts photons from 400–700 nm. ePAR (extended PAR) counts photons from 400–750 nm, adding the far-red band from 700–750 nm.
That single boundary change matters because many fixtures that look similar on PAR-only metrics can diverge once far-red is included:
A fixture with meaningful 700–750 nm output may have higher total photosynthetic photon delivery than its PAR-only PPF suggests.
Two fixtures with the same PPFD map can drive different canopy behavior if their far-red fractions differ.
If you’re comparing fixtures for a retrofit or a multi-site standard, a PAR-only comparison can undercount (or misinterpret) how a spectrum performs in production.
For a quick refresher on baseline PAR concepts and how PPFD is typically used, see SLTMAKS’ overview of photosynthetically active radiation.
Why include 700–750 nm now
Far-red photons were historically excluded from PAR because, in isolation, they have low photosynthetic activity. The update in thinking is not “far-red is a replacement for PAR.” It’s that far-red light changes the efficiency of photosynthesis when delivered alongside PAR photons.
In practical terms: modern LED fixtures can deliver controllable far-red in a way legacy technologies often could not, and researchers have clarified where far-red adds value (and where it doesn’t).
Emerson effect and real-world context
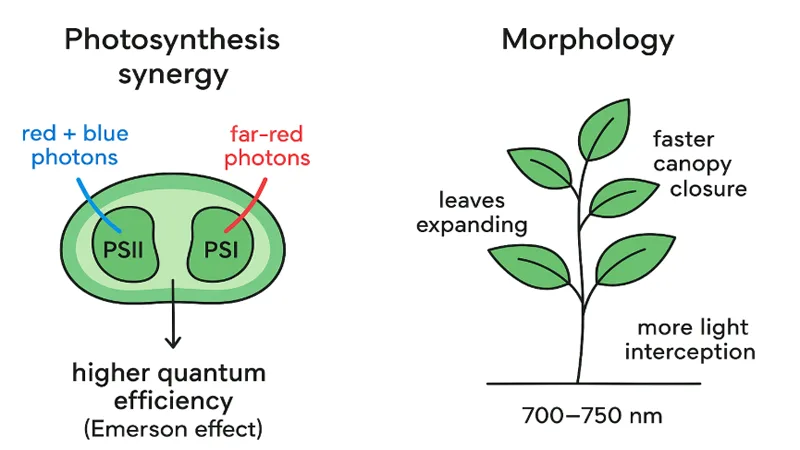
The “Emerson enhancement effect” is the classic explanation for why far-red matters in mixed spectra. Photosynthesis runs through two interacting systems (PSI and PSII). Far-red photons preferentially excite PSI, while shorter wavelengths drive PSII. When both are adequately stimulated, the combined system can operate more efficiently than when one side is bottlenecked.
The important real-world context for operators is this:
Far-red is not a free lunch. It can improve photosynthetic efficiency in combination with PAR, but it can also shift morphology.
Crop, stage, and environment matter. What’s helpful in one recipe (e.g., early vegetative canopy closure) can be a liability in another (e.g., excessive elongation under certain conditions).
That’s why ePAR is best treated as a measurement standard (what you count and report) paired with a control strategy (how you deploy far-red intentionally).
Scientific evidence
Photosynthesis synergizes with far-red
The strongest reason ePAR is replacing PAR-only thinking is that the 700–750 nm band can contribute to photosynthesis when paired with 400–700 nm photons.
In their 2021 review, Zhen, van Iersel, and Bugbee synthesize evidence that far-red photons can drive meaningful photosynthetic activity in mixed spectra and argue that the 400–700 nm boundary is no longer a good proxy for “photosynthetically useful photons” in horticultural lighting evaluation.
Operationally, the takeaway isn’t that every recipe should maximize far-red. It’s that if your fixtures emit far-red, your metrics should count it—otherwise you’re comparing apples to oranges.
Morphology, canopy closure, yield
Far-red does more than affect the instantaneous photosynthetic rate. It also influences plant structure—especially leaf expansion and canopy architecture—by interacting with phytochrome signaling and shade-response pathways.
That has two procurement-relevant implications:
The same ePAR total can behave differently depending on the spectral ratio. If far-red is a larger share of photons, you may see faster canopy closure (more light interception) and a greater risk of elongation depending on crop and strategy.
Fixture evaluation needs to consider both photons and outcomes. A spec sheet that looks “efficient” can still drive unwanted morphology if far-red is poorly controlled.
Practical ranges and caveats
Far-red benefits are often discussed within bounded practical ranges rather than as a “more is better” lever. The 2021 review emphasizes that the effectiveness of far-red depends on how much is delivered relative to the rest of the spectrum and warns against oversimplified efficacy comparisons.
⚠️ Warning: If you adopt ePAR in procurement but ignore far-red fraction and controllability, you can accidentally standardize a spectrum that creates downstream crop-management costs (training labor, canopy management, tighter environmental control).
Metrics and Measurement for ePAR Grow Lights
Defining ePPF, ePPFD, ePPE
Once you accept ePAR as the counted band (400–750 nm), the related metrics follow the same logic you already use for PAR:
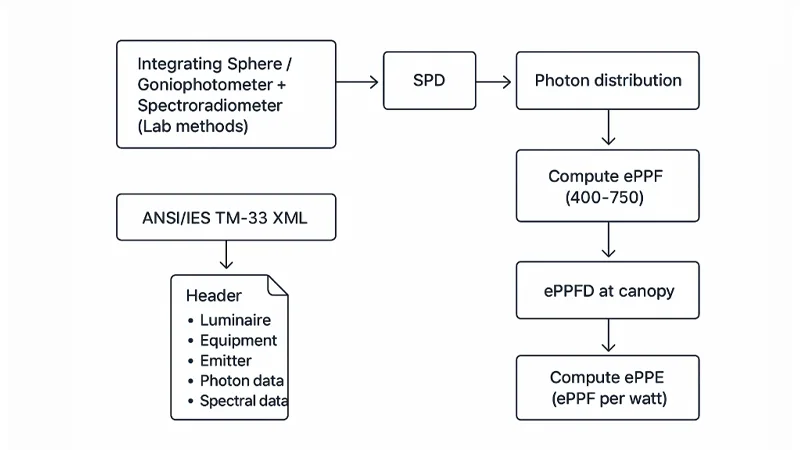
ePPF (extended photosynthetic photon flux): total photons emitted per second in 400–750 nm (µmol/s).
ePPFD (extended photosynthetic photon flux density): photons arriving at a surface (e.g., canopy plane) in 400–750 nm (µmol/m²/s).
ePPE (extended photosynthetic photon efficacy): ePPF per input watt (µmol/J).
These aren’t “new” concepts so much as the same measurement language applied to a band that matches modern understanding of plant response.
A key measurement discipline point: do not compare ePPE from one vendor to PPE from another unless you confirm they are counting the same wavelength range.
Spectral ratios and reporting
If you’re using ePAR for evaluation, you want more than a single number. You also want enough spectral reporting to understand the far-red fraction and how it’s controlled.
At minimum, ask vendors for:
A spectral distribution (SPD) or spectral quantum distribution that shows where photons are emitted
Declared wavelength band boundaries used for photon metrics (400–700 vs 400–750)
Any reported spectral ratios relevant to your crop strategy (e.g., red: blue, red:far-red), stated clearly and consistently
This is especially important for facilities standardizing recipes across multiple rooms or sites. Without consistent spectral reporting, you can’t reliably replicate outcomes.
Files, labs, and TM-33 data
For commercial procurement, the operational goal is not “understand spectrum in theory.” It’s “collect files that survive scrutiny.” That means lab context and machine-readable data—not just a marketing PDF.
A common industry practice is to request standardized data files (often XML) that package intensity distributions and spectral data. The DesignLights Consortium (DLC) describes TM-33 documents as structured XML with elements such as Version, Header, Luminaire, Equipment, Emitter, and Custom Data in its horticultural lighting FAQ: DLC Horticultural Lighting FAQs (TM-33 document structure).
Two pragmatic notes for operators:
Program requirements can lag metric evolution. Even if you evaluate with ePAR internally, rebate or qualification submissions may still require specific PAR-based fields depending on program rules.
Treat TM-33 as an audit artifact. It’s not just for “passing a program.” It helps your team compare fixtures consistently and archive what was actually tested.
Standards and incentives
DLC status and utility programs
Utility programs and incentive administrators need a way to screen fixtures at scale. That’s why third-party qualification frameworks (like DLC horticultural lighting) matter: they create a minimum bar for performance documentation and safety assurance.
The practical implication for ePAR adoption is this: as soon as far-red becomes a normal part of commercial spectra, programs and inspectors need consistent documentation that describes what a fixture actually emits, not just the watts on a label.
If your facility depends on rebates, build your spec to require the files your local program expects and the spectral information your cultivation team needs to manage far-red intentionally.
ASABE/CIE/IES guidance
In practice, the standards ecosystem around horticultural lighting spans:
Plant-science evidence for what wavelengths contribute to photosynthesis and morphology
Lighting engineering standards for how optical and spectral data are measured and transferred
Program guidance for what documentation is required to qualify products
The key operational move is to align your internal metrics (ePAR/ePPF/ePPE) with whatever external documentation your program or AHJ recognizes, then keep a clean audit trail.
Documentation and inspections
Inspection and compliance workflows are where bad documentation turns into real cost.
A documentation-first procurement package typically includes:
Safety certifications appropriate for your jurisdiction and installation context
Lab-reported optical data and spectral reporting (not just a brochure)
File formats that let your engineering team compare fixtures consistently over time
For a vendor example of publicly stated certification readiness, SLTMAKS notes on its About page that its product line includes ETL, CE, and RoHS certifications: SLTMAKS.
Deployment workflow
Spec sheets and layouts
Once you move to ePAR, update your spec sheet template so every vendor quote is comparable. In practice, that means:
Request both PAR (400–700) and ePAR (400–750) photon metrics if you’re transitioning (so you can compare to legacy baselines)
Require a clear statement of measurement method and reported wavelength boundaries
Treat far-red as a design variable: plan spacing, mounting height, and room zoning to support your target at-canopy distribution
The objective is to reduce “spec drift” across sites, where different rooms end up with different far-red fractions because each team sourced differently.
Controls and recipes
Far-red creates value when it’s controllable—especially across growth stages. If far-red is fixed and undocumented, it becomes harder to standardize outcomes.
In a recipe-driven facility, a practical control-minded checklist looks like:
Can you independently control far-red channels (700–750 nm) versus treating them as a fixed byproduct?
Can the vendor provide machine-readable optical files (for example, TM-33 XML, where applicable) so your team can store what was actually measured?
Do fixture documents clearly state certification status required for your sites (e.g., ETL/CE/RoHS) and any constraints that matter for inspection?
As a non-promotional example of how vendors describe far-red in recipe language, SLTMAKS’ guide to custom light recipes explicitly discusses far-red and references the Emerson effect, alongside programmable recipe concepts.
HVAC and at-canopy validation
Any change in spectrum and photon totals should be validated where it matters: at the canopy, in your microclimate.
A practical validation loop includes:
Measure at-canopy distribution using appropriate sensors and a consistent grid
Confirm you’re reading the band you think you’re reading (PAR sensor vs ePAR-capable sensor)
Watch second-order effects: canopy temperature, transpiration, and dehumidification load
This is where ROI/TCO becomes real. A “more efficient” lighting spec that increases HVAC complexity can lose on total system cost—even if the lighting-only metric looks great.
Conclusion
Moving from PAR to ePAR (400–750 nm) is less about chasing a new acronym and more about using a measurement standard that matches what modern fixtures emit and what plants actually respond to.
For commercial indoor farms, the practical takeaways are straightforward:
Count what matters: if fixtures emit far-red, evaluate photons in 400–750 nm—not only 400–700.
Separate metrics from control: ePAR helps you compare and document; controllability helps you deploy far-red without unintended morphology costs.
Treat documentation as part of performance: spectral data, lab context, and file formats (like TM-33 where required) reduce procurement risk and make rebates/inspections smoother.
Next steps to future-proof your specifications:
Update your procurement template to request PAR and ePAR metrics, plus a clear statement of wavelength boundaries.
Require spectral reporting (not just a single efficacy number) so cultivation can manage far-red fraction intentionally.
Standardize your file package (lab report + machine-readable optical data), so multi-site comparisons stay apples-to-apples.
FAQ
What is the difference between PAR and ePAR?
PAR (Photosynthetically Active Radiation) traditionally measures photons within the 400–700 nm range. ePAR (extended PAR) expands this measurement to include the 400–750 nm range. The primary difference is the inclusion of the far-red band (700–750 nm), which modern research identifies as a significant contributor to photosynthesis.
Why is far-red light (700–750 nm) now included in the measurement?
Historically, far-red photons were excluded because they have low photosynthetic activity when used alone. However, science now confirms the Emerson Enhancement Effect: when far-red light is delivered alongside shorter wavelengths (PAR), it improves the overall efficiency of the plant’s photosynthetic systems. Including it provides a more accurate representation of a fixture’s actual performance.
How does ePAR impact plant growth and morphology?
Beyond boosting photosynthetic efficiency, ePAR (specifically the far-red fraction) influences plant structure. It affects canopy closure, leaf expansion, and internode stretch. While it can speed up growth and flowering, improper levels may lead to unwanted “stretching” or elongation, making it a critical factor for cultivation teams to manage intentionally.
What are the new metrics associated with ePAR?
As the industry shifts to ePAR, the standard metrics are updated to reflect the 400–750 nm range: ePPF: Total photons emitted per second (µmol/s). ePPFD: Photons arriving at the plant canopy (µmol/m²/s). ePPE: Extended photon efficacy (µmol/J), measuring how many photons are produced per watt of electricity.
Why is ePAR important for commercial procurement and rebates?
Standardizing on ePAR prevents “apples-to-oranges” comparisons. A fixture might look more efficient simply because it includes far-red light in its total count; without ePAR standards, buyers might misinterpret performance data. Furthermore, many utility incentive programs and organizations like the DLC now require standardized data (such as TM-33 XML files) that include these extended spectral details for rebate qualification.
Does adopting ePAR change facility operations, such as HVAC?
Yes. ePAR isn’t just about light; it also affects the room’s total energy balance. Changes in the spectrum can influence canopy temperature and transpiration rates. When evaluating new ePAR-standard fixtures, operators should validate at-canopy distribution and monitor secondary effects on dehumidification and cooling loads to ensure the total system ROI remains positive.