Introduction
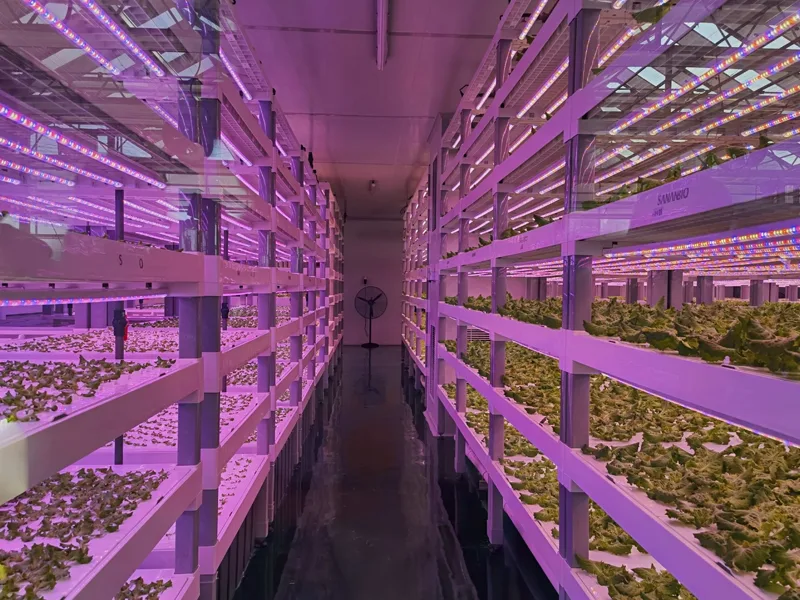
Foxtailing is one of those issues that looks like a genetics problem—until you map your room and realize you’re running a “mountain peak” of PPFD over the top colas. This is the typical pattern behind cannabis foxtailing under LED lights in sealed, high-intensity rooms: localized photon and heat stress that the plant expresses as elongated bud growth.
In sealed rooms with high-intensity LED lights, that’s a common failure mode: high photon density plus microclimate drift (canopy temperature, VPD, and CO₂ availability) can push plants into stress-driven morphology changes.
This guide is written for operators who are already past the basics and want an SOP-friendly way to keep yields stable, buds uniform, and risk controllable—without gambling on guesswork. It’s safety-first by design: the goal isn’t to chase maximum PPFD; it’s to keep the room inside predictable operating bands and prove it with measurements.
What you’ll use:
- PPFD (photosynthetic photon flux density) targets and DLI (daily light integral) limits by stage
- VPD (vapor pressure deficit) bands and CO₂ ranges that match your intensity
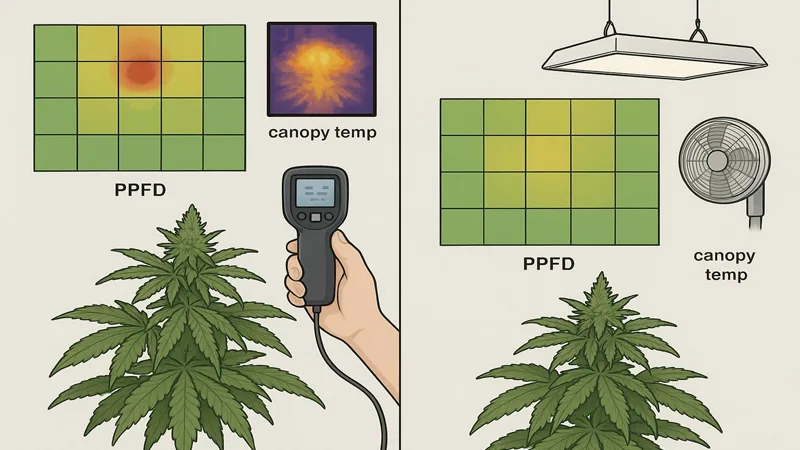
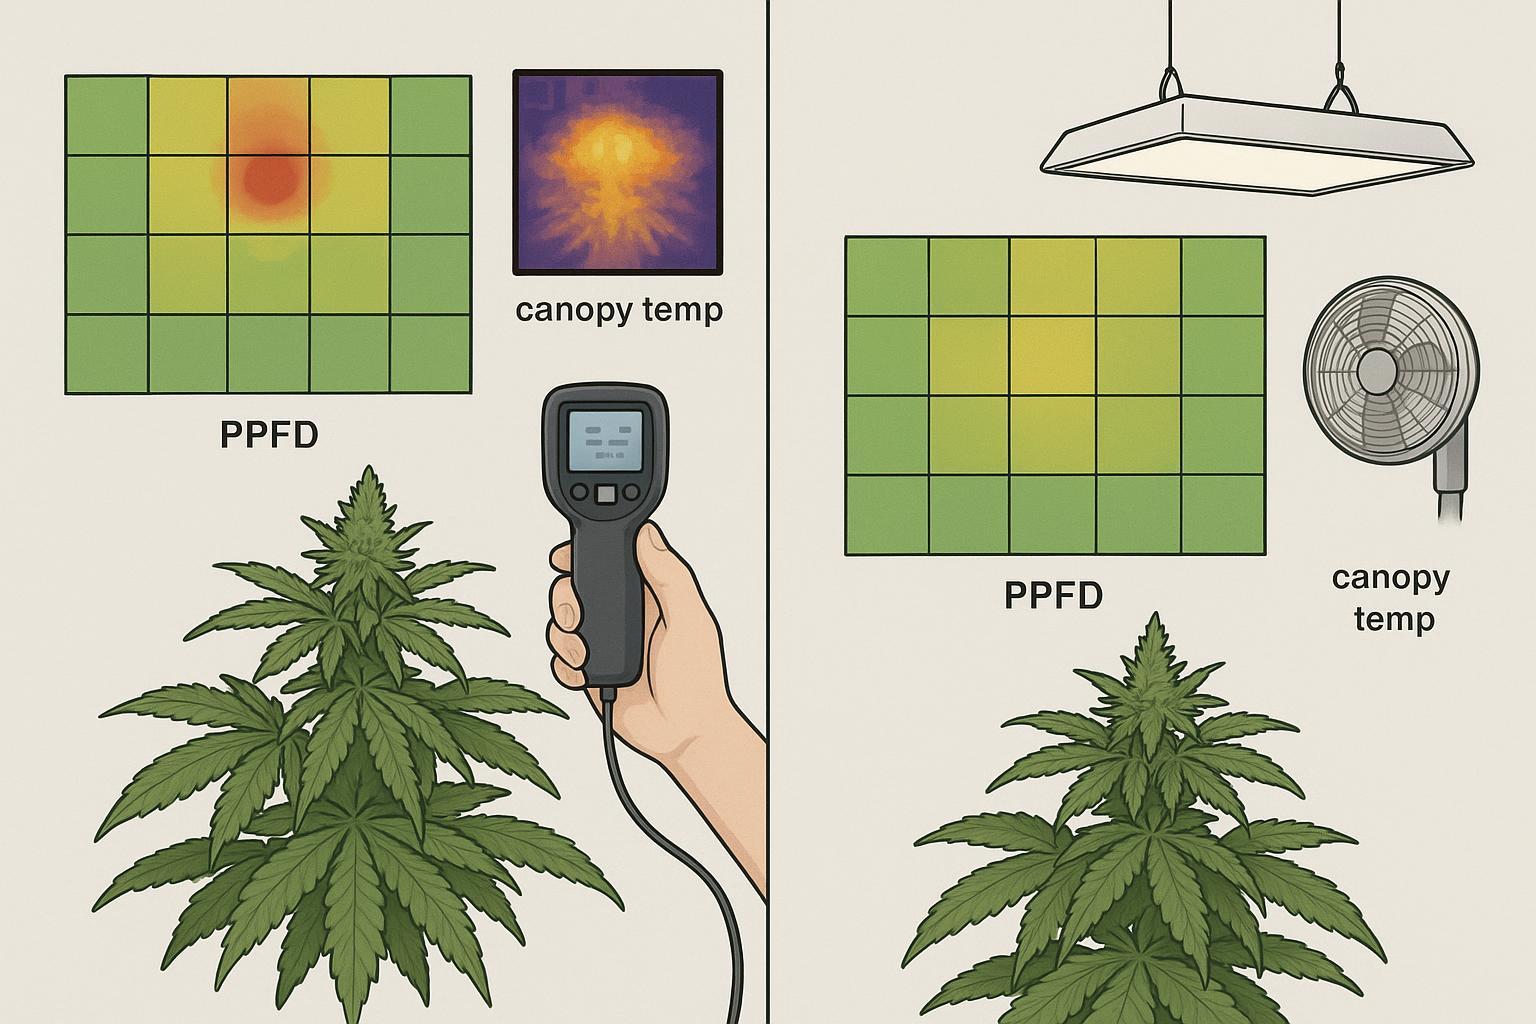
- Canopy mapping (PPFD grids + leaf/canopy temperature checks) to find hotspots before they turn into foxtails
- Response playbooks that prioritize reversible changes in the first 24–48 hours
⚠️ Warning: All numeric ranges below are typical starting points, not universal “correct” values. Cultivar response, canopy architecture, and your HVAC/CO₂ capability determine what’s safe. Use sensors to confirm, then tune in small steps.
Table of Contents
Diagnose foxtailing types (cannabis foxtailing under LED lights)
Visual cues and location
Not all foxtailing is the same. Your first job is to classify what you’re seeing before you touch setpoints.
Pattern A: “Top-only” foxtailing (hotspot-driven)
- Most pronounced at the highest colas and directly under fixture centers
- Often paired with slight bleaching/paling at the bud tops, tacoing, or crisped sugar leaves
- Usually worse in the same physical locations, run after run
Pattern B: “Room-wide” foxtailing (environment-driven)
- Shows up across the canopy, not just under centers
- Often correlates with heat events, RH swings, or CO₂ interruptions
- May present alongside reduced turgor, increased transpiration stress, or inconsistent ripening
Pattern C: Genetic foxtailing (cultivar expression)
- More uniform across plant positions
- Often appears late in flower, even when the environment is stable
- Can still be amplified by hotspots (genetics sets the baseline; stress turns it into a problem)
If the foxtails are mostly at the tops and directly under fixture centers, assume a light/heat hotspot until mapping proves otherwise. Multiple cultivation sources describe foxtailing as commonly triggered by environmental stress (light intensity/proximity and heat) in addition to genetics, including in high-intensity indoor setups (see Grow Sensor’s foxtailing overview and Humboldt Seed Company’s troubleshooting guidance).
Data-driven confirmation (PPFD, LST, VPD, CO2)
Visual inspection is not enough for decision-stage operations. Confirm with a short, repeatable measurement set:
- PPFD grid at canopy height
- Measure at the canopy level, not the floor.
- Use a fixed grid spacing and document it (e.g., 30–50 cm / 12–20 in).
- Record average, minimum, maximum, and the min/avg uniformity ratio.
- Leaf/canopy surface temperature (LST) at hotspots
- Use an IR thermometer or thermal camera.
- Compare suspected hotspot tops vs “healthy reference” tops in the same room.
- VPD at canopy level
- Use canopy-height temperature/RH sensors.
- Remember: leaves can run cooler than air due to transpiration, so what the plant experiences can differ from “room VPD.” Pulse Grow’s VPD guide explains why leaf temperature matters for interpreting transpiration demand.
- CO₂ availability during lights-on
- Log CO₂ at canopy level and verify distribution (not just a single wall sensor).
- Look for drops tied to injection cycle issues, leak events, or poor mixing.
Triggers and verification loop
Treat this like incident triage:
Trigger: You see foxtailing increasing over 24–72 hours.
Verification loop (repeat every lights-on day for 2–3 days):
- Map PPFD and identify hotspots.
- Confirm hotspot LST is elevated vs references.
- Check if VPD drifted upward during peak lights-on (often from canopy temp rise or RH drop).
- Check if CO₂ is stable and uniform during the same window.
- Make one controlled change (dimming, height, airflow, setpoint) and re-measure.
If you change three variables at once, you’ll never know what fixed it—and you’ll struggle to scale the solution across rooms.
Set Safe Environments for High-Intensity LED Lights
If you’re trying to prevent foxtailing cannabis in high-intensity rooms, treat “light” and “climate” as one coupled system. Your SOP should define the acceptable combinations, not standalone targets.
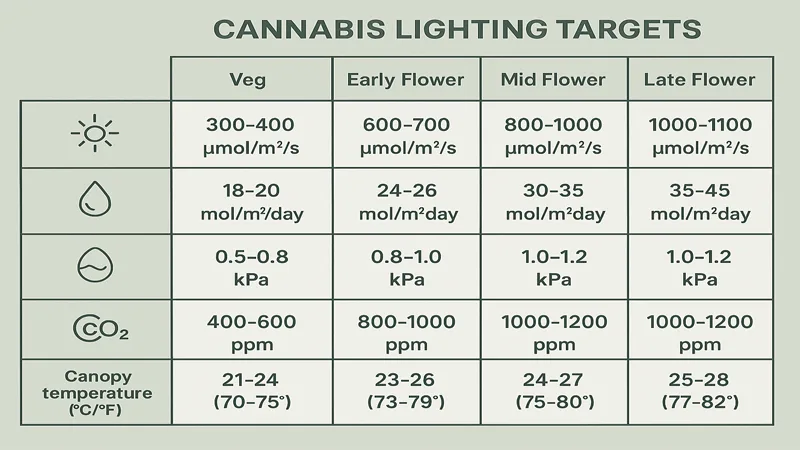
PPFD/DLI bands by stage
PPFD is the “instant” number; DLI is what the crop integrates across the photoperiod. Both matter.
Typical starting ranges used in indoor cannabis lighting references:
- Vegetative: roughly 250–600 μmol/m²/s PPFD and ~20–40 mol/m²/day DLI, depending on photoperiod and cultivar.
- Flower (photoperiod): commonly ~600–900+ μmol/m²/s PPFD with ~30–45 mol/m²/day DLI as a practical band in many facilities.
Grow Light Meter’s guide on Grow Light Meter’s “lighting requirements of cannabis over the full grow cycle.”
provides a useful stage-based framing for DLI and how it relates to PPFD and photoperiod. California Lightworks also explains the PPFD↔DLI relationship in California Lightworks’ “Understanding DLI…”
.
Two operating notes that prevent stress foxtailing:
- If you can’t hold the climate stable, cap the PPFD. High PPFD without matching HVAC and dehumidification capacity tends to turn into canopy temperature drift and VPD spikes.
- If you’re pushing PPFD above typical “no-CO₂” levels, treat CO₂ as a requirement, not an upgrade. At higher light levels, CO₂ becomes limiting faster, and stress responses show up sooner.
VPD/CO2/temperature linkage
High-intensity LEDs don’t just add photons; they change the room’s thermodynamics. In sealed rooms, small errors accumulate: a few degrees at the canopy can move VPD enough to shift stomatal behavior.
Practical VPD ranges vary by stage, but most VPD guidance converges on:
- Vegetative: approximately 0.8–1.2 kPa
- Flower: approximately 1.0–1.6 kPa, often tighter in late flower to manage mold risk
For calculation and interpretation, Pulse Grow’s guide is in Pulse Grow’s “Ultimate VPD Guide.”
and Dimlux’s VPD guide in Dimlux’s “Vapor Pressure Deficit — the ultimate guide.”
These are useful references for how temperature and RH interact and why a leaf-to-air temperature offset can change what the plant “feels.”
CO₂ considerations (decision-stage reality):
When teams talk about dialing in VPD CO2 PPFD cannabis together, they’re really talking about one thing: keeping stomata operating in a stable band so high PPFD doesn’t turn into stress.
- If you run enriched CO₂, verify distribution across the canopy. A stable room average doesn’t guarantee stable canopy availability.
- If CO₂ enrichment is interrupted or uneven, your “safe” PPFD may no longer be safe—because the plant can’t process the incoming photons efficiently.
Spectrum and far-red control
Spectrum is often discussed like a “recipe,” but for foxtailing prevention, your priority is simpler: avoid spectrum-driven stress and unwanted stretch when you’re already operating near the edge.
Photobleaching is a related symptom that often co-occurs with top-only foxtailing under hotspots (often discussed as photobleaching cannabis LED stress in cultivation lighting resources). Fluence’s “Understanding photobleaching in cannabis” (2023) describes photobleaching as largely induced by applying too much of the wrong light during flower (see Fluence’s “Understanding photobleaching in cannabis” (2023)
Operational guidance:
- If you’re seeing whitening/paling at the tops, treat it as a hotspot + spectrum/intensity interaction problem first.
- Keep far-red strategies conservative unless you can verify outcomes with mapping and morphology tracking. Far-red can be useful in controlled contexts, but it can also amplify stretch and unevenness when hotspots exist.
Distance, dimming, uniformity
Hang height and dimming curves
Distance and dimming are not interchangeable controls.
- Dimming reduces PPFD everywhere, but doesn’t always fix distribution. If your map looks like a peak, dimming just lowers the peak and the edges together.
- Height changes can improve distribution (more overlap), but may reduce peak PPFD and increase spill. The right move depends on whether your issue is “too much everywhere” or “too much in a few places.”
SOP approach:
- Decide your target PPFD/DLI band for the stage.
- Use dimming to get the average in range.
- Use height/layout/overlap and airflow to bring the max down and the min up.
PPFD mapping and uniformity
For a practical search phrase many teams use, this is essentially PPFD mapping cannabis canopy work: a repeatable grid, measured at canopy height, logged the same way every time, so hotspot risk becomes visible before flower structure changes.
If you’re standardizing across rooms, PPFD mapping is the most cost-effective way to prevent stress foxtailing—because it converts “this cultivar foxtails” into “this location runs 20% hotter at the top.”
A practical PPFD mapping workflow:
- Set a repeatable grid (spacing, height, and sensor orientation) and document it.
- Measure at canopy height with lights at normal operating settings.
- Record average/min/max and calculate min/avg.
- Mark the physical causes of anomalies: fixture centers, ducting shadows, wall reflections, or dead airflow zones.
- Re-map after any layout or setpoint change.
As a neutral example, SLTMAKS has published a straightforward walkthrough of canopy-level mapping and hang-height thinking in its guide on SLTMAKS’ PPFD mapping and hang-height workflow
. For teams building procurement specs, SLTMAKS also notes why PPFD maps for uniformity and efficiency
are “buyer-protective” documents: you can see edges, corners, and hotspots rather than relying on a single center-point number.
Thermal management case note (non-promotional, ops-relevant): In high-intensity sealed rooms, a fixture’s ability to shed heat consistently affects driver temperatures, diode junction behavior, and the stability of canopy conditions. Even if two fixtures hit the same average PPFD, the one that runs hotter can force higher HVAC load or cause localized canopy temperature rise—both of which raise foxtailing risk.
Airflow and hotspot management
Airflow is how you prevent “invisible hotspots” from surviving long enough to become a morphology problem.
Practical controls:
- Aim airflow to break the boundary layer at the top colas without wind-burn.
- Identify zones where leaves are still and warm (often under fixture centers or in corners).
- Balance supply/return so you don’t create a CO₂-rich “strip” and a CO₂-poor “strip.”
When a hotspot is confirmed:
- Lower the peak PPFD (dimming or height)
- Improve overlap (layout/spacing)
- Add targeted air movement across the top layer
- Re-check canopy temperature and VPD during peak lights-on
Field operations and incident response
24–48 h response when foxtailing appears
The goal in the first 48 hours is risk reduction without overcorrecting.
- Confirm it’s not genetic-only
- If it’s top-only and location-specific, treat it as an environmental hotspot.
- Reduce peak stress first (not necessarily average intensity)
- Lower maximum PPFD at the top colas via dimming or height adjustment.
- If you can’t change height quickly, dim and compensate later with distribution fixes.
- Stabilize canopy temperature and VPD during peak lights-on
- If canopy temperature is creeping up, address HVAC/dehumidification and airflow.
- Use VPD bands as guardrails; Pulse Grow and Dimlux provide practical reference ranges.
- Verify CO₂ stability and mixing
- If CO₂ isn’t stable, do not run “high PPFD assumptions.” Bring PPFD down until CO₂ control is reliable.
- Re-map and log
- Measure the same grid points again on the next lights-on day.
- Document changes as a controlled experiment: one change → one verification.
Daily/weekly rounds and logging
Decision-stage operations need log discipline. A lightweight routine prevents repeat incidents:
Daily (lights-on peak window):
- Spot-check 5–10 canopy points for PPFD (rotate locations across the week)
- Spot-check canopy temperature at the hottest-looking tops
- Record VPD and CO₂ at the canopy level and confirm no drift alarms
Weekly:
- Full PPFD map for at least one representative room (rotate rooms)
- Trend review: max PPFD, min/avg uniformity, canopy temperature deltas, VPD excursions, CO₂ variability
If you need a simple DLI sanity check, SLTMAKS’s explanation of SLTMAKS’s DLI-to-PPFD conversion is a practical refresher for teams standardizing targets across different photoperiods.
Photoperiod integrity checks
In sealed rooms, photoperiod errors can look like “mysterious morphology.” Protect the basics:
- Verify timers/controls are not drifting
- Confirm no light leaks during dark cycle
- Confirm emergency/indicator lights aren’t bleeding into the room
- Audit controller logs after power events
Scaling across rooms
Central control and alert thresholds
Scaling is mostly about catching drift before it becomes crop expression.
Set alert thresholds tied to foxtailing risk:
- Max PPFD at canopy (hotspot threshold)
- Min/avg uniformity (distribution threshold)
- Canopy temperature delta (hotspot confirmation)
- VPD excursions during peak lights-on
- CO₂ deviation (absolute value and spatial variability, if you can measure it)
The key is consistency: the same thresholds, the same measurement method, and the same response playbook.
Audits and trial design for cultivars
Even without cultivar-specific constraints, treat intensity changes like trials:
- Pick a representative room and run one variable change at a time.
- Define “done when” criteria (e.g., hotspot reduced by X%, canopy temp delta reduced, foxtail progression stops).
- Keep a control zone or room when possible.
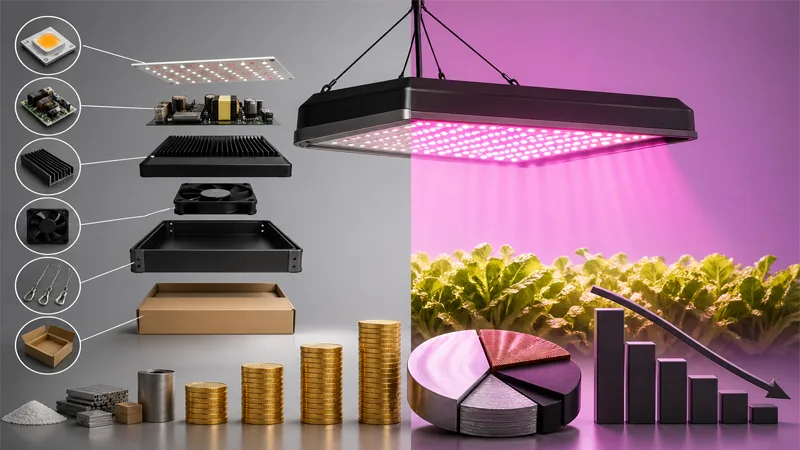
ROI and energy trade-offs
Operators often try to “win” by pushing intensity. The better ROI question is:
Does higher PPFD increase sellable yield and uniformity after you account for HVAC, dehumidification, and risk?
Common decision-stage realities:
- A slightly lower PPFD with higher uniformity can reduce rework, improve batch consistency, and reduce incident-driven downtime.
- If higher intensity forces a higher HVAC load and increases morphology risk, the TCO curve can flatten fast.
Compliance and safety
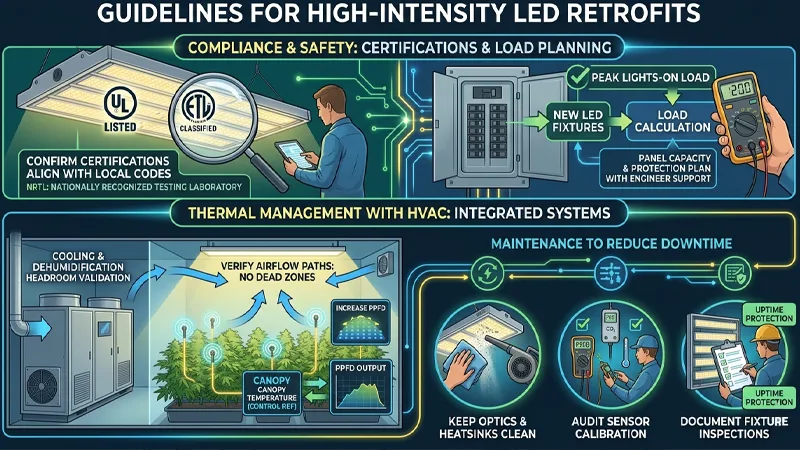
Certifications and electrical load planning
High-intensity LED retrofits change electrical loading and heat rejection. Build safety into the plan:
- Confirm fixture and system certifications align with your jurisdiction and inspection requirements.
- Define acronyms in SOPs and procurement docs (e.g., NRTL = Nationally Recognized Testing Laboratory; UL/ETL are common certification marks).
- Plan panel capacity, circuiting, and protection with qualified electrical engineering support.
Thermal management with HVAC
Treat lighting and HVAC as one system:
- If you increase PPFD, validate HVAC/dehumidification headroom at peak lights-on.
- Use canopy temperature (not just room temperature) as a control reference.
- Verify airflow paths don’t create dead zones at the canopy top.
Maintenance to reduce downtime
Stress events often follow maintenance drift:
- Keep optics and heatsinks clean to prevent unintended output changes and localized heating.
- Audit sensor calibration (PPFD meters, temp/RH probes, CO₂ sensors).
- Document fixture inspections as part of uptime protection.
Conclusion
Foxtailing prevention under high-intensity LEDs is mostly about standardization: define operating thresholds, verify them with sensors, then tune in small steps per cultivar and room.
Preventive PPFD mapping and airflow control beat reactive fixes every time because they stop hotspots from becoming biology. Use the verification loop: map → confirm canopy temperature/VPD/CO₂ → make one controlled change → re-measure.
Next step for teams standardizing across sites: document your thresholds (PPFD max, uniformity min/avg, VPD bands, CO₂ stability limits), review trend data monthly, and update SOPs quarterly so improvements don’t get lost between harvests.
FAQ
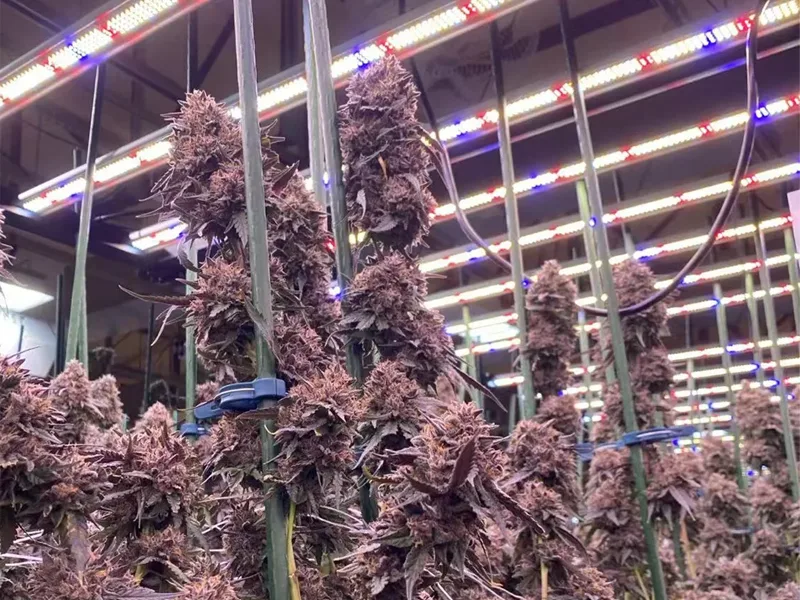
Why do high-intensity LED lights cause cannabis foxtailing?
In sealed rooms, foxtailing is typically caused by a combination of localized photon stress and microclimate drift. When PPFD (Photosynthetic Photon Flux Density) is pushed to “mountain peak” levels without matching environmental controls, the plant experiences heat and light stress, resulting in elongated, irregular bud growth as a stress-driven morphology change.
How can I distinguish between genetic foxtailing and environment-induced foxtailing?
You can classify the issue by observing the distribution pattern:
Top-only (Hotspot-driven): Most pronounced at the highest colas directly under fixture centers; often paired with bleaching or “tacoing” leaves.
Room-wide (Environment-driven): Occurs across the entire canopy; usually correlates with heat spikes, humidity swings, or CO₂ interruptions.
Genetic: More uniform across all plant positions and often appears late in flower even when the environment is stable.
What should my immediate “Response Playbook” be if foxtailing is detected?
The goal in the first 24–48 hours is risk reduction without overcorrection:
Lower Peak Stress: Dim the lights or increase hang height to reduce PPFD at the affected hotspots.
Stabilize VPD: Ensure the Vapor Pressure Deficit is within the safe band (typically 1.0–1.6 kPa for flower) to keep stomata functioning.
Verify CO₂: Confirm that CO₂ is stable and properly mixed across the canopy.
One Change at a Time: Make a single controlled adjustment and re-measure to avoid guesswork.
How do PPFD, VPD, and CO₂ interact in preventing stress?
These elements act as a coupled system. At higher light intensities (high PPFD), CO₂ becomes a limiting factor; if CO₂ is low or uneven, the plant cannot process the light efficiently, leading to stress. Similarly, high-intensity LEDs increase canopy temperature, which shifts the VPD. If the VPD spikes too high, the plant struggles with transpiration, triggering the stress responses that lead to foxtailing.
What is the most effective data-driven tool to prevent foxtailing before it starts?
PPFD Canopy Mapping is the most effective preventive measure. By establishing a repeatable measurement grid at the canopy level, operators can identify hotspots (where PPFD and leaf temperature are highest) before they cause morphological damage. This converts a “mystery” growth issue into a measurable metric—allowing you to adjust light uniformity and airflow patterns proactively.