Introduction
In a multi-tier setup, deploying the right strawberry vertical farming lights determines yield per kWh, uniformity of ripening, and the fruit quality that moves a pack line from commodity to premium. Get the intensity, spectrum, layout, and thermal integration right, and the facility scales predictably. Miss one of them and the cost shows up as uneven harvests, wasted energy, and HVAC load never captured on a spec sheet.
This guide covers the decisions that matter for a commercial grower: PPFD and DLI math with stage-specific targets, a practical spectrum and photoperiod strategy, layout and beam-overlap principles for uniform canopies, HVAC and driver-placement guidance, a fixture reliability and compliance checklist, and an ROI model you can apply to your own numbers. It builds on SLTMAKS’ vertical farming LED lighting guide, which lays out the same intensity, uniformity, and HVAC disciplines for racked production. Each section ends with the engineering heuristics and commissioning checkpoints a site manager can put to use.
PPFD & DLI Targets
Photosynthetic Photon Flux Density (PPFD, µmol·m⁻²·s⁻¹) is the instantaneous intensity the canopy sees; Daily Light Integral (DLI, mol·m⁻²·day⁻¹) is the total photon dose across a photoperiod. For strawberry vertical farming, design for DLI first, then derive the PPFD and run hours that deliver it.
Production PPFD and DLI
The controlled-environment berry literature is consistent on dose. Ohio State University’s Controlled Environment Berry Production guidance puts 12 mol·m⁻²·day⁻¹ DLI as the minimum for acceptable productivity, 20–25 mol·m⁻²·day⁻¹ as the optimum for flowering and fruiting, and notes plants stress above roughly 30 mol·m⁻²·day⁻¹ without shading. In PPFD terms, that lands near 300–450 µmol·m⁻²·s⁻¹ at canopy for most vertical strawberry systems. Strawberry quality and yield also depend on that dose arriving consistently; research in ASHS HortScience reports strawberries perform best when PPFD stays around 300 µmol·m⁻²·s⁻¹ or higher across a 16-hour photoperiod.
Propagation and Stock Lighting
Propagation and stock plants run on a smaller budget. Seedlings, rooted tips, and runner plants need enough photons to build healthy tissue without pushing premature generative growth. The evidence points to roughly 100–200 µmol·m⁻²·s⁻¹, which at a typical run time lands near 11.5–17.3 mol·m⁻²·day⁻¹ DLI, with multiple studies converging on about 11.5 mol·m⁻²·day⁻¹ for efficient runner-plant quality. Keep the two zones physically separate or use zoned dimming so you do not over-light stock while under-lighting production.
Converting PPFD, Photoperiod to DLI
The conversion is simple multiplication that repays getting right. DLI equals PPFD times photoperiod in hours times 0.0036. A 22 mol·m⁻²·day⁻¹ target over an 18-hour photoperiod needs about 340 µmol·m⁻²·s⁻¹; shorten to 16 hours, and the same DLI needs roughly 380 µmol·m⁻²·s⁻¹. Photoperiod and intensity trade directly, so you choose the pair based on energy cost, spectrum strategy, and whether a longer or shorter window suits the crop.
| Stage | Target PPFD (µmol·m⁻²·s⁻¹) | Target DLI (mol·m⁻²·day⁻¹) |
|---|---|---|
| Propagation/stock | 100–200 | 11.5–17 |
| Vegetative | 250–400 | 15–20 |
| Production / fruiting | 300–450 | 20–25 |
Spectrum & Photoperiod
Spectrum shapes morphology, flowering, and fruit quality, but it rarely outperforms getting intensity and uniformity right first. The defensible starting recipe is a white-based full spectrum with added deep red, a controlled blue fraction, and far-red handled as an adjustable channel rather than a fixed part of the base spectrum.
Red/Blue Balance
Commercial strawberry recipes lean red during flowering and fruiting. A red-to-blue ratio of about 4:1 (practical band 3:1–5:1) is widely used for day-neutral varieties. In fractions that means roughly 60–70% red, 15–20% blue, and the rest green and white light for canopy penetration and inspection. Research shows strong performance from red-dominant mixes such as 70% red / 30% blue at 250 µmol·m⁻²·s⁻¹ on a 16/8 h cycle. Blue still matters: it drives compact growth, leaf and root development, and healthy stomatal function, so the goal is enough blue for structure and health without dulling the yield response that red and far-red deliver.
Optional Far-Red Strategy
Far-red (700–750 nm) is the emerging lever for indoor strawberries. Preliminary research at Ohio State University indicates that a substantial far-red photon flux under short-day photoperiods can help prevent semi-dormancy while increasing yield and fruit quality. Because far-red affects phytochrome state and effective photoperiod, treat it as a separate dimmable channel you can raise or lower by cultivar and season rather than a static sub-spectrum.
Photoperiod: 16 h vs 24 h
For day-neutral and long-day strawberries, 16 hours is the strongest default: a high DLI at moderate PPFD, an 8-hour dark period for respiration and carbohydrate balance, and proven fruiting support. The 14–16 h band is most common, with some systems extending to 18 h during vegetative phases. A 24-hour photoperiod is not recommended for strawberries. Continuous light offers no proven yield benefit, adds avoidable energy and heat load, and disturbs the diurnal processes that support quality. To add dose, raise PPFD within a 14–18 h window instead of chasing 24 h.
Layout & Uniformity
Strawberries ripen and grade by position on the plant, so uneven light across a tray produces scattered harvests, variable berry size, and pack-line downgrades. The light plan on paper is only as good as the photon distribution you verify at the canopy.
Rack Geometry and Bar Spacing
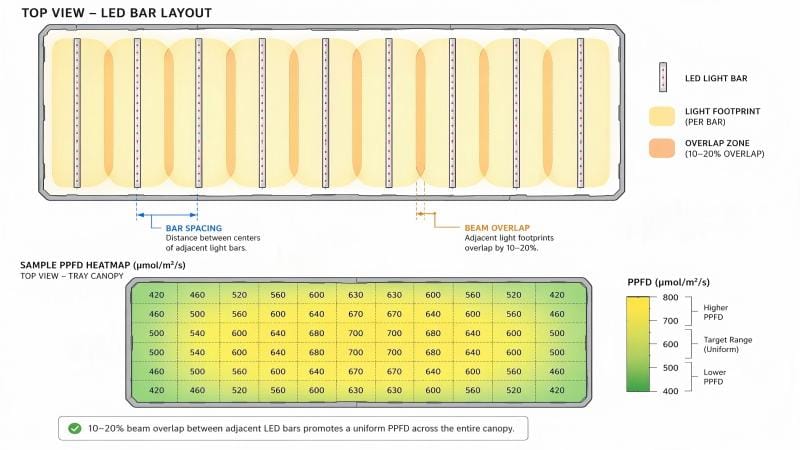
Linear LED bars suit narrow strawberry trays because they distribute light along the row instead of concentrating it from a point source. Mount bars so their beam footprints overlap at the canopy, spaced evenly rather than clustered — sparse layouts create dark valleys and over-dense layouts create hot stripes. Start with 10–20% beam overlap between adjacent bars for narrow racks to smooth the transition between footprints and prevent discrete bright and dark zones. Working spacing is set by beam angle, mounting height, and tray width, so verify it against a measured map.
Beam Overlap and PPFD Uniformity
The working uniformity standard for production racks is a minimum-to-average PPFD ratio of at least 0.75–0.80, with many operators using 0.85 as a stricter internal target where ripening consistency is critical; the coefficient of variation should stay near 15–20% or lower. Mounting height for strawberries is typically 25–40 cm above the canopy. Wide-beam optics that push photons toward tray edges prevent the classic bright-center, photon-starved-edge failure that an “average PPFD” spec hides. Overlapping, slightly dimmed bars generally out-produce a brighter array with uneven peaks.
Commissioning with Maps and Controls
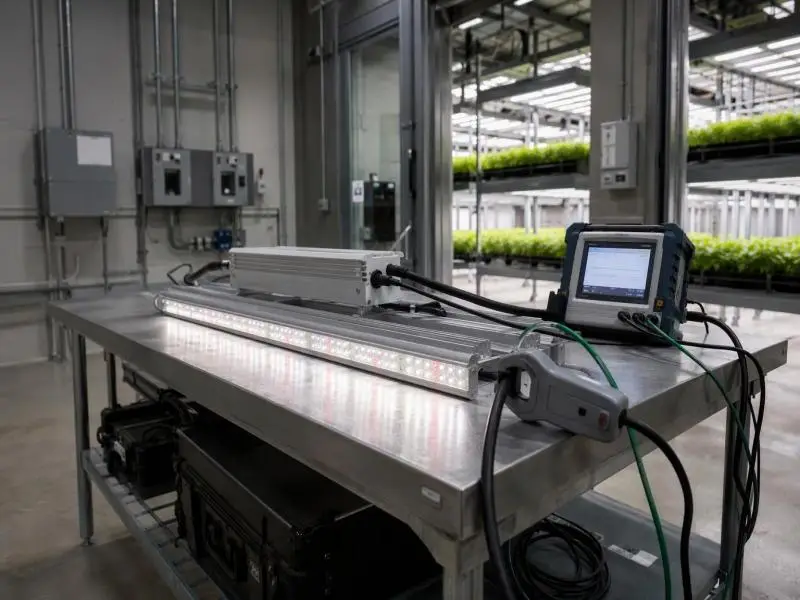
Commissioning is a repeatable process. Fix the measurement plane at the top of the mature canopy, grid-map PPFD across the full tray including edges and corners with a calibrated quantum sensor, then compute average, minimum, maximum, and CV%. Hot stripes mean increase spacing or dim; edge drop-off means add overlap or perimeter compensation. Re-map until the distribution meets the acceptance band. Separate two tuning actions: make the PPFD field even with height and spacing, then use dimming to hit the dose without reintroducing hotspots — the sequence SLTMAKS’ vertical farm lighting solutions guide emphasizes for heat and PPFD uniformity across tiers.
Thermal & HVAC Integration
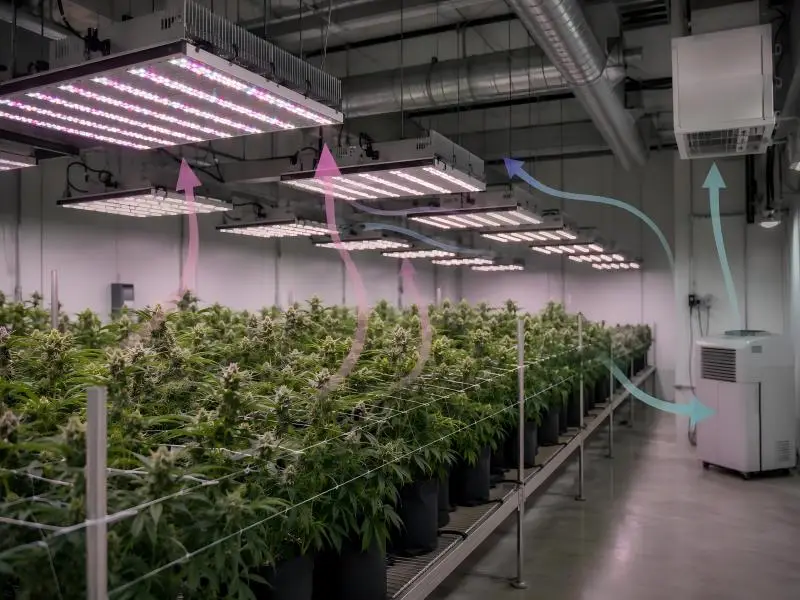
Lighting is the dominant driver of the heat and moisture load the HVAC must remove. In strawberry vertical farming, where multiple tiers confine heat in a small volume, thermal integration often decides whether the whole system holds its design point.
Leaf Temperature and VPD Targets
LEDs emit far less infrared than HPS, so leaf temperatures typically run 1–3°C cooler under similar conditions. But fixtures, drivers, and absorbed electrical power still release sensible heat, and tight rack spacing can trap it into localized microclimates. Trapped heat raises air temperature in a tier, driving up vapor pressure deficit (VPD), increasing transpiration demand, and forcing stomatal closure that stalls photosynthesis. Design airflow tier by tier so warm air is swept out rather than stratifying, and monitor leaf temperature alongside air and relative humidity to hold VPD in the productive band.
Driver Placement and Heat Paths
Driver location changes the thermal budget. LED drivers account for roughly 15–20% of fixture heat; mounting them inside the grow zone adds that heat to the cultivation environment, while relocating them outside the rack removes it from the canopy area. Several vertical-farm guides report this can cut the in-room thermal load by up to about 30%. Fixture input converts to sensible heat at roughly 3.412 BTU/hr per watt, so the reduction is measurable and compounds into smaller HVAC sizing and lower operating cost.
Dehumidification and Latent Load Sizing
Latent load is the hidden cost that keeps growing after lights switch off. Higher PPFD increases transpiration, loading the air with moisture the system must condense and remove; in dense racks, latent load often exceeds sensible load, making dehumidification a major operating cost even with efficient lights. An energy-balance analysis of an indoor strawberry plantation found LED lighting increased evapotranspiration and heat loads by up to five times versus a no-light baseline. Size dehumidification around actual transpiration rather than room temperature alone, and use tier-level sensing so you do not over-cool on sensible load while latent load quietly drives total cost.
Fixture Selection & Compliance for Strawberry Vertical Farming Lights
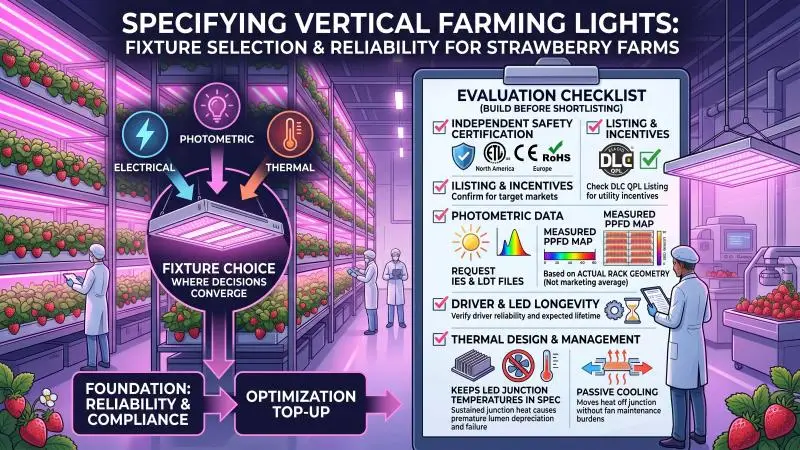
Fixture choice is where the electrical, photometric, and thermal decisions converge. For a commercial strawberry vertical farm, reliability and compliance are the foundation; everything else is optimization on top. The criteria below align with how industrial LED grow light systems are specified for large racked facilities.
Reliability and Safety Checklist
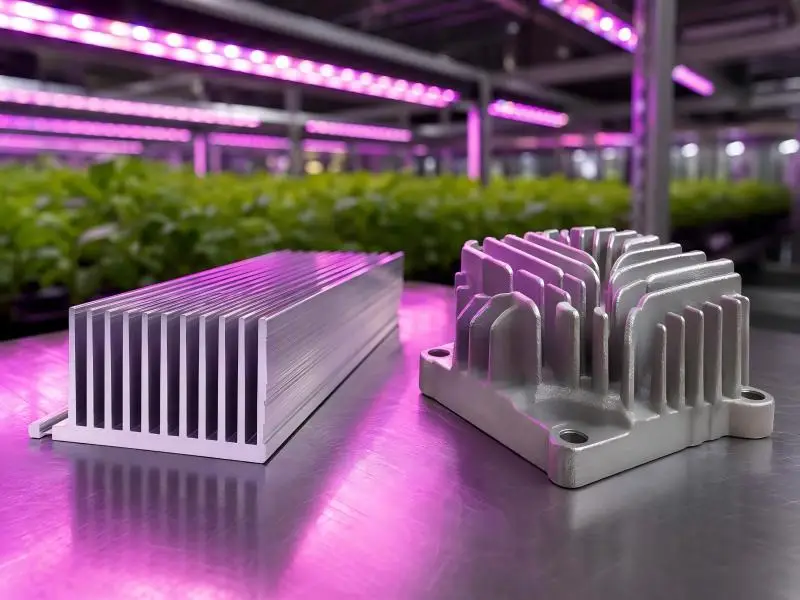
Build an explicit evaluation checklist before shortlisting fixtures. Confirm independently tested safety certification for target markets — ETL in North America, CE and RoHS in Europe — and check DLC QPL listing where utility incentives apply. Request photometric data (IES or LDT files) and a measured PPFD map for your actual rack geometry rather than a marketing average. Verify driver reliability and expected lifetime, and confirm the thermal design keeps LED junction temperatures in spec, because sustained junction heat drives premature lumen depreciation and failure. Passive, well-built thermal management moves heat off the junction without fan maintenance burdens.
Controls, Dimming, and Zoning
Control compatibility is a selection criterion, not an afterthought. Fixtures should accept standard dimming signals, support per-tier or per-zone dimming, and run DLI-based profiles across propagation, vegetative, and fruiting zones. Dimming that separates dose tuning from uniformity tuning is the practical enabler of the commissioning sequence above, and it lets you respond to utility rates and shift light scheduling without touching hardware.
Brand Note Insertion
SLTMAKS builds vertical-farm lighting around the same engineering priorities: high-efficacy Samsung diodes, passive thermal management with aluminum heat-sink designs that route driver heat away from the canopy, and controllable spectrum options for tuning red, blue, and far-red per phase. Fixtures carry ETL, CE, and RoHS certification, are listed on the DLC QPL where applicable, and ship with IES/LDT photometrics and a 3-year warranty. The intent is to give a multi-site operator documented, serviceable lighting they can replicate across racks without re-validating thermal or photometric performance each time. Weigh these as selection features against your own rack geometry and compliance needs rather than as claims that replace due diligence.
ROI & Payback
Strawberry vertical farming is capital-intensive, so the lighting ROI must be modeled transparently. This framework uses your inputs and shows its assumptions, so you can substitute your own electricity rate, efficacy, and yield expectations.
Power Density and kWh Modeling
Start from installed power. Lighting energy per year equals fixture power in kilowatts times annual photoperiod hours times number of fixtures; multiply by your rate for lighting-only cost. Because fixture power flows directly into heat, every kilowatt also carries an HVAC penalty. A higher-efficacy fixture (µmol/J) delivers the same DLI at lower wattage, cutting both lighting kWh and the heat the HVAC must remove — which is why efficacy and thermal design compound into ROI. SLTMAKS’ guide to the most efficient LED grow lights explains how to compare photon output and distribution the way utility programs do, a useful reference for sizing the energy side.
Yield Uplift and Quality Premiums
Model two benefit streams separately: yield uplift from hitting the correct PPFD and DLI, and value per unit from quality and uniformity. Consistent, uniform light reduces scattered ripening and raises the share of berries that grade into premium pack classes. Keep yield and quality assumptions conservative and stated clearly so the model does not quietly rely on optimism. For multi-site operators, repeatable lighting performance across facilities is itself a value line — it reduces the cost of re-optimizing every site.
Payback Timeline Scenarios
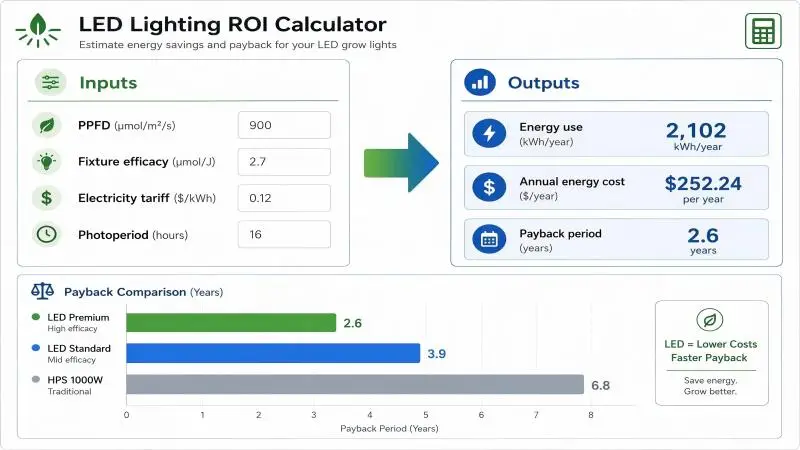
Run the model across conservative, moderate, and optimistic scenarios rather than a single number. The conservative case uses current baselines and your real tariff; the moderate case captures a realistic yield-quality uplift; the optimistic case includes full energy and HVAC savings from high efficacy plus remote drivers. A payback inside one to three crop years at moderate assumptions is defensible; if it depends on optimistic yield claims alone, treat that as a warning. Net savings equal avoided lighting cost plus avoided HVAC and dehumidification cost minus added controls and maintenance. Simple payback is the incremental LED investment divided by that net annual savings — a number you can defend to procurement, not a marketing figure.
FAQ
What PPFD do strawberries need in vertical farming?
For flowering and fruiting, target roughly 300–450 µmol·m⁻²·s⁻¹ at the canopy, which lands a 20–25 mol·m⁻²·day⁻¹ DLI on a typical photoperiod. Propagation and stock zones run lighter at about 100–200 µmol·m⁻²·s⁻¹. Because photoperiod and intensity trade directly, always convert PPFD to an achievable DLI before committing to a fixture count: DLI equals PPFD times run hours times 0.0036.
What is the best light spectrum for strawberry flowering?
A white-based full spectrum with a red-heavy ratio works best for day-neutral varieties. A red-to-blue split near 4:1 (about 60–70% red, 15–20% blue) supports flowering and fruiting while the blue fraction keeps growth compact and stomata healthy. Treat far-red (700–750 nm) as a separate dimmable channel rather than a fixed part of the base spectrum, since it can help prevent semi-dormancy and improve fruit quality under short photoperiods.
Is a 24-hour photoperiod good for indoor strawberries?
No. Continuous light offers no proven yield benefit and adds avoidable energy and heat load while disrupting the diurnal processes behind fruit quality. A 16-hour photoperiod is the strongest default for day-neutral and long-day strawberries, with the 14–18 h band covering most phases. To push more dose, raise PPFD within a 14–18 h window instead of extending to 24h.
Why do strawberries ripen unevenly even with strong average PPFD?
Because an “average PPFD” hides hotspots and dark valleys. Strawberries grade by position on the plant, so uneven light scatters ripening and shrinks the premium pack share. Space linear bars for 10–20% beam overlap at the canopy, use wide-beam optics to push photons to tray edges, and hold a minimum-to-average uniformity of 0.75–0.85. Verify it by grid-mapping PPFD with a calibrated quantum sensor across edges and corners, not just the middle of the tray.
Conclusion
The specifications that matter for strawberry vertical farming are consistent across the research and the practice. Hold production PPFD near 300–450 µmol·m⁻²·s⁻¹ and DLI at 20–25 mol·m⁻²·day⁻¹, keep propagation zones near 100–200 µmol·m⁻²·s⁻¹, run a white-based, red-heavy spectrum with optional far-red, and default to a 16-hour photoperiod. Engineer layout for 10–20% beam overlap and a min/avg uniformity of 0.75–0.85, and commission it with real PPFD maps. Design thermal integration around leaf temperature, VPD, driver placement, and dehumidification load.
For deployment, prioritize reliability, compliance, and commissioning. Certified fixtures with documented photometrics and serviceable construction remove the largest operational risks, and a repeatable commissioning and dimming sequence lets a multi-site operator standardize performance instead of re-solving it at every location. Combined with transparent ROI modeling, that is a defensible path from a pilot tier to a full facility.
Start small and measure. Stand up a pilot tier, log PPFD, temperature, VPD, and yield per harvest, and use that data to tune dose and uniformity before scaling. Iterative optimization against measured results is how a good lighting strategy becomes a profitable one — and how strawberry vertical farming scales without repeating its errors.