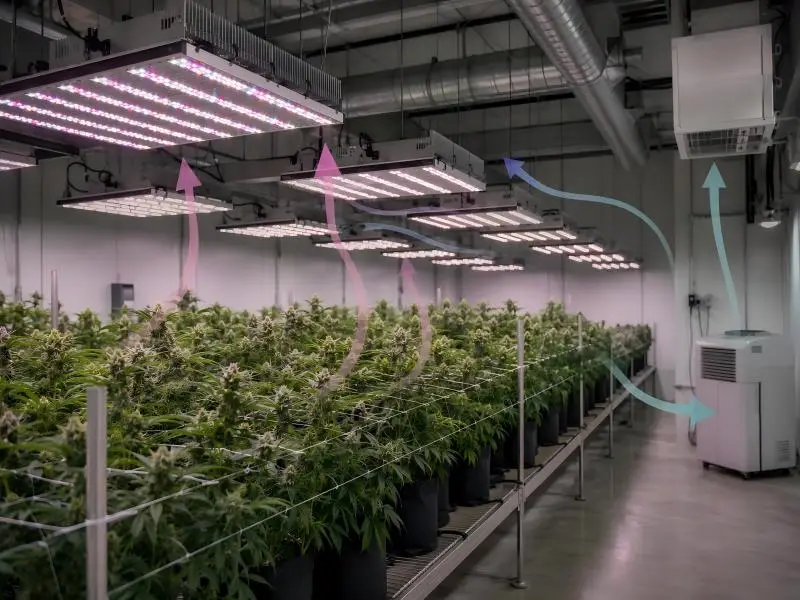
Wall draw determines what a lighting retrofit actually costs to run, how much heat the HVAC system must remove, and whether your existing branch circuit can carry the fixtures you are evaluating. When investing in a true wattage LED grow light, knowing this actual wall draw is essential. The U.S. average commercial electricity rate was 14.53 cents per kilowatt-hour in July 2026, with the industrial average at 9.77 cents. At those rates, a 10 kW lighting load running 4,380 hours a year costs roughly $6,364 at the commercial average.
“Advertised wattage” is not a standardized term. Depending on the vendor, it can mean rated input power, maximum input power, the summed rating of the diodes, or an HPS-equivalent marketing claim, and only measured or specified AC input power at the intended operating setting is valid for energy cost, heat load, and circuit sizing (Xinelam, retrieved 2026-10-09).
This guide gives you a repeatable bench method: select an instrument class, connect safely, stabilize the fixture, sweep the dimming range, and record six electrical quantities that reconcile the nameplate against the wall. You finish with data you can hand to an electrical engineer, a utility program reviewer, or a procurement committee.
Instruments & Setup
The instrument class sets the ceiling on what your measurement can prove, so choose it before you touch a fixture. For LED grow light true wattage measurement, the reference method is ANSI/IES LM-79-19, which requires the AC power meter to hold an expanded uncertainty (k=2) of 1.0% or less for active AC power from 0.5 Hz to 1 kHz, and 2.0% or less from 1 kHz to 100 kHz (ANSI/IES LM-79-19, 2019 edition).
True-Power Meters and Sensors
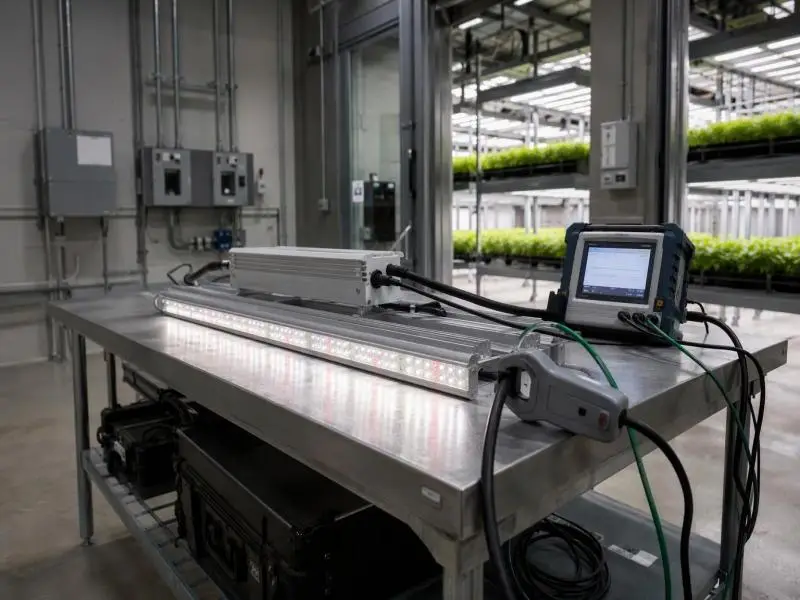
A true-RMS clamp meter that measures current alone cannot report true watts, because it has no simultaneous voltage input and no phase information. A power analyzer is required once driver distortion, low power factor, harmonics, or startup surge matter, which is the normal case for LED drivers.
Two instrument families meet the LM-79 accuracy bar. A Class-A power analyzer such as the Hioki PW3198 specifies power accuracy of ±0.2% rdg. ±0.1% f.s. plus the clamp sensor’s own accuracy, harmonics to the 50th order, and 200 kHz sampling (Hioki PW3198 datasheet, retrieved 2026-10-09). An IEC 61000-4-30 Class A analyzer such as the Fluke 1770 Series covers harmonics to IEC 61000-4-7 Class 1 and IEEE 519, with voltage accuracy of ±(0.04% + 0.004%) and current accuracy from ±(0.7% + 0.02%) with a 40 A AC clamp to ±(1.5% + 0.03%) with a 6000 A flexible probe (Fluke 1770 Series datasheet, retrieved 2026-10-09).
The clamp you attach is part of the error budget, not an accessory. Metering accuracy depends on both the meter and the connected current transformers, and metering-accuracy CTs are designed to hold accuracy from very low current up to the maximum rating; a higher ANSI C12.1 accuracy class is generally needed for tenant revenue billing rather than for spot measurement of equipment (Pacific Northwest National Laboratory, retrieved 2026-10-09). For a one-time fixture evaluation, a mid-range analyzer with a matched clamp is defensible; for a permanent submeter feeding a rebate claim, the CT class becomes the deciding specification.
Safe Connections on 120–277 V
Live measurement is a qualified-person task with a defined procedure. Under OSHA 1910.333(a)(1), live parts to which an employee may be exposed must be deenergized before work unless deenergizing introduces additional or increased hazards or is infeasible, and live parts under 50 V to ground need not be deenergized absent increased burn or arc-flash exposure; verification of a deenergized condition requires a qualified person to test the circuit elements with test equipment, including a check for induced voltage or backfeed (OSHA 29 CFR 1910.333, retrieved 2026-10-09).
⚠️ Warning: A 277 V branch is normally part of a 480Y/277 V system, so test equipment must be selected for the system voltage and available fault energy, not for the load voltage alone. Confirm the CAT rating of every probe and clamp against the panel it will enter before the first measurement.
For a grow room, the practical sequence is to measure at the fixture cord or a dedicated test receptacle where possible, and to reserve panel-level work for an electrician working under lockout/tagout (LOTO).
Inrush Capture Considerations
Inrush is the startup spike that decides whether a breaker trips when a room is switched on, and it needs a different instrument mode than steady-state power. A capture instrument triggers a 100 ms session, taking a measurement every 1 ms; that window covers 6 cycles at 60 Hz and 5 at 50 Hz, with a default trigger threshold 10% above steady state (AEMC True InRush application note, retrieved 2026-10-09).
The magnitudes in the same note are illustrative rather than normative for LED drivers: a three-phase motor can draw up to 12× normal current for 75 to 150 ms, and a transformer about 25× rated current for about 10 ms. Treat those as brackets for what a capture mode must be able to see, not as expected driver figures. Most inrush-capable instruments measure inrush only from a powered-off state, capturing current and voltage from power-down through power-up to steady state within the first few seconds after start-up, so the fixture must be switched off between captures.
Measurement Procedure
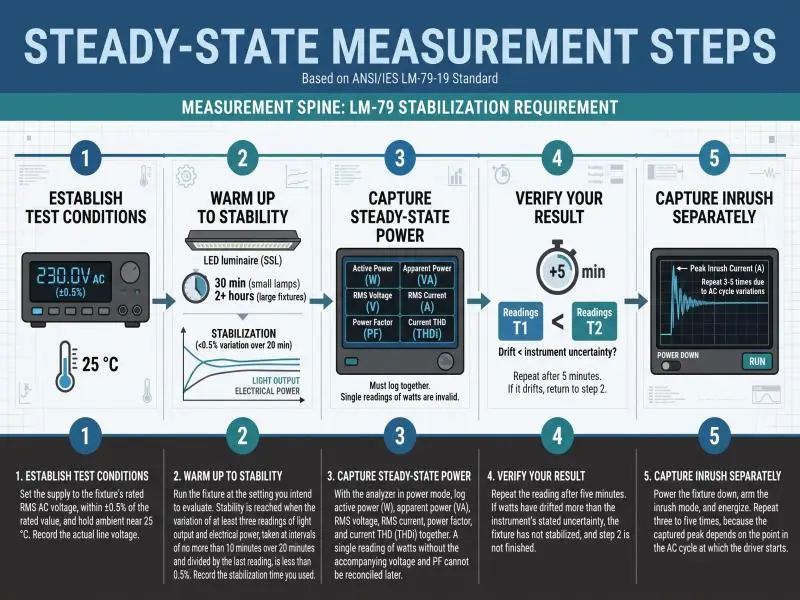
The procedure below produces a wall-draw figure that survives review because every number carries a unit, a condition, and a method. The measurement spine is the LM-79 stabilization requirement: operate the device under test until photometric and electrical stabilization and temperature equilibrium are reached, which typically takes 30 minutes for small integrated LED lamps and two or more hours for large SSL luminaires (ANSI/IES LM-79-19, 2019 edition).
Steady-State Measurement Steps
- Establish the test condition. Set the supply to the fixture’s rated RMS AC voltage, within ±0.5% of the rated value, and hold ambient near 25 °C. Record the actual line voltage, because a driver’s input power moves with it.
- Warm up to stability. Run the fixture at the setting you intend to evaluate. Stability is reached when the variation (maximum to minimum) of at least three readings of light output and electrical power, taken at intervals of no more than 10 minutes over 20 minutes and divided by the last reading, is less than 0.5%. Record the stabilization time you used.
- Capture steady-state power. With the analyzer in power mode, log active power (W), apparent power (VA), RMS voltage, RMS current, power factor, and current THD (THDi) together. A single reading of watts without the accompanying voltage and PF cannot be reconciled later.
- Verify your result. Repeat the reading after five minutes. If watts have drifted more than the instrument’s stated uncertainty, the fixture has not stabilized, and step 2 is not finished.
- Capture inrush separately. Power the fixture down, arm the inrush mode, and energize. Repeat three to five times, because the captured peak depends on the point in the AC cycle at which the driver starts.
Dimming Test matrix for A True Wattage LED Grow Light
Dimming is where advertised wattage and wall draw separate most sharply, because a driver’s efficiency, power factor and THD all change with load. Build a matrix rather than a single reading: run the fixture at 100%, 80%, 60%, 40% and the minimum dim level, and record the full six-quantity set at each step. Include the standby or dim-to-off value if the fixture supports it.
The DLC’s horticultural requirements define the reporting fields you should mirror: minimum input wattage is the input power at the minimum dimming level and must include standby power when the product can be dimmed to off, while default input wattage is the wattage at the as-shipped setting (DLC Horticultural Lighting Technical Requirements V4.0, revised 2025-10-01).
Pro Tip: Record line voltage at every dim step, not just at full output. A driver that holds constant power will pull more current as voltage sags, and a matrix without voltage cannot tell you whether a current increase came from dimming or from the supply.
What to Record: V, I, W, VA, PF, THD
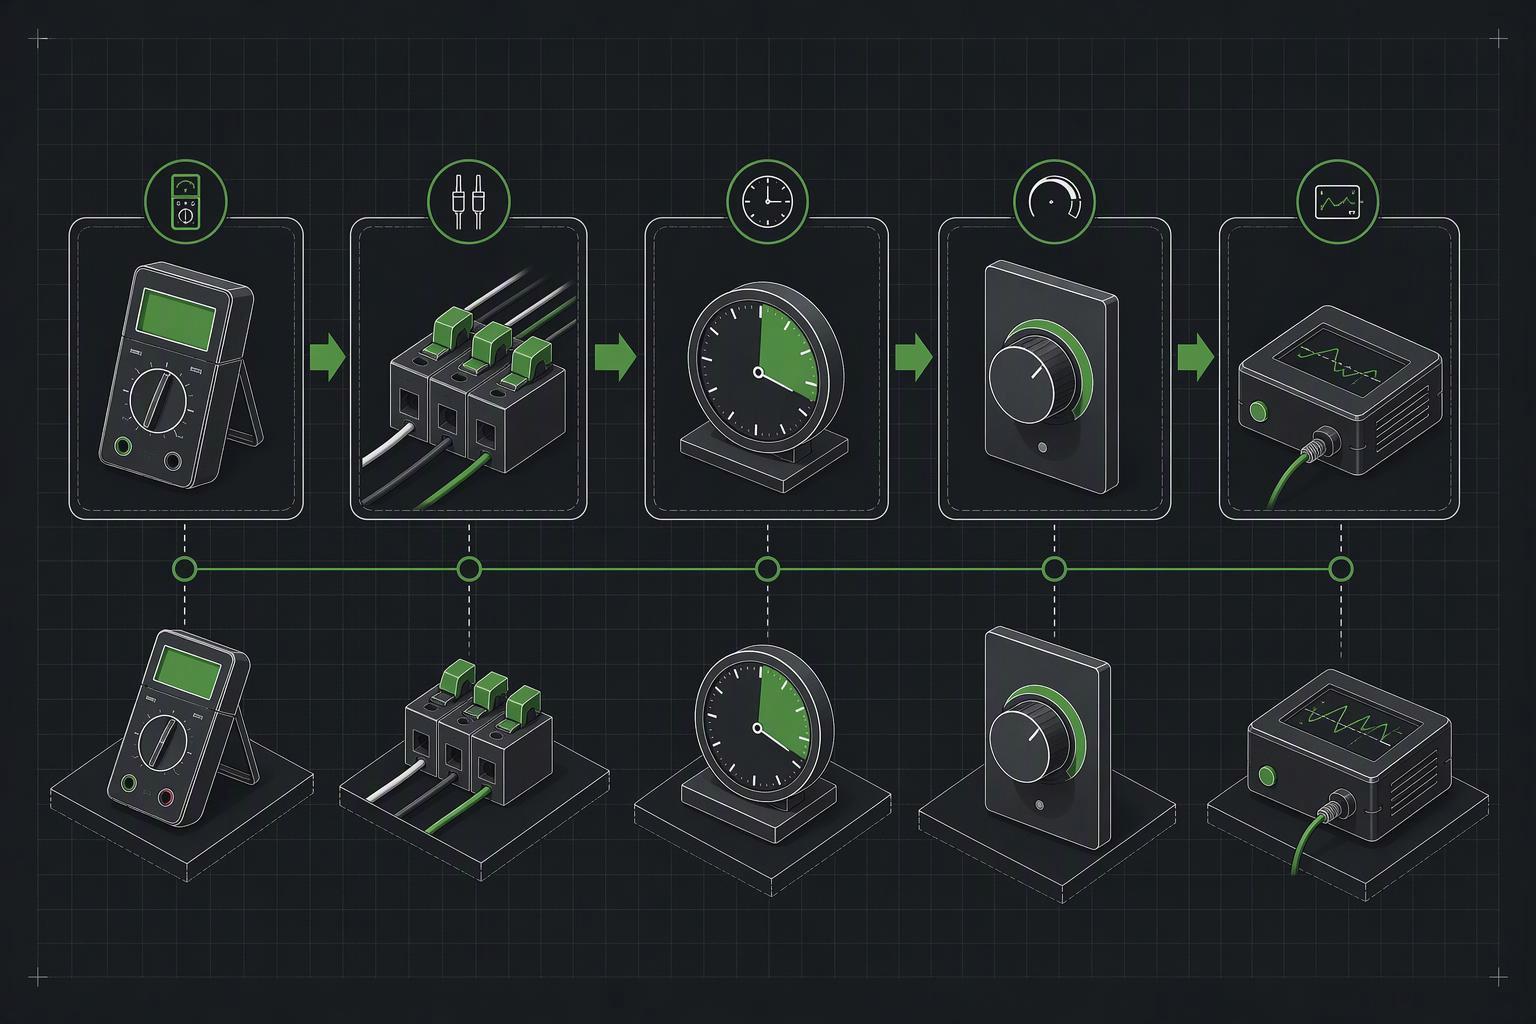
The six-quantity table is the deliverable. Keep these columns for every fixture, every dim level and every voltage condition:
| Quantity | Unit | Why it matters |
|---|---|---|
| RMS voltage | V | Sets the current a given wattage requires |
| RMS current | A | Sizes conductors, breakers and CTs |
| Active power | W | Drives kWh cost and heat load |
| Apparent power | VA | Drives the current the circuit must carry |
| Power factor | dimensionless | Converts W to VA and reveals driver quality |
| Current THD (THDi) | % | Distortion injected into the branch |
The DLC requires current THD, not voltage THD, and requires testing at maximum, non-dimmed output; power factor and THD readings taken at part-load dimming are not recognized for qualification (DLC SSL V6.0 & LUNA V2.0, released 2025-11-03). That distinction matters for your own records: a strong THDi at 40% dim is useful engineering information about the installation, but it is not the number a qualification program will compare against.
Interpreting Results vs Advertised
Reconciling a wall reading against a datasheet is a matter of matching measurement conditions before comparing numbers. The DLC horticultural program defines photosynthetic photon efficacy as the fixture’s output over the 400–700 nm band divided by the total electrical input watts to the fixture, including ancillary loads such as controllers, sensors, and cooling fans (DLC Horticultural Lighting Technical Requirements V4.0, revised 2025-10-01). If your wall reading includes a controller and a fan that the datasheet figure excluded, the gap is a scope difference, not a performance failure.
PF and VA vs W Relationships
Watts set real energy consumption; volt-amperes set the current that conductors, breakers, transformers, and switchgear must carry. The relationship is I = W / (V × PF), so a 1,000 W load draws about 8.33 A at 120 V and unity power factor, about 8.77 A at PF 0.95, and about 11.90 A at PF 0.70. The PF values bracket the real range: the DLC requires qualified luminaires to hold a power factor of at least 0.9, met at worst-case loading conditions (DLC SSL V6.0 & LUNA V2.0, released 2025-11-03), while a constant-voltage/constant-current driver datasheet such as the HLG-480H publishes PF ≥0.95 at 277 VAC (Mean Well HLG-480H datasheet, retrieved 2026-10-09).
The practical consequence is that a fixture measured at 1,000 W and PF 0.70 loads a 120 V branch like a 1,430 VA load. Sizing the circuit from watts alone understates the current by roughly 36% in that case.
Driver Efficiency and Auxiliaries
A datasheet’s “rated power” is usually an output figure, not a wall figure, and the difference is the driver’s conversion loss plus anything else the fixture powers. The HLG-240H datasheet illustrates the pattern: it publishes rated output power per model from 192 W to 241.2 W, typical AC input current of 4 A at 115 VAC, 2 A at 230 VAC and 1.2 A at 277 VAC, and efficiency up to 93.5%, but no separate input-wattage figure (Mean Well HLG-240H datasheet, retrieved 2026-10-09). Reading “240 W” as the wall draw ignores the conversion loss entirely.
The same datasheet shows why part-load behavior needs its own row in your matrix: THD is specified below 20% only when output loading is at least 50% at 115/230 VAC and at least 75% at 277 VAC, so THD is simply not specified below those load points. A grow room dimmed to 40% can therefore sit outside the conditions under which the driver’s published distortion figure was established.
Datasheet Alignment and DLC Notes
Qualification programs publish tolerances, and they are tighter than most buyers assume. The DLC’s current technical requirements allow a luminaire efficacy shortfall of 3%, a power factor shortfall of 3 percentage points, a THD overage of 5 percentage points, and a light output shortfall of 10% (DLC SSL V6.0 & LUNA V2.0, released 2025-11-03). Those are qualification and surveillance tolerances, not a field-measurement allowance, so a wall reading that misses a listed PF by more than 3 percentage points is worth a conversation with the vendor.
Where the sources disagree is on how harmonic limits are expressed. ANSI C82.77-10-2020 covers harmonic emission limits for lighting equipment over the 0–9 kHz range and states that limits may be expressed as THD, displacement factor, or harmonic distortion factor depending on the product, superseding the power factor and THD requirements of ANSI C82.11, C82.14 and C82.16 (NEMA, ANSI C82.77-10-2020, approved 2020-01-09). The DLC horticultural requirements are more prescriptive and more recent, requiring current THD at 20% or less measured at full, non-dimmed output. For a horticultural fixture, the DLC document is the one to reconcile against; the ANSI standard is the broader framework behind it.
One gap is worth stating plainly: no standards body or accredited laboratory publishes a typical percentage by which a grow light’s wall draw differs from its advertised figure. The mechanisms are identifiable (driver efficiency, power factor, ancillary loads, dimming state, HPS-equivalent marketing), but the size of the gap is a property of the specific fixture, which is why the measurement matters more than any published range.
Applying Results to Design & ROI
Measured watts convert directly into code compliance, distribution design and financial documentation, provided you apply the right rule to the right component. The NEC definition of a continuous load is a load where the maximum current is expected to continue for 3 hours or more (NFPA 70, National Electrical Code, 2023 edition, Article 100, 2023 edition). A cultivation light schedule of 12 to 18 hours a day is a continuous load by that definition, which changes the sizing arithmetic.
NEC Continuous Load and Inrush Planning
For branch-circuit conductors, NEC 210.19(A)(1) requires an ampacity not less than the noncontinuous load plus 125% of the continuous load (NEC 210.19(A)(1), retrieved 2026-10-09). A measured 16 A continuous lighting load therefore requires conductor ampacity and overcurrent protection sized for 20 A, and an 18 A load requires 22.5 A. The code text also carries an exception: where the assembly, including the overcurrent devices protecting the branch circuit, is listed for operation at 100% of its rating, the conductors may be sized at the sum of the continuous and noncontinuous load.
The overcurrent device rule is a separate section from the conductor rule, and the two should not be treated as interchangeable. The 2023 code text carries the overcurrent device requirement as not less than the noncontinuous load plus 125% of the continuous load for the over-1000 V analogue in 235.20(A), with 210.20(A) as the corresponding rule for systems at or below 1000 V (NFPA 70, 2023 edition, 2023 edition). Confirm the 210.20(A) wording against the code edition your jurisdiction has adopted before you finalize a panel schedule.
Inrush planning sits alongside the continuous-load calculation rather than inside it. Repeated inrush tripping shortens the life of protective devices and can pit or weld switch contacts, and power supplies often include an inrush current limiter; without one, inrush is limited mainly by line impedance (AEMC True InRush application note, retrieved 2026-10-09). A driver’s published inrush figure carries its own measurement basis, so compare like with like: the HLG-480H datasheet (Mean Well HLG-480H datasheet, retrieved 2026-10-09) does not state an inrush current figure, so a peak-ampere figure captured with a different method is not the same quantity.
Voltage Drop and Distribution Strategy
Voltage drop is a design recommendation rather than a mandatory limit: the informational notes to NEC 210.19(A) and 215.2(A) suggest 3% maximum on the branch circuit and 5% combined for feeder plus branch circuit, and some jurisdictions enforce stricter limits (CalcEngineer, retrieved 2026-10-09). Because the note is advisory, the design decision belongs to the engineer, and the measured current from your matrix is the input that decision needs.
Distribution strategy follows from the PF and VA data. A branch carrying 12 fixtures at 320 W each is 3,840 W of real power; at PF 0.95 that is about 4,042 VA and, at 277 V, roughly 14.6 A, while at PF 0.70 it is about 5,486 VA and roughly 19.8 A. The same fixtures, the same light output, and a different conductor and breaker decision. Where the DLC notes that power factor and THD are commonly worst-case at 277 V while efficacy is commonly worst-case at 120 V (DLC SSL V6.0 & LUNA V2.0, released 2025-11-03), the 277 V commercial branch is the condition to measure if you can only measure one.
Submetering and PPE from Measured Watts
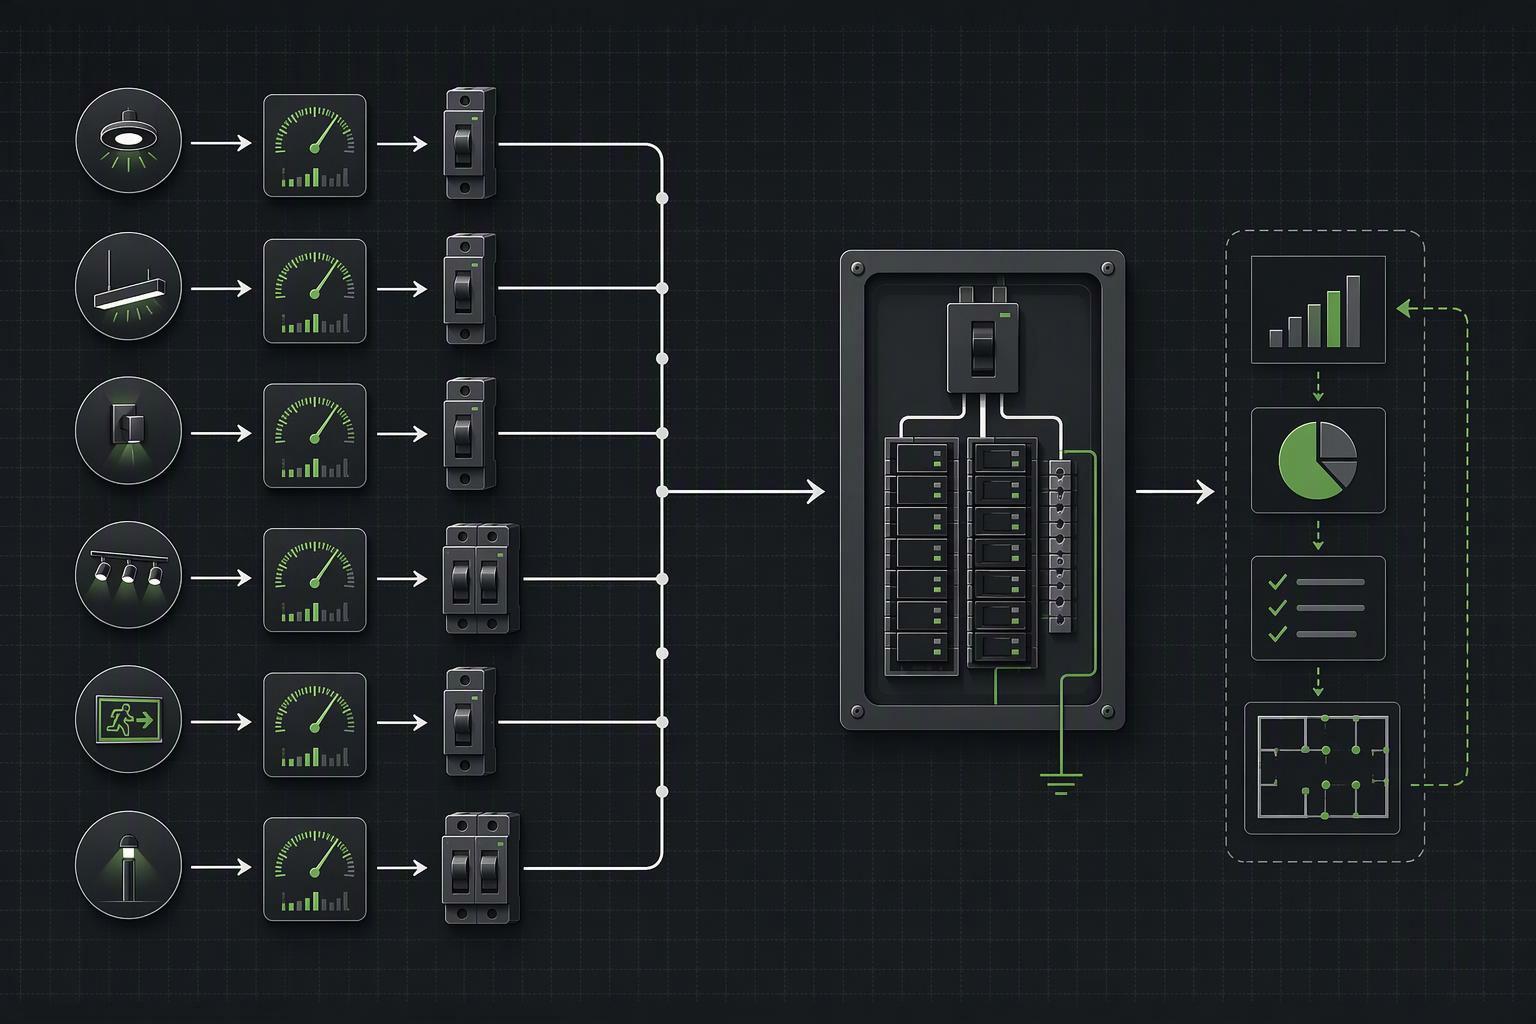
Measured watts feed two downstream systems: the submeter that bills or reports energy, and the efficacy metric that compares fixtures. On the metering side, accuracy depends on the meter and its CTs together, and a higher ANSI C12.1 accuracy class is generally reserved for tenant revenue billing rather than spot equipment measurement (Pacific Northwest National Laboratory, retrieved 2026-10-09). Match the class to the purpose: a rebate file and a tenant bill do not need the same instrument.
On the efficacy side, the DLC’s definition of input watts includes ancillary loads, and where alternate drivers produce different input wattage, the worst case is published on the Qualified Products List; dimming-range reporting requires minimum input wattage, minimum PPF, default input wattage, and default PPF (DLC Horticultural Lighting Technical Requirements V4.0, revised 2025-10-01). If your wall reading includes a controller, the QPL figure excluded; your calculated efficacy will read low for reasons that have nothing to do with the diodes.
Incentive documentation has its own data requirements. Utility lighting incentive applications ask for baseline and proposed fixture type, quantity and wattage, operating hours by usage group, control type and controlled watts, and for custom projects measured pre- and post-installation power; the DOE lighting evaluation protocol recommends IPMVP Option A, with fixture wattage taken from published tables and operating hours measured, and notes that actual fixture wattage varies by installation and housing type by less than 5% (U.S. Department of Energy, retrieved 2026-10-09). That last figure is the reason a wattage table is acceptable for a program baseline, and the reason your own measurement is stronger evidence when a project is custom.
Conclusion
The measurement itself is the easy part: a Class A analyzer, a matched clamp, a stabilized fixture, and a six-quantity table at every dim level. What the method buys you is a defensible answer to three separate questions that advertised wattage conflates. Real power in watts sets the energy cost and the heat load. Apparent power in volt-amperes sets the conductor, breaker, and transformer sizing, and it can exceed the wattage by more than a third at low power factor. Current THD and inrush set the power-quality and protection behavior of the branch.
The evidence base for reconciliation is narrower than most buyers expect. The DLC publishes power factor, THD, and tolerance thresholds for qualified products, ANSI/IES LM-79-19 sets the instrument accuracy, stabilization, and ambient conditions under which those figures are meaningful, and the NEC sets the 125% continuous-load rule that turns a measured current into a conductor size. No source publishes a typical advertised-versus-measured gap, because the gap is a property of the fixture, its driver, its ancillary loads, and the dim level you run it at.
The next step is documentation, not procurement. Record the V, I, W, VA, PF, and THDi values for every candidate fixture at full output and across its dimming range, note the line voltage and stabilization time for each run, and file the results with the datasheet and any qualification listing. That file is what an electrical engineer needs to size the branch, what a utility program reviewer needs for a custom incentive claim, and what your own operations team needs to model energy and HVAC load against the 14.53 cents per kilowatt-hour commercial average the EIA reported for July 2026 (U.S. Energy Information Administration, retrieved 2026-10-09).
FAQ
What’s the difference between advertised wattage and actual power draw?
Advertised wattage is a marketing figure. It may be the diodes’ summed rating, a maximum input rating, or an HPS-equivalent claim. Actual power draw, or wall watts, is the real power the complete fixture pulls from the outlet. Only wall watts determine your energy cost and heat load
How do I measure a grow light’s true wattage at the wall?
Use a true-power meter, not a clamp meter reading current alone. Plug the meter in at the outlet, connect the fixture, set it to the dim level you run, and wait for it to stabilize. Then log watts, volts, amps, VA, PF and THDi together. A single watts reading without voltage and power factor can’t be reconciled later.
Does a “1000W” grow light actually use 1,000 watts?
Often it doesn’t. Lights marketed as “1000W” are frequently “1000W equivalent” fixtures that draw only 200–600W at the wall. Check the spec labeled actual power, input wattage or wall draw. A true 1,000W fixture running 12 hours a day uses 360 kWh a month, which is about $61 at a $0.17/kWh rate.