Engineer the perfect light spectrum for optimal plant growth. Boost your yields and cultivate year-round with our energy-efficient LED solutions. Tell us your needs for a customized lighting strategy and quote.
Core Value & ROI Logic of Artificial Lighting in CEA
The Strategic Case for Controlled-Environment Agriculture
Controlled Environment Agriculture (CEA) has evolved from an experimental horticultural model to a capital-intensive industrial sector with measurable supply chain advantages. Vertical farm facilities—whether multi-tier indoor stacking systems, glass-clad commercial greenhouses, or hybrid semi-closed poly-tunnel operations—share a foundational requirement: the reliable, spectrally calibrated delivery of photosynthetically active radiation (PAR) to the crop canopy.
The global CEA market, valued at approximately USD 57 billion in 2023, is projected by multiple independent analysts to exceed USD 130 billion by 2032, driven by concerns over food security, urban proximity logistics, and agricultural water constraints. Within this expansion, artificial horticultural lighting represents a critical enabling technology—and the single largest energy expenditure in fully enclosed vertical farm facilities, accounting for 25–40% of total operational costs depending on facility type and geographic latitude.
The economic justification for investing in high-efficiency industrial LED grow light systems infrastructure rests on four independently verifiable pillars:
Yield per square meter per year (YSM²/yr): LED systems enable 10–25 harvest cycles annually in leafy greens, versus 2–4 cycles in conventional field agriculture.
Energy efficiency (PPE): Modern industrial LED fixtures achieve photon efficiencies of 3.0–3.6 μmol/J, compared with 1.5–2.0 μmol/J for legacy HPS systems.
Spectral control: LED systems allow precise manipulation of red:far-red ratios, blue fraction percentages, and UV supplementation to target crop-specific physiological responses.
Infrastructure longevity: High-grade LED fixtures rated at L90 ≥ 54,000 hours reduce fixture replacement cycles significantly relative to discharge lamp alternatives.
ROI Framework for Lighting Infrastructure Investment
Commercial greenhouse engineering contractors and large-scale indoor farm operators typically evaluate horticultural lighting investments against a five-year total cost of ownership (TCO) model. The following framework provides a structured analytical baseline:
ROI Factor
HPS Benchmark
LED (Standard, ≥2.8 μmol/J)
LED (High-PPE, ≥3.4 μmol/J)
Fixture Wattage (typical top-light)
600–1,000 W
600–800 W
320–650 W
PPE (μmol/J)
1.5–1.9
2.8–3.2
3.4–3.7
Heat Load (% of input power as radiant heat in canopy zone)
55–65%
15–25%
10–18%
HVAC Cost Reduction vs. HPS
Baseline
20–30%
30–45%
Annual Energy Cost (1,000 fixtures, 18 hr/day)
~USD 2.1M
~USD 1.4M
~USD 0.95M
L90 Lumen/Flux Maintenance
10,000–15,000 hr
36,000–50,000 hr
50,000–60,000 hr
Typical Payback Period vs. HPS
—
2.5–4.0 yr
1.8–3.2 yr
Calculations based on USD 0.10/kWh blended commercial utility rate. Actual payback varies with local tariff structure, photoperiod requirements, and facility capacity factor.
Carbon Accounting & Regulatory Alignment
Across the European Union (EU Taxonomy Regulation), North America (USDA organic certification pathway requirements), and Southeast Asian export markets, procurement teams in institutional CEA operations are increasingly required to document embedded carbon intensity per kilogram of produce. High-PPE LED fixtures directly reduce the kWh-per-kg-of-produce metric, improving both the facility’s carbon intensity reporting and its eligibility for green financing instruments such as green bonds or sustainability-linked loans.
Foundational Radiometric and Photometric Terminology
Procurement engineers and facility designers operating in the CEA space must maintain precision in photometric nomenclature. The following definitions underpin all fixture specification and comparison activities:
Term
Symbol
Unit
Definition
Photosynthetic Photon Flux
PPF
μmol/s
Total photon output of a fixture within the PAR range (400–700 nm) per second
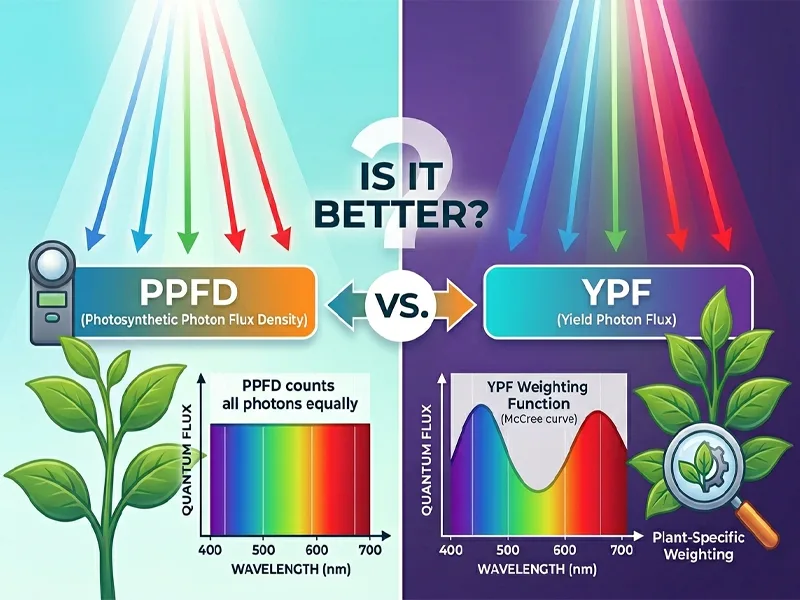
Photosynthetic Photon Flux Density
PPFD
μmol/m²/s
PPF received per unit canopy area, the critical agronomic design parameter
Daily Light Integral
DLI
mol/m²/day
Cumulative PPFD over 24 hours; primary yield-prediction variable
Photon Efficacy (PPE)
η
μmol/J
PPF delivered per joule of electrical energy consumed; principal efficiency metric
Light Uniformity
U
ratio (0–1)
Ratio of minimum PPFD to average PPFD across the target plane (target: ≥0.80)
Red:Far-Red Ratio
R: FR
dimensionless
Ratio of 660 nm photons to 730 nm photons; governs phytochrome photostationary state (Pfr/Ptotal)
Blue Fraction
BF
%
Proportion of 400–500 nm photons in total PAR output
PPFD Target Ranges by Crop Category
The agronomic literature from institutions, including Wageningen University & Research (WUR) and Cornell University’s Controlled Environment Agriculture program, provides empirically derived PPFD targets that guide fixture selection and installation geometry:
Crop Category
Typical PPFD Target (μmol/m²/s)
Recommended DLI (mol/m²/day)
Photoperiod (hr/day)
Leafy greens (lettuce, spinach, arugula)
150–300
12–17
16–20
Herbs (basil, cilantro, mint)
200–350
14–20
16–18
Strawberry (CEA fruiting)
300–500
17–25
12–16
Tomato (commercial greenhouse)
400–700
20–35
18–20
Cannabis (vegetative stage)
400–600
25–35
18
Cannabis (flowering stage)
600–1,000
35–55
12
Microgreens
100–250
8–14
12–16
Orchids & floriculture
100–250
10–17
12–1
Data synthesized from Wageningen UR Greenhouse Horticulture, USDA NIFA-funded CEA research, and peer-reviewed journals, including HortScience and Frontiers in Plant Science.
The spectral output of horticultural LED fixtures is not a cosmetic parameter—it is a direct determinant of plant morphology, phytochemical content, and reproductive timing. Key spectral interactions include:
Red Spectrum (620–680 nm):
The primary photosynthetic action band. Peak chlorophyll a and b absorbance occurs at approximately 660–663 nm and 642–645 nm, respectively. High red fraction (>50% of total PAR) drives carbon fixation rates and is the principal component of photomorphogenetic flowering induction in short-day plants.
Blue Spectrum (400–500 nm):
Cryptochrome and phototropin receptor activation. Blue light exposure (optimal at 430–450 nm) regulates stomatal aperture, chloroplast movement, and compact morphology. A minimum blue fraction of 10–20% is agronomically necessary in most crops to prevent etiolation. Leafy greens under elevated blue fractions (20–30%) exhibit increased leaf thickness and enhanced anthocyanin accumulation.
Far-Red (700–800 nm):
When delivered in combination with red, far-red photons drive the Emerson Enhancement Effect, increasing the quantum yield of photosynthesis. Supplemental far-red (730 nm) also accelerates phytochrome conversion to Pr form, manipulating day-length perception. In greenhouse tomato production, targeted far-red supplementation at end-of-day (EOD) has been documented to increase internode elongation and accelerate truss development.
Green (500–600 nm):
Contrary to early assumptions, green photons penetrate the lower canopy more effectively than red or blue due to lower chlorophyll absorbance, contributing meaningfully to whole-canopy photosynthesis in dense crop stands.
UV-A (315–400 nm):
Targeted UV-A supplementation (365–385 nm) has demonstrated increases in secondary metabolite accumulation—specifically flavonoids, anthocyanins, and terpenes—in high-value crops including cannabis, basil, and leafy salad crops. UV-A dosing requires careful control due to potential cellular stress at elevated intensities.
Full-Spectrum vs. Fixed-Ratio vs. Tunable LED Configurations
Fixture spectral architecture falls into three principal categories relevant to commercial procurement:
Configuration
Description
Best Application
Fixed-ratio broad spectrum
White phosphor + supplemental red/blue at fixed ratio; simple BOM
Multi-crop production with stable species mix
Fixed-ratio custom spectrum
Engineered LED chip array at defined R:B:G ratio; no phosphor conversion losses
Single-species optimized production at scale
Tunable multi-channel
Independently controllable R, B, W, FR channels; typically 2–4 channel control
Research facilities, multi-stage nursery-to-harvest, premium CEA
Custom fixed-ratio and tunable configurations represent the majority of large-format procurement inquiries at the industrial manufacturer level, as commercial greenhouse operators are willing to accept a higher per-unit acquisition cost in exchange for documented yield improvement over a multi-year TCO horizon.
Facility Classification & System Design Frameworks
Taxonomy of CEA Facility Types
The physical and environmental characteristics of a CEA facility fundamentally determine the appropriate lighting architecture, fixture form factor, mounting configuration, and IP protection class. The following classification framework is used by commercial greenhouse engineering contractors and system integrators globally:
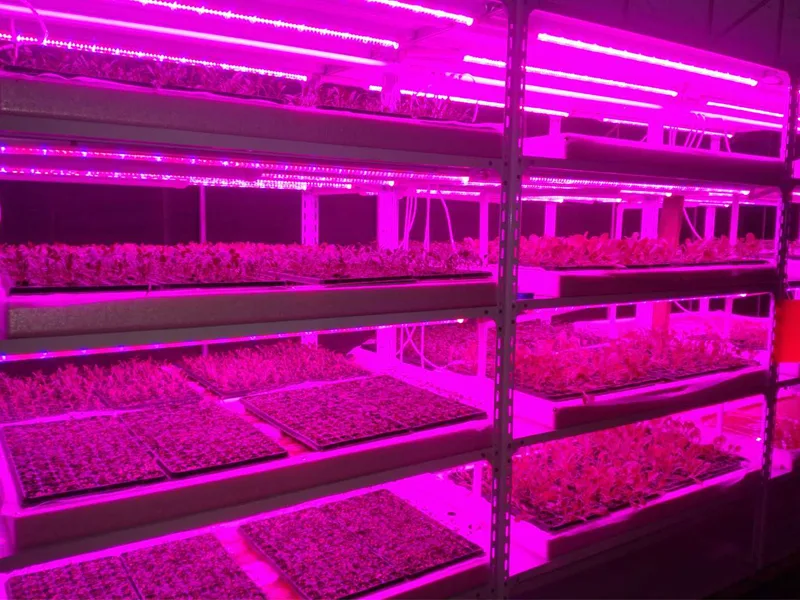
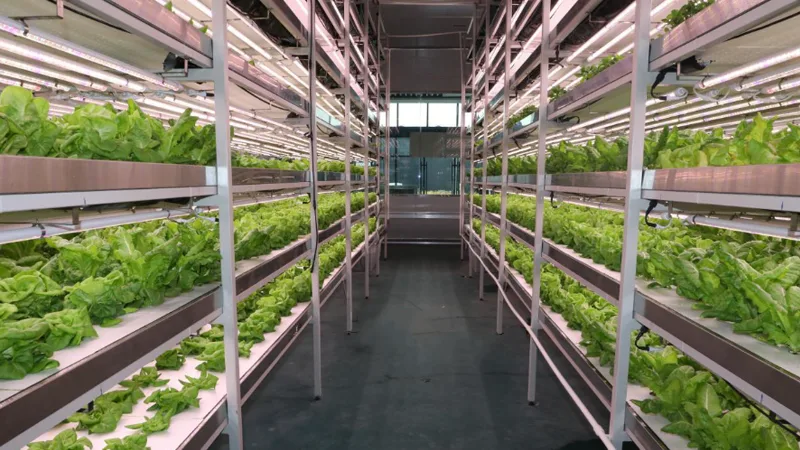
Type A: Multi-Tier Indoor Vertical Farm (Fully Enclosed, No Sunlight)
Light source: 100% artificial (LED fixtures as sole photon source)
Typical structure: Converted warehouse or purpose-built facility, 4–20 growing tiers, 60–120 cm inter-tier clearance
Fixture requirements: Compact low-profile form factor, uniform PPFD distribution across narrow shelf width (0.4–1.5 m), high PPE essential due to total reliance on artificial light, minimal heat emission per tier to reduce HVAC load
Recommended PPFD uniformity (U): ≥ 0.85
Typical installed wattage: 100–350 W/m² of growing area
Type B: Commercial Glasshouse / Polycarbonate Greenhouse (Supplemental Lighting)
Light source: Natural sunlight as primary + LED as supplemental (especially in winter and high-latitude geographies above 45°N)
Typical structure: Venlo-type or wide-span glass greenhouse, 4–8 m internal height, single-layer growing surface
Fixture requirements: High PPF output for top-lighting, wide beam angle (100–150° typical) for uniform canopy coverage at 4–6 m mounting height, IP66 protection mandatory due to irrigation and condensation exposure
Type D: Container Farm / Shipping Container Grow Unit
Light source: 100% artificial
Typical structure: Repurposed or purpose-built ISO container (20 ft or 40 ft), 2–3 tiers
Fixture requirements: Extremely compact, strip or bar form factor, 24V DC power compatibility, high uniformity in 1.2–2.4 m growing lanes, integrated thermal management
Optical Design Parameters for System Engineering
System designers tasked with specifying lighting installations must address four critical optical parameters before fixture quantity determination:
Mounting Height (MH):
The vertical distance between the fixture emission plane and the canopy. For greenhouse top-lighting, MH typically ranges from 0.5 m (inter-canopy interlighting) to 6 m (ceiling-mounted HPS replacement). Fixture beam angle must be matched to MH to achieve the target PPFD at the canopy level without excessive hotspot formation.
Uniformity Ratio (U = PPFD_min / PPFD_avg):
Professional simulation software (e.g., DIALux, Radiant Zemax, or proprietary tools provided by fixture manufacturers) generates PPFD distribution maps that inform fixture spacing and staggered mounting layouts. For commercial vegetable production, U < 0.70 results in unacceptable yield variation across the canopy.
Fixture Spacing (Center-to-Center Distance):
Determined iteratively through photometric simulation. Generally, tighter spacing at lower mounting heights is required to maintain uniformity, while higher mounting heights allow wider fixture spacing but require higher individual fixture PPF output.
Intercanopy / Interlighting Applications:
In high-wire crops such as tomato, pepper, and cucumber, inter-canopy LED bars (bar-form fixtures inserted between crop rows at mid-canopy height) supplement top-lighting by delivering photons directly to shaded lower leaf tiers. These applications require extremely low-profile fixture geometry, waterproof connectors rated for humid greenhouse environments, and spectral profiles optimized for photosynthesis rather than photomorphogenesis.
Electrical Infrastructure Design Considerations
Commercial lighting systems at the 10,000+ m² scale require coordinated electrical infrastructure design. Key parameters include:
Parameter
Design Target
Notes
Operating Voltage
100–277 VAC (universal) or 200–480 VAC 3-phase
3-phase systems reduce cable cross-section and installation cost at scale
Power Factor (PF)
≥ 0.95 at full load
Required by most commercial grid operators; affects harmonic distortion
Total Harmonic Distortion (THD)
< 10%
Critical for grid stability in large-scale installations
Inrush Current
< 30A peak per fixture
Drives circuit breaker sizing and grouping per circuit
Control System Compatibility
0–10V, PWM, DALI-2, or proprietary smart bus
Must align with greenhouse management system (GMS) or building automation system (BAS)
IP Class of Driver Compartment
IP65 minimum; IP66 for wash-down environments
Driven by facility hygiene protocol
Industrial-Grade Product Capabilities from sltmaks.com
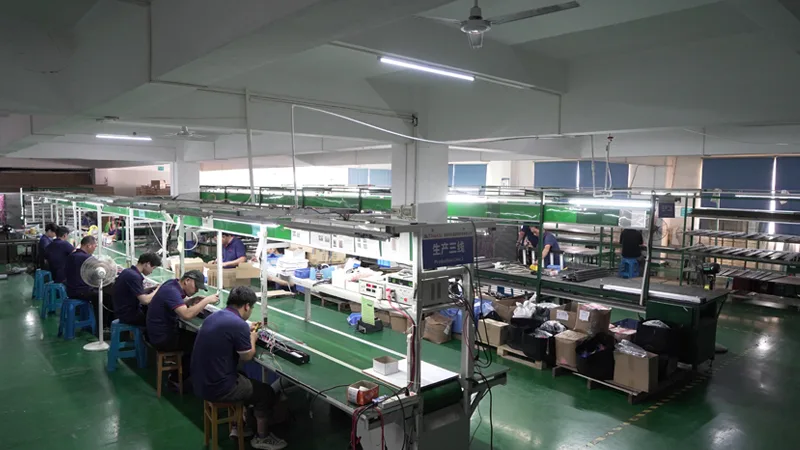
Manufacturing Infrastructure & Supply Chain Position
sltmaks.com operates as an industrial-scale B2B manufacturer within the horticultural LED ecosystem, serving greenhouse engineering contractors, EPC (Engineering, Procurement, and Construction) project companies, wholesale distributors, and large commercial growing operations across North America, Europe, the Middle East, and Asia-Pacific.
The manufacturing model at sltmaks.com is vertically integrated through the key production stages of PCB assembly, LED chip binning and selection, driver integration, housing fabrication, photometric testing, and quality control—positioning the supply chain to offer both standard catalog products and deep-customization engagements from a single manufacturing source. This integration eliminates the coordination overhead and quality-assurance gaps typically associated with multi-supplier procurement models.
For large-volume procurement (typically defined as ≥500 fixture units per SKU), sltmaks.com engages in formal NPI (New Product Introduction) processes that allow commercial greenhouse engineering contractors to specify fixture geometry, spectral output profile, driver type, mounting interface, and IP rating as a coordinated design package.
Photon Efficacy (PPE) Specifications & LED Chip Technology
The core performance differentiation at the industrial fixture level is photon efficacy (PPE), measured in μmol/J. sltmaks.com fixture lines are engineered around LED chip sets from Tier-1 semiconductor manufacturers, selected through a rigorous binning process that prioritizes:
– Spectral consistency across the production batch (Δu’v’ ≤ 0.003 from nominal)
– High wall-plug efficiency at the chip level (> 70% at design operating current)
– Thermal resistance optimization to maintain chip junction temperature below specified design limits across the fixture’s rated operational life
Research CEA, cannabis production, specialty crops
Configurable per spec
PPE in custom spectrum configurations varies with spectral target; far-red-heavy spectra and UV-supplemented spectra carry inherent efficacy trade-offs documented in the product specification sheet.
Custom Spectral Engineering Service
A key differentiator available through sltmaks.com’s B2B manufacturing engagement model is the Custom Spectral Engineering service. This capability allows procurement teams and facility operators to specify:
Target photon ratio between key spectral bands (e.g., R: B = 4:1; 10% far-red; 3% UV-A)
Absolute SPD (Spectral Power Distribution) target, provided as a customer-supplied reference file or generated through sltmaks.com’s application engineering consultation
Multi-channel tunable configurations for facilities requiring dynamic spectrum adjustment across growth stages
Custom spectral work requires a minimum order quantity (MOQ) and a prototype validation phase (typically 6–10 weeks from spectral target confirmation to validated pre-production sample). Commercial greenhouse engineering contractors who engage in this service receive full photometric data packages, including SPD plots, PPFD distribution simulation files, and IES photometric data for integration into facility design software.
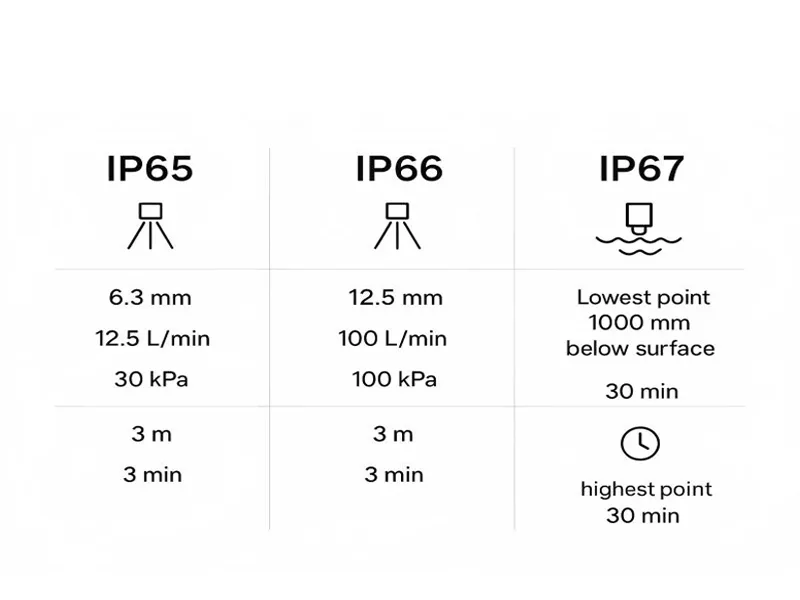
IP Protection Ratings & Environmental Durability
In greenhouse and CEA environments, fixture ingress protection is a non-negotiable performance parameter. Irrigation systems, fogging humidifiers, sanitation wash-down protocols, and high-humidity production environments create persistent moisture exposure conditions that eliminate any fixture not rated to appropriate IP standards.
sltmaks.com industrial product lines are designed and tested to:
IP Rating
Protection Specification
Applicable Facility Type
IP65
Full dust-tight; protected against low-pressure water jets from any direction
Standard greenhouse top-lighting, vertical farm dry zones
IP66
Full dust-tight; protected against high-pressure water jets from any direction
Full dust-tight; protected against temporary immersion up to 1 m / 30 min
Container farms, flood-and-drain hydroponic systems
IP ratings are validated through IEC 60529-compliant testing protocols. Procurement teams may request test certificates and IPX test reports as part of the standard B2B documentation package.
Beyond IP rating, fixture housing construction at sltmaks.com uses die-cast aluminum alloy bodies with passivated surface treatments or powder-coat finishes rated to ASTM B117 salt-spray resistance standards, ensuring corrosion resistance in coastal or high-humidity agricultural environments.
Driver Architecture & Control Signal Compatibility
The LED driver is the fixture subsystem most frequently overlooked in procurement specifications and most frequently responsible for early-life field failures. sltmaks.com driver selection and integration protocols specify:
Operating Temperature Range: −20°C to +45°C ambient (driver compartment), ensuring reliable cold-start in northern greenhouse facilities
Power Factor: ≥ 0.95 at all loads above 25% rated power
Dimming Protocol: 0–10V analog standard; DALI-2 (IEC 62386-209) available on professional series
Dimming Range: 0–100% light output with ≥5% intensity floor without flicker artifact (Pst LM < 1.0 per IEC TR 61547-1)
MTBF (Driver): ≥ 100,000 hours at Tc = 75°C per MIL-HDBK-217F prediction methodology
For wholesale distributors sourcing driver-configurable fixture platforms, sltmaks.com offers driver-swap flexibility within standard housing architectures, allowing regional adaptation to 120V/60Hz North American grid standards and 220–240V/50Hz European or Asian markets without housing redesign.
Thermal Management Design
Photon efficacy is a function of LED chip junction temperature. As junction temperature increases, both luminous efficacy and spectral output shift. Fixture thermal management is therefore a direct determinant of delivered PPE in field conditions.
sltmaks.com fixture thermal design criteria:
– Maximum LED junction temperature (Tj_max): ≤ 85°C at maximum rated ambient (Ta = 40°C)
– Thermal resistance junction-to-case (Rj_c): ≤ 0.3°C/W per LED package
– Heat sink thermal resistance (Rc_a): Optimized per fixture geometry through CFD simulation
– Fin geometry: Extruded aluminum micro-fin arrays, no painted surfaces on heat transfer surfaces
These parameters translate to L90 flux maintenance ratings of 54,000–60,000 hours in standard product lines, validated through LM-80 and TM-21 projection methodology per IES standards.
Successful large-scale horticultural LED installations require systematic pre-installation site assessment. The checklist below covers the critical engineering review items that professional greenhouse engineering contractors address before fixture specification finalization:
Assessment Area |
Key Parameters to Verify
Structural Load Capacity
Maximum allowable suspended load per rafter (kg/m²); fixture weight with mounting hardware
Electrical Service Capacity
Available amperage per panel; circuit grouping for dimming control zone segmentation
Emergency Power / UPS
Confirm UPS coverage for dimming controller; critical in 24-hr flowering stage operations
Ceiling / Rafter Height
Confirmed MH at canopy level; impacts beam angle selection and fixture quantity
Humidity & Chemical Environment
Identify sanitization chemicals used (chlorine, H₂O₂, peracetic acid); verify housing material compatibility
Thermal Load Integration
Calculate additional HVAC capacity required based on fixture wattage and sensible heat fraction
Control System Interface
Identify existing GMS brand and protocol; confirm 0–10V or DALI signal availability
Mounting Configurations & Fixture Geometry
Commercial greenhouse and vertical farm installations employ three primary mounting paradigms:
Overhead Top-Lighting (Fixed or Adjustable Rail):
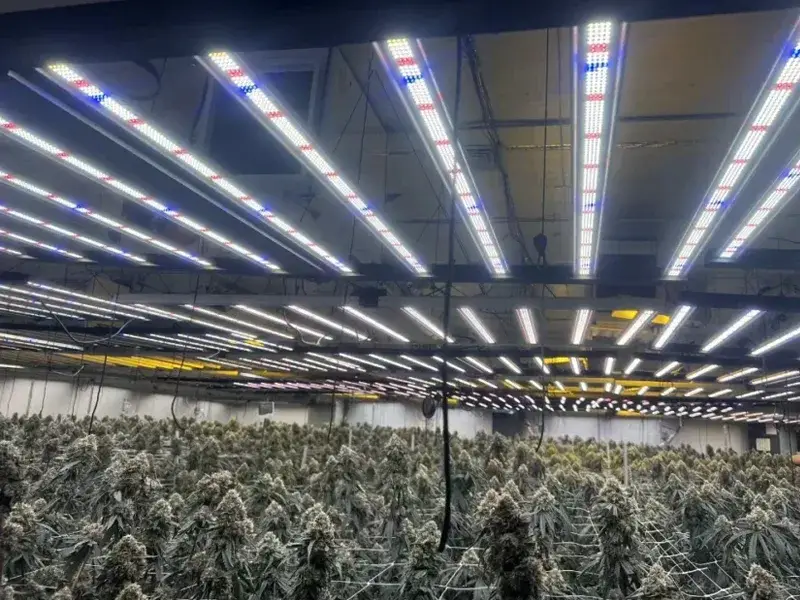
Fixtures suspended from ridge purlins or purpose-installed lighting rails at a fixed height above the crop canopy. Adjustable-height rail systems (motorized in premium installations) allow canopy distance to track crop growth stage. This is the dominant configuration in Venlo glass greenhouse tomato and pepper production.
Intercanopy / Interlighting (Horizontal Bar Integration):
Strip or bar fixtures (typically 0.6–1.5 m in length, 30–80 W) suspended horizontally within the crop canopy at 0.3–1.0 m above ground, between crop rows in high-wire systems. Requires IP66 protection and flexible interconnect cabling systems with tool-free connector systems for rapid reconfiguration as crops cycle.
Vertical Side-Lighting (Wall-Mounted or Vertical Rail):
Applied in certain high-value vertical farm configurations to illuminate the outer canopy faces of multi-tier systems. Less common in mainstream commercial applications but used in specialized strawberry, herb, and cannabis vertical configurations.
Dimming System Architecture & Greenhouse Management Integration
Modern commercial CEA facilities employ centralized greenhouse management systems (GMS) or building automation systems (BAS) that integrate environmental monitoring (temperature, humidity, CO₂, external PAR sensor) with lighting control to execute automated lighting recipes.
The integration pathway for LED fixtures in these systems follows a standardized architecture:
External PAR Sensor → GMS Controller → Dimming Signal (0–10V or DALI-2) → Fixture Driver → LED Output
DLI-Based Automated Dimming (Solar Integration):
In supplemental lighting greenhouses, the most energy-efficient operating protocol uses real-time external PAR measurement to modulate artificial PPFD supplementation, maintaining a setpoint DLI accumulation rate. On high-insolation days, artificial lighting dims to 10–20%; on overcast winter days, fixtures operate at 80–100% rated output. This protocol can reduce annual electrical consumption by 25–40% compared to fixed-output operation, with proportional energy cost savings.
Photoperiod Extension / Night Interruption:
In photoperiod-sensitive crops (chrysanthemum, strawberry, cannabis), precise control of the light/dark cycle is critical. GMS timer-based relay control or DALI scene programming manages this transition with ≤30-second ramp rates to avoid plant stress response.
Lighting Zones & Independent Circuit Segmentation:
Large greenhouse facilities are divided into lighting control zones, each independently addressable, to accommodate differential crop stages, trials management, or graduated production schedules. Standard practice is 50–500 m² per control zone, depending on facility scale and crop management granularity.
Commissioning & Photometric Verification
Upon installation completion, professional commissioning includes PPFD field verification using calibrated quantum sensors (cosine-corrected, PAR-corrected photodiodes; calibration traceable to NIST or equivalent national metrology institute). Measurement protocol follows the ANSI/ASABE standard grid measurement approach, with data recorded at a defined grid density (typically 0.25–1.0 m resolution).
Verification deliverables from a professional commissioning process include:
– PPFD grid map (actual field measurement)
– Uniformity ratio (U = PPFD_min / PPFD_avg) per zone
– Power consumption verification (kW per zone at 100% output)
– Dimming curve verification (PPFD vs. control signal voltage or DALI level)
– Thermal performance spot-check (fixture surface temperature at Tsteady_state)
Preventive Maintenance & Lifecycle Management
Industrial LED grow light systems require structured preventive maintenance protocols to maintain photon output through the rated operational life:
Digital addressable lighting control protocol standard
ANSI/ASABE S640
American Society of Agricultural and Biological Engineers
Recommended PPFD measurement methodology for horticultural lighting
UL 8800
UL Standards
North American safety standard for horticultural lighting equipment
CE Marking (LVD + EMC)
European Commission
European market access requirements for electrical equipment
RoHS Directive
European Commission
Restriction of hazardous substances in electrical and electronic equipment
Closing Notes for Engineering Procurement Teams
The selection of horticultural LED infrastructure at the commercial scale is a multi-variable engineering decision that spans agronomic science, electrical engineering, facility architecture, and financial modeling. The data frameworks, spectral selection criteria, facility classification models, and maintenance protocols presented in this reference are intended to support rigorous procurement decision-making rather than replace project-specific engineering analysis.
Commercial greenhouse engineering contractors and large-scale indoor farm development teams requiring facility-specific photometric simulations, spectral consultation, custom fixture specification packages, IP certification documentation, or volume pricing engagement are directed to the technical inquiry channel at sltmaks.com.
All product performance data discussed in this article is subject to final specification in product data sheets and project-specific application engineering documentation. Independent verification of fixture performance through IES LM-79 accredited test reports is standard practice and available upon request for all sltmaks.com product lines.
All technical data presented represents general industry benchmarks and sltmaks.com product line ranges. Project-specific performance is governed by executed product specifications and formal quotation documentation.
FAQ
Why is Photosynthetic Photon Efficacy (PPE) the primary metric for ROI in vertical farming?
Photon Efficacy ($PPE$, measured in $u005cmu mol/J$) dictates how efficiently electrical energy is converted into light usable for photosynthesis. In fully enclosed vertical farms, lighting represents u003cstrongu003e25–40%u003c/strongu003e of total operational costs. High-PPE systems (e.g., $3.4–3.7 u005cmu mol/J$) reduce HVAC heat loads by u003cstrongu003e30–45%u003c/strongu003e compared to HPS, typically offering a payback period of u003cstrongu003e1.8 to 3.2 yearsu003c/strongu003e, significantly faster than standard LED or legacy lighting.
What are the standard PPFD and Daily Light Integral (DLI) targets for different crop categories?
Agronomic requirements vary significantly by species. Based on industry standards:u003cbru003eu003cstrongu003e · Leafy Greens (Lettuce, Spinach):u003c/strongu003e Target PPFD of $150–300 u005cmu mol/m^2/s$ with a DLI of $12–17 mol/m^2/day$.u003cbru003eu003cstrongu003e · Commercial Tomatoes:u003c/strongu003e Require higher intensity, with PPFD targets of $400–700 u005cmu mol/m^2/s$ and a DLI of $20–35 mol/m^2/day$.u003cbru003eu003cstrongu003eHigh-Value Crops (Cannabis Flowering):u003c/strongu003e Demand extreme intensity, often u003cstrongu003e ·u003c/strongu003e u003cstrongu003e ·u003c/strongu003e u003cstrongu003e ·u003c/strongu003e exceeding $600–1,000 u005cmu mol/m^2/s$ to drive secondary metabolite production.
How does u0022Custom Spectral Engineeringu0022 benefit large-scale commercial operations?
This B2B service allows operators to move beyond u0022one-size-fits-allu0022 lighting. By adjusting ratios of u003cstrongu003eRed (660nm)u003c/strongu003e for photosynthesis, u003cstrongu003eBlue (450nm)u003c/strongu003e for compact morphology, and u003cstrongu003eFar-Red (730nm)u003c/strongu003e for the Emerson Enhancement Effect, growers can manipulate specific plant traits. This includes increasing anthocyanin levels in lettuce, accelerating truss development in tomatoes, or boosting terpene profiles in medicinal crops, directly impacting market value.
How should facility managers plan for the lifecycle maintenance and replacement of LED systems?
Industrial LED maintenance follows the u003cstrongu003eL90 metricu003c/strongu003e (the time until the fixture reaches 90% of its initial output).u003cbru003eu003cstrongu003e· Monitoring:u003c/strongu003e Managers should perform PPFD spot-checks every 6 months and a full grid re-measurement every 2–3 years.u003cbru003eu003cstrongu003e· Replacement:u003c/strongu003e High-grade fixtures are usually rated for u003cstrongu003e54,000–60,000 hoursu003c/strongu003e (L90).u003cbru003eu003cstrongu003e· Planning:u003c/strongu003e It is standard practice to initiate procurement for replacement batches once the system reaches u003cstrongu003e70% of its rated L90 hoursu003c/strongu003e to ensure no dip in yield occurs due to light depreciation.