Introduction
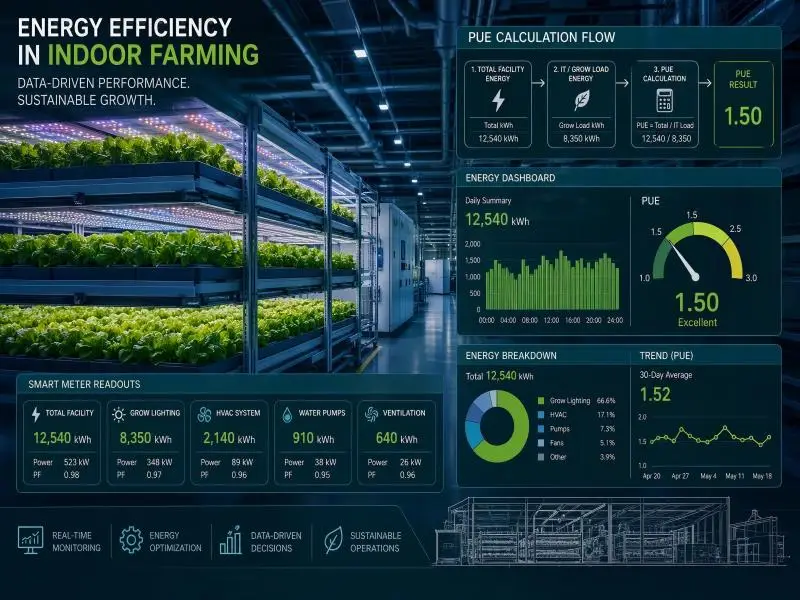
Electricity is the largest controllable operating cost in commercial horticulture. With lighting alone consuming 55 to 80% of what a facility draws, and HVAC climbing right behind it, establishing a reliable energy-efficiency benchmark is critical rather than just a one-off audit figure. That makes mastering the indoor farm PUE calculation essential for operators looking to track overhead month after month.
Power Usage Effectiveness (PUE) gives you exactly that. The metric started in data centers, where The Green Grid defined it as total facility energy divided by IT equipment energy in its comprehensive examination of the PUE metric. The same logic transfers to controlled environment agriculture: you divide everything the facility draws by the energy that actually grows crops. The result tells you how much overhead you burn for every kilowatt-hour of productive work.
This guide walks you through the calculation end to end. You will define PUE for an indoor farm, draw a defensible system boundary, build a metering and submetering plan, run a 30-day example, and pair the result with companion KPIs so the number drives real decisions.
Define PUE for Indoor Farms
Formal Definition and Formula
PUE is a dimensionless ratio. Written plainly, it is:
PUE = Total facility energy ÷ Core production-load energy
In a data center, the denominator is the compute load. In an indoor farm, you redefine it as the energy consumed by the systems that directly produce yield: lighting, climate control for crop health, irrigation, and air movement. Everything else, from office equipment to dehumidifier heat rejected outside the growing volume, sits in the numerator alongside the main meter.
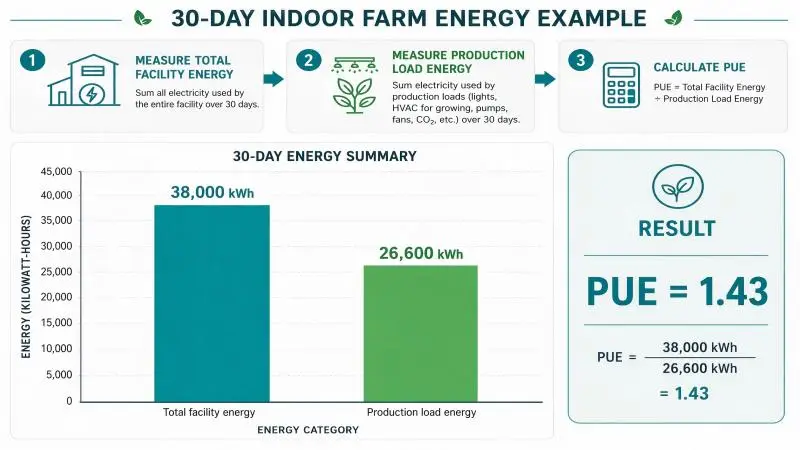
For example, if a facility draws 38,000 kWh in a month and 26,600 kWh goes to production systems, the PUE is 38,000 ÷ 26,600, or about 1.43. A result of 1.43 means the farm burns 0.43 kWh of overhead for every 1 kWh of production energy.
A PUE of 1.00 is a theoretical perfect score where every watt does useful crop work. Real farms sit above that because conversion losses, HVAC, and support loads are unavoidable.
Useful Load Redefined as Production Systems
The central design decision is which loads count as “production.” Because PUE was built for data centers, applying it to agriculture without definition invites confusion. You have three defensible choices, and you must state which one you use:
- Narrow: lighting only. Highest PUE, but hides the fact that HVAC exists to serve crops.
- Moderate (recommended): lighting plus HVAC/dehumidification, irrigation, and air movement. This is the closest analog to “IT load” because these systems exist solely to grow product.
- Broad: every load that scales with production, including trimming, packing, and cold storage.
The moderate definition is the most useful for cross-site comparison because it captures the two dominant energy consumers, lighting and HVAC, while excluding office and tenant loads that vary independently of yield. Whatever you choose, document it. Comparing a lighting-only PUE against an HVAC-inclusive PUE is meaningless.
Measurement Period and Reporting Window
Choose a reporting window with a full production cycle. A calendar month is the practical minimum, and a quarter better captures seasonal HVAC swings and crop-stage changes. Match the numerator and denominator over the same period and timestamps, or the ratio loses meaning.
Set System Boundary and Components
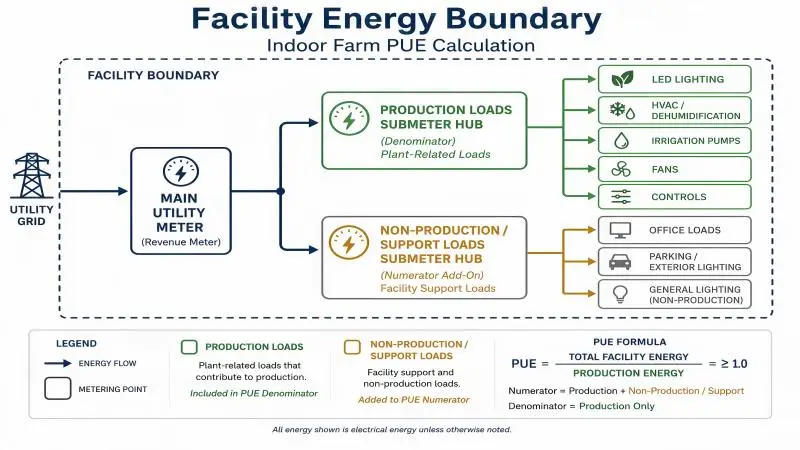
Facility Boundary and Energy Sources
Draw a box around your facility and decide what enters it. Start with the main utility meter at the service entrance. Add any on-site generation such as solar or cogeneration that feeds farm loads. Decide up front how you treat sources like natural gas for heating or backup generators, and record that rule. A PUE computed from electricity alone is not directly comparable to one that includes gas heat, so note your boundary in every report.
Denominator: Production Equipment list
Build a named list of equipment that counts as production load. A typical list covers:
- LED grow lights and their drivers
- HVAC and dehumidification dedicated to grow rooms
- Drip or recirculating irrigation pumps
- Supply and exhaust fans for the canopy
- Environmental controllers and sensor networks
The list should map one-to-one to submeters so you can add the measured energy without estimating. If two systems share a circuit, note it; you will need an allocation rule.
Numerator: Total Facility Energy Coverage
The numerator must capture everything on the facility side of the meter, not just the production list. Include general lighting outside grow rooms, office and break-room loads, loading-dock equipment, cold-room compressors, and any tenant or shared spaces. The difference between the numerator and denominator is your overhead, which is exactly what PUE quantifies.
This is also where the plan can break down. Skipping a small shared load is cheap now and confusing later, because your PUE will drift as that load changes. Cover the full meter every cycle.
Build Your Metering and Submetering Plan
Main Meter and Submeter Hierarchy
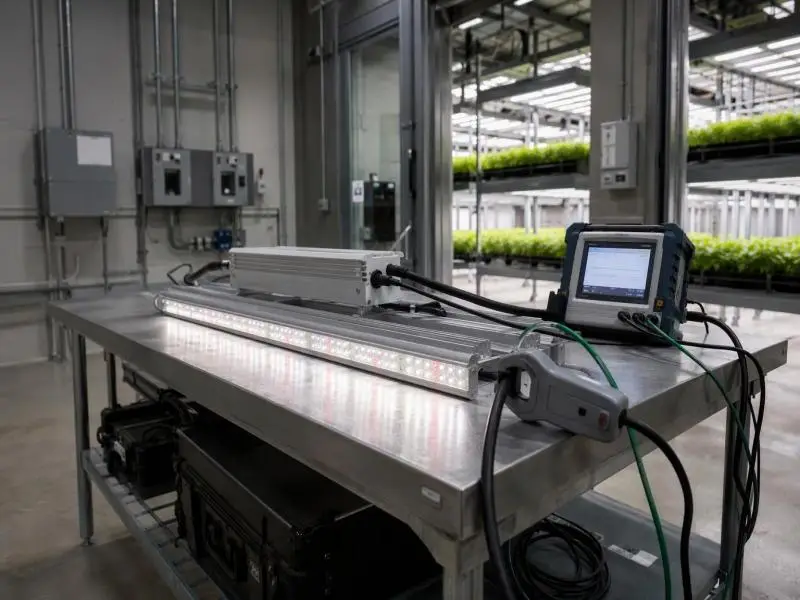
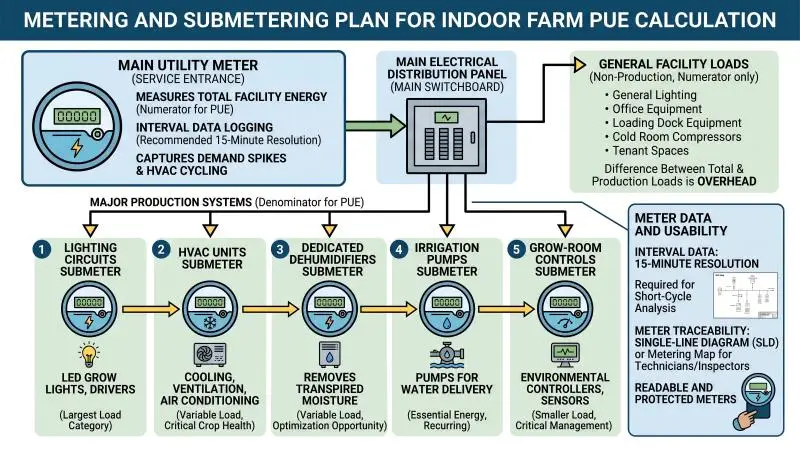
Measure from the top down and the bottom up at the same time. Log the main utility meter, then submeter each major production system. The U.S. Department of Energy’s Metering Best Practices Guide recommends interval data at 15-minute resolution for capturing demand spikes and HVAC cycling. Hourly data works for basic benchmarking but hides short-cycle behavior.
Put submeters on the loads that move the most: lighting circuits, HVAC units, dehumidifiers, irrigation pumps, and grow-room controls. You do not need a meter on every branch circuit if those five categories reconstruct your load curve. Prioritize the largest and most variable loads first, because they drive most of the cost and most of the optimization opportunity.
Keep every meter readable, protected from damage, and mapped on a single-line diagram or metering map so a technician or an inspector can trace the facility without guesswork.
Mixed-use HVAC Allocation Methods
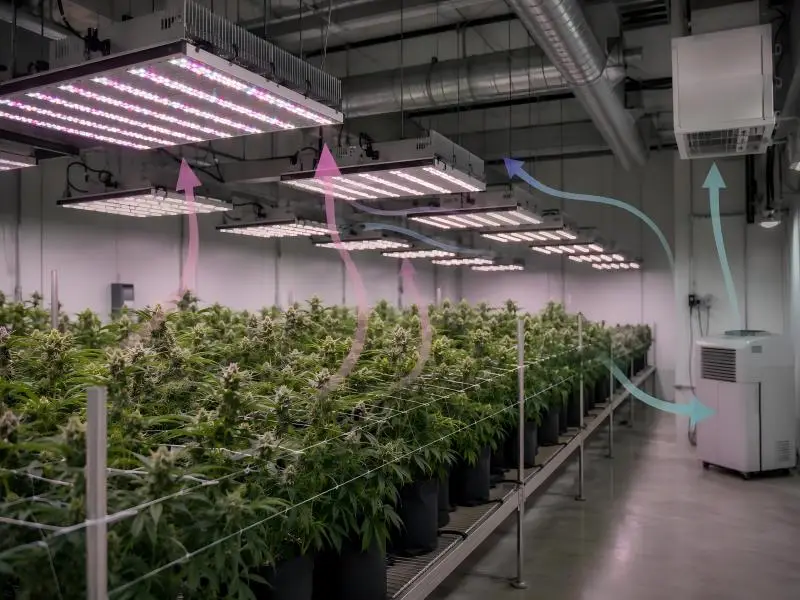
HVAC is the hardest load to assign because one unit often serves cooling, dehumidification, and ventilation. Dedicated submetering is the cleanest answer, but it is not always possible. When it is not, use an engineering model that splits the HVAC meter by function:
- sensible cooling load from grow lights and envelope
- latent load from plant transpiration and infiltration
- outdoor-air ventilation
- reheat or heating energy
Estimate the shares, document the assumptions, and revisit them when plant density or lighting changes. The goal is a consistent, auditable allocation rather than a silently shifting one.
Data Quality, Calibration, and Documentation
Calibration is a compliance issue, not just a data issue. Use meters sized for current and future loads so they stay accurate across the operating range. Follow manufacturer calibration schedules and validate against known loads. Check for drift, missing intervals, and impossible values every cycle, and timestamp-sync all meters and sensors so energy lines up with environmental and production data.
This is where an equipment partner’s documentation discipline matters in practice. Specifying certified, safety-compliant fixtures and keeping their datasheets and commissioning records on file makes the audit trail easier to build. Under that umbrella, SLTMAKS documents each commercial grow light with photometric (IES/LDT) files and safety certifications such as ETL, CE, RoHS, and DLC QPL listing, which helps operators pair measured energy data with verified fixture input power and rebate eligibility. The role here is straightforward: known input power and traceable compliance files make your metering plan and your PUE calculation more defensible, because every kilowatt-hour in the denominator can be tied to a documented piece of equipment.
Run a 30-day Calculation Example
Gather Interval Data and Totals
Pick one month with a full crop stage and pull both numbers. From the main meter, record total facility energy. From the submeters, sum the production-equipment list for the same dates.
Compute indoor farm PUE calculation
Take a worked case over 30 days:
| Load category | Energy (kWh) |
|---|---|
| Total facility energy (main meter) | 38,000 |
| LED lighting | 21,000 |
| HVAC + dehumidification | 4,000 |
| Irrigation pumps | 600 |
| Fans and controls | 1,000 |
| Production-load energy (denominator) | 26,600 |
Compute the ratio:
PUE = 38,000 ÷ 26,600 ≈ 1.43
The overhead share is 38,000 minus 26,600, or 11,400 kWh. That 1.43 means 43% of your total energy goes to everything that supports production rather than directly growing it.
Record Allocations and Assumptions
Write down every choice that made the number what it is: the denominator definition, the HVAC allocation method, which loads landed in the numerator, and the reporting window. Replicate the exact same method next month. PUE is most useful as a trend line. If you change the boundary midstream, the number jumps and tells you nothing about real performance.
Interpret Results with Companion KPIs
Pair PUE with kWh Per kg
A single PUE can mislead, because it says nothing about how much crop you produced. Pair it with specific energy use expressed in kWh per kg of sellable produce. A peer-reviewed benchmarking review of energy efficiency in vertical farming puts well-run leafy-green facilities at roughly 10 to 18 kWh per kg, while older or less optimized sites can far exceed that. Tracking both tells you whether a low PUE comes from efficient support systems or simply from low output.
Yield Per kWh and Canopy Metrics
Invert kWh per kg to get yield per kWh, often quoted as g/kWh or kg/kWh. At 14 kWh/kg, for example, the farm produces about 71 g/kWh. Pair that with yield intensity in kg per square meter of canopy per cycle so you can see whether strong output is efficiency or just high energy input. In lighting-forward farms, also track grow light efficacy μmol/J versus actual yield per watt so you separate fixture-level efficiency from whole-facility efficiency.
Benchmark Ranges and Comparison Cautions
Beware comparing PUE across facilities. There is no universal PUE standard for agriculture the way there is for data centers, so a different denominator definition automatically breaks the comparison. Compare only when the boundary, HVAC allocation, and reporting window match. Use PUE for your own month-over-month trend and reserve kWh per kg and yield per kWh for cross-site or industry benchmarking, since those tie energy to real output.
Pitfalls, Compliance, and Incentives
Common Mistakes to Avoid
- Changing the denominator halfway through a trend line.
- Forgetting a shared load, which silently inflates PUE as that load grows.
- Comparing PUE across facilities with different boundaries.
- Relying on PUE alone without a crop-output KPI like kWh per kg.
- Skipping calibration, which turns every downstream calculation into guesswork.
Safety, Standards, and Inspection Readiness
A PUE program leans on the same documentation an auditor wants. Keep a metering map, calibration records, equipment datasheets, and interval data organized by cycle. Frameworks such as ISO 50001 ask for an energy policy, a baseline with a documented method, sub-meter registers, and monitoring data, all of which align with what a sound PUE process already produces. For lighting in particular, certified and listing-compliant fixtures make the inspection story cleaner, and how grow-light heat load drives HVAC demand is a reference worth folding into your energy and safety reviews.
Utility Incentives and Audit-ready Files
Energy efficiency programs reward what you can measure. Utilities such as Black Hills Energy’s Indoor Agriculture program and Pacific Power’s Wattsmart business stream offer prescriptive and custom rebates for high-efficiency lighting, HVAC, dehumidifiers, pumps, and controls, often calculated on measured kilowatt-hours saved. USDA’s REAP program can support eligible agricultural efficiency projects with grants and loan guarantees.
Most programs require proof: 2 to 3 years of utility data, measure-by-measure savings calculations, installation and commissioning records, and photos. A credible PUE baseline gives you a head start because the measurement infrastructure and documentation already exist. For lighting upgrades specifically, DLC-listed fixtures and utility rebate qualification frequently go together, so checking the listing before you buy reduces both compliance and payback risk.
FAQ
What is a good PUE value for an indoor farm?
A PUE of 1.00 is the theoretical floor where every watt does useful crop work. In practice, well-run indoor farms with efficient LED lighting and modern HVAC tend to land between 1.20 and 1.50 under the moderate denominator definition. Above 1.60, the farm is carrying noticeably heavier overhead, and that number often signals wasted heat rejection, oversized support equipment, or load that got misclassified. Because there is no universal PUE standard for agriculture, the most useful target is a trend you lower over time rather than a fixed industry benchmark.
Does a lower PUE always mean a more efficient farm?
Not necessarily. PUE only measures how much overhead sits around your production load; it says nothing about how much crop that load actually produced. A facility running at a stellar PUE but wasting light on an inefficient spectrum can still deliver poor yield per kWh. Pair PUE with kWh per kg or yield per kWh so an efficiency win on paper doesn’t hide a productivity problem in the grow room.
Is HPS or LED better for lowering the PUE calculation?
LED fixtures generally convert far more input power into photosynthetically active light and reject less heat, which cuts both the lighting draw and the HVAC load needed to remove that heat. Because HVAC is one of the two dominant energy consumers, switching from HPS to high-efficiency LED tends to pull PUE down from both the numerator and denominator sides. Traceable input-power data, such as the photometric and compliance files SLTMAKS publishes for its grow lights, makes that before-and-after comparison defensible.
How often should I calculate PUE?
Calculate it once to establish a baseline, then review it monthly so you catch drift while it is still cheap to diagnose. Because HVAC swings with the seasons and crop-stage changes shift lighting demand, a full-year trend is more telling than any single month. Match the numerator and denominator over identical dates every cycle, or the ratio loses meaning.
Can I compare my PUE with another farm’s?
Only when the boundary, denominator definition, HVAC allocation method, and reporting window all match. Compared a lighting-only PUE from one farm against an HVAC-inclusive PUE from another is meaningless. Where PUE works best is tracking your own month-over-month trend; reserve kWh per kg and yield per kWh for cross-site and industry benchmarking because those tie energy to actual output.
How do I handle a dehumidifier or HVAC unit that serves both growing and non-growing spaces?
A mixed-use unit is the hardest load to assign. Dedicated submetering is the cleanest answer, but when that isn’t possible, build an engineering model that splits the meter by function: sensible cooling from lights and envelope, latent load from plant transpiration, outdoor-air ventilation, and reheat or heating energy. Estimate the shares, write down the assumptions, and revisit them whenever plant density or lighting changes so the allocation stays auditable rather than silently drifting.
Do I need a submeter on every circuit to compute PUE?
No. You only need enough submetering to reconstruct the production-load total: lighting circuits, HVAC units, dehumidifiers, irrigation pumps, and grow-room controls. If those five categories characterize your load curve, you can compute the denominator without a meter on every branch circuit. Prioritize the largest and most variable loads first, because they drive most of the cost and most of the optimization opportunity.
Conclusion
PUE gives indoor farms a consistent, repeatable way to see how much energy the facility spends to grow a crop. The value comes from doing it the same way every cycle: a fixed boundary, a documented production-load list, a submetering plan with calibrated meters, and a trend line you review monthly. When you pair PUE with kWh per kg and yield per kWh, the ratio stops being an abstraction and becomes a management lever.
Start with one month of clean data. Set your boundary, install or confirm the meters, and run the calculation once. Then standardize that method across every site you operate so you can compare facilities against themselves and against your own best rooms. The next step is making measurement a habit, then letting the trend point to where the savings live.
Next, decide on your reporting cadence and get buy-in from the team that owns the meters. If you are building the metering plan now, define the denominator and equipment list first, and keep the documentation inspection-ready from day one.