A 3.0+ μmol/J fixture is not automatically a good investment. What decides the project is whether you can build a payback figure and a multi-year total cost of ownership (TCO) that survive scrutiny from your finance team, your utility program administrator, and your own head of cultivation. To secure budget approval, commercial operators must carefully evaluate the ROI high efficacy grow lights deliver across both energy consumption and facility-wide operational costs. This guide walks through that build in order: the inputs to collect, a five-step calculation sequence, a fully auditable worked example, and the verification checks that keep a vendor’s efficacy claim from quietly inflating the result.
Two premises govern everything that follows. First, photosynthetic photon efficacy (PPE, in μmol/J) is a fixture-level number measured under specific test conditions — not a property of the diodes inside it, and not a number that transfers between products. Second, energy savings alone rarely decide a lighting project. Demand charges, HVAC interaction, controls wiring, replacement timing, and the conditional nature of incentives routinely move the answer more than the wattage difference does.
Table of Contents
Prerequisites: What You Need Before You Open a Spreadsheet
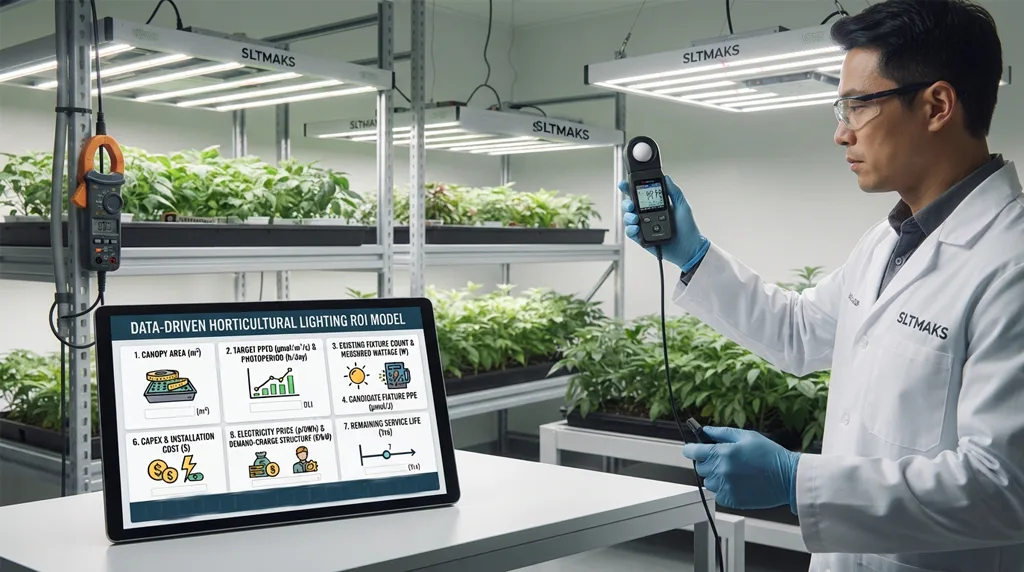
Gather these before any arithmetic. Each entry names the unit and where the number should come from, because a model is only as defensible as its inputs.
- Canopy area (m²). The cultivated area receiving light — benches or trays, not the room’s gross floor area.
- Target PPFD (μmol/m²/s) and photoperiod (h/day). From your crop plan by growth stage. Together they set the daily light integral (DLI) target.
- Current fixture count and measured input wattage (W). Measured at the panel or with a clamp meter, not read off a nameplate that may reflect a different drive setting.
- Candidate fixture PPE (μmol/J). From an ANSI/IES LM-79-19 report on the complete fixture at full, non-dimmed output — the same configuration you are being quoted.
- Delivered electricity price (¢/kWh) and demand-charge structure ($/kW). From your own tariff and recent bills, including the ratchet or billing-demand definition if one applies.
- Capex per fixture and installation cost. Including controls, dimming conductors, and any electrical service work.
- Remaining service life of existing fixtures. So the baseline is credited with the years it would actually have run.
One exclusion matters more than the rest: a bare-board or light-engine PPE rating is not a fixture rating. The DLC’s horticultural technical requirements treat light engines and retrofit kits as ineligible product categories precisely because they are not complete luminaires, and an LM-79 test applies to integrated products rather than to LED packages, modules, or arrays. A board-level μmol/J figure must not enter the model.
Convert Your Light Target into a Photon Budget for ROI High Efficacy Grow Lights
The cultivation target is a quantity of light per square meter per day. Convert it to photons, then to fixtures.
Illustrative arithmetic from PPE = PPF ÷ input power: input power required to deliver a fixed 1,000 µmol/s of photon flux, at each efficacy level. Purely arithmetic — no product is represented, and real fixtures must be sized from an LM-79-19 report at full output.
DLI (mol/m²/day) = PPFD × photoperiod × 3,600 ÷ 1,000,000
Total daily photon demand (mol/day) = DLI × canopy area
Fixture count = total photon demand ÷ (PPE × input wattage × photoperiod × 3,600 ÷ 1,000,000)
The denominator is simply the daily photon output of one fixture: its PPE multiplied by its input wattage gives μmol/s, and multiplying by seconds of operation converts that to moles per day. This is where efficacy does its work. Raise PPE at a fixed wattage, and each fixture delivers more photons per day, so the same DLI arrives with fewer units or with the same units run at lower wattage. That reduction — not the label on the box — is the mechanism behind every energy saving in the model.
Run the calculation for the baseline and the candidate separately, and check that both land on the same DLI. If they do not, you are comparing different lighting programs, and any savings figure that follows is meaningless.
Treat the result as a first-order sizing check. It assumes all emitted photons reach the canopy, which they do not; uniformity, spacing, and spill light are handled later, and the fixture count will usually need to rise once the minimum point in the grid is considered.
Build the Energy and Demand-Cost Baseline
Annual energy (kWh) = fixture input wattage (kW) × fixture count × photoperiod (h/day) × operating days
Annual energy cost = annual kWh × (delivered price in ¢/kWh ÷ 100)
Then add demand charges as a separate line, because they are a separate charge on the bill:
Annual demand cost = peak kW contribution × $/kW × 12
Commercial customers are typically billed for energy in two distinct ways: consumption charges measured in kWh, and demand charges measured in kW based on the highest average demand during a defined interval — often 15 minutes — within the billing period. For many commercial customers, demand charges can account for 30 to 70 percent of the total charges on a monthly bill, and the rate varies considerably by utility, location, and building type. A lighting retrofit that cuts kWh but leaves the monthly peak untouched will capture only part of the available savings; a retrofit that reduces peak kW captures both.
Use your facility’s own tariff. The U.S. Energy Information Administration publishes average commercial prices by month and year — the 2026 year-to-date commercial average was 14.04 ¢/kWh as of the August 2026 data — but that is a national average across many rate structures. Use it as a sanity check on your own figure, never as the input. EIA does not publish utility tariffs or demand-charge data; rate structures are available from your utility’s schedule or from the DOE-sponsored Utility Rate Database.
Add the Cost Lines Buyers Usually Omit
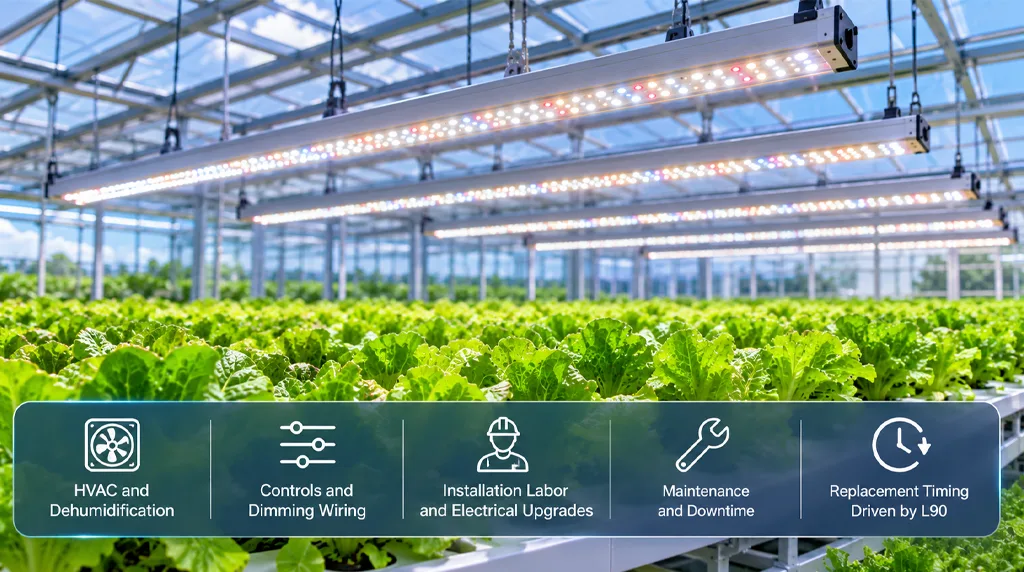
These lines are frequently absent from vendor-supplied savings estimates, and each one belongs in a specific place in the model.
HVAC and dehumidification. LED fixtures emit less radiant heat than high-intensity discharge (HID) lamps, which changes the space’s heat load. In indoor facilities, this can reduce required cooling capacity and operating cost, and in some cases allow equipment downsizing — the Resource Innovation Institute’s CEA lighting guide notes that downsizing HVAC equipment can result in up to 33 percent lower capital costs. But the sign of the effect is site-specific. Greenhouses generally need more heat and may use lighting as a heat source, so a retrofit in a cold climate can increase heating requirements. Model this line explicitly, with the direction stated, rather than assuming a credit.
Controls and dimming wiring. If the fixtures are dimmable but the dimming conductors were not pulled at installation, retrofitting them later is substantially more expensive. The RII guide flags this directly: connect dimming controls when fixtures are installed, because retrofit costs can be substantial. Put the wiring cost in capex, not in a later maintenance line.
Installation labor and electrical upgrades. Hanging hardware, circuit changes, and any service or panel work. Higher-efficacy fixtures may draw less current per unit, but a different fixture count and layout can still require new circuits.
Maintenance and downtime. Driver and fan replacement, cleaning, and the cost of a failed fixture during a production cycle.
Replacement timing driven by L90. L90 is the operating time at which output falls to 90 percent of initial. The DLC’s Hort V4.0 technical requirements set Q90 ≥ 36,000 hours as a required threshold for listed fixtures, alongside a driver lifetime of at least 50,000 hours and a fixture warranty of at least five years. Those are listing thresholds, not predictions for your installation. Schedule replacement from the fixture’s own maintenance data and your operating hours, and note that a fixture running 16 hours a day accumulates 5,840 hours a year — so 36,000 hours is roughly six years of operation, not a decade.
Net Out Capex, Rebates and Incentives Without Assuming Eligibility
Net project cost = gross capex (fixtures + installation + controls + electrical work) − confirmed incentives
“Confirmed” is the operative word. Rebate eligibility typically depends on two things: the fixture appearing on a qualifying list — most commonly the DLC Horticultural Qualified Products List (QPL) — and the local program’s own rules, which may add requirements the QPL does not address. The RII guide is explicit that a DLC-listed fixture does not automatically qualify for rebates and that the efficiency program should be consulted before purchase.
So carry incentives as a separately labeled line, modeled at zero until the program confirms the amount in writing. This is not conservatism for its own sake. A rebate that arrives three months after commissioning does not change the payback your finance team approved, and a rebate that is denied after the purchase order changes it in the wrong direction.
DLC listing is a program-eligibility signal, not a performance guarantee for a specific installation. It tells you the product met a set of technical requirements at the time of listing, tested to specified methods. It does not tell you how the fixture will perform at your mounting height, in your room, over your maintenance cycle.
Calculate Payback and Multi-Year TCO
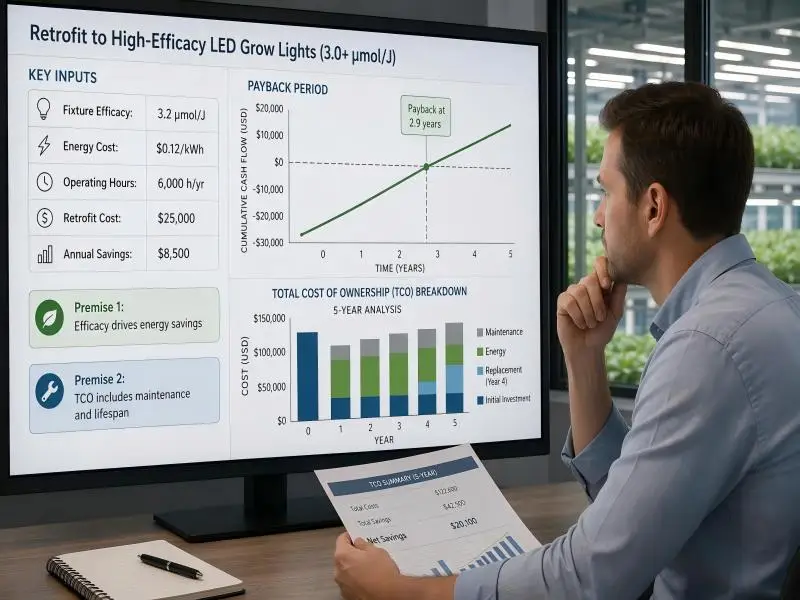
Simple payback (years) = net project cost ÷ annual net savings
where annual net savings = baseline annual energy + demand + HVAC/operating savings − new-fixture annual operating cost.
Multi-year TCO = net capex + Σ (annual energy + demand + maintenance + replacement) over the horizon, discounted at your cost of capital if your organization requires it.
Payback answers “how long until we recover the check.” TCO answers “what does this decision cost us over five or ten years.” They can point in different directions: a cheap fixture with a short payback and a five-year replacement cycle can lose on TCO to an expensive one that runs the full horizon. Present both, and state the horizon explicitly.
One condition governs the comparison: delivered light must be held constant. Same DLI, same canopy area, same photoperiod. A candidate that reaches 25.9 mol/m²/day against a baseline that delivered 22 is not saving energy — it is selling you more light, and the savings figure is an artifact of the mismatch.
Worked Example: A 1,000 m² Retrofit with Stated Assumptions
Every number below is a stated assumption for illustration. Substitute your own; the arithmetic is the point.
Assumptions. Canopy 1,000 m²; target PPFD 600 μmol/m²/s; photoperiod 12 h/day; 350 operating days per year; delivered electricity 14.0 ¢/kWh; demand charge 12/kW/month; baseline HPS at 1.9 μmol/J drawing 1,000 W per fixture; candidate LED at 3.0 μmol/J drawing 720 W per fixture; candidate capex850 per fixture installed, including controls and electrical work; incentive modeled at $0.
Photon budget. DLI = 600 × 12 × 3,600 ÷ 1,000,000 = 25.92 mol/m²/day. Total demand = 25.92 × 1,000 = 25,920 mol/day.
Baseline fixture count. Daily output per fixture = 1.9 × 1,000 W × 12 h × 3,600 ÷ 1,000,000 = 82.08 mol/day. Fixtures = 25,920 ÷ 82.08 = 315.8, rounded to 316. Connected load = 316 × 1.0 kW = 316 kW.
Candidate fixture count. Daily output per fixture = 3.0 × 720 W × 12 h × 3,600 ÷ 1,000,000 = 93.31 mol/day. Fixtures = 25,920 ÷ 93.31 = 277.8, rounded to 278. Connected load = 278 × 0.72 kW = 200.2 kW.
Annual energy and cost. Baseline: 316 kW × 12 h × 350 days = 1,327,200 kWh; at $0.14/kWh = $185,808. Candidate: 200.2 kW × 12 h × 350 days = 840,840 kWh; at $0.14/kWh = $117,718. Energy savings = $68,090 per year.
Demand charges. Assume lighting sets the monthly peak and the reduction flows through in full: baseline 316 kW × 12 × 12 =45,504; candidate 200.2 kW × 12 × 12 =28,829. Demand savings = $16,675 per year. Total annual operating savings = $84,765.
Capex and payback. Gross capex = 278 × $850 = $236,300. Net capex with a zero incentive = $236,300. Simple payback = $236,300 ÷ $84,765 = 2.79 years.
Five-year TCO, undiscounted, excluding HVAC and maintenance. Baseline: 236,300 avoided capex is not spent, but the existing HPS fixtures have remaining life; assume they would have run the full five years with no replacement capex. Operating cost = 5 × (185,808 + $45,504) = $1,156,560. Candidate: capex 236,300 + 5 × (117,718 + $28,829) = $236,300 + $732,735 = $969,035. Five-year advantage to the candidate: $187,525.
What the example shows. The candidate uses 38 fewer fixtures and 116 kW less connected load. The savings are not evenly split: energy is about 80 percent of it, demand about 20 percent. If the facility’s peak is set by something other than lighting — refrigeration, for instance — the demand line shrinks toward zero, and payback stretches toward 3.4 years. That sensitivity belongs in the board pack, not in a footnote.
Verify the Vendor’s 3.0+ μmol/J Claim Before It Enters the Model
A 3.0+ μmol/J claim is a marketing statement until it traces to a test report. Request and check the following.
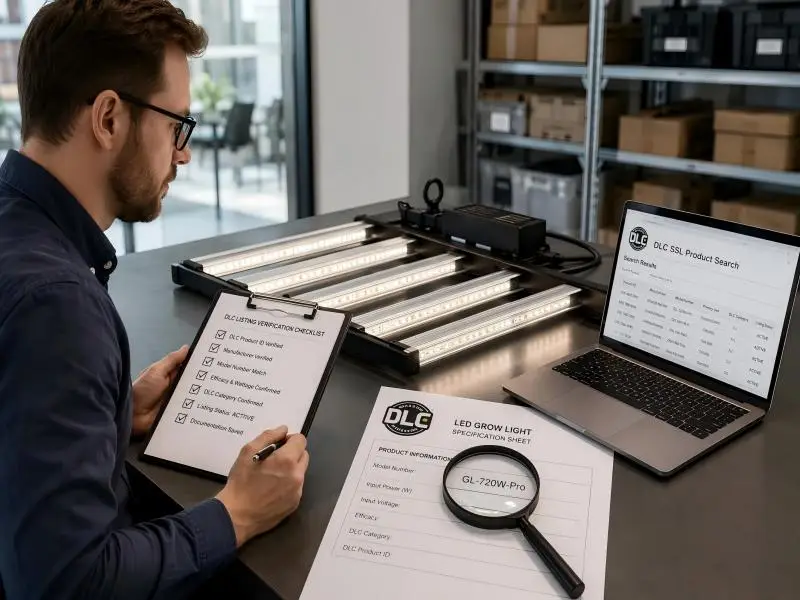
- The ANSI/IES LM-79-19 report itself, in PDF, from a laboratory accredited to ISO 17025 for the relevant test standard. The DLC accepts only LM-79-19 or newer for new applications, and requires testing at full output or non-dimmed state.
- Configuration match. The tested configuration must be the model being quoted, including driver and any options that affect performance. LM-79 reports identify the specific configuration and version tested; compare that against the specification sheet.
- Full-output rating. A dimmed or derated operating point is not the headline efficacy figure.
- Complete-fixture basis. Confirm the rating covers the luminaire, not a bare board or light engine.
- For DC-powered fixtures, check the derating. The DLC lists DC-powered products at their AC-derated PPE. Its own worked example: a 100 W lightbar with a DC PPE of 3.0 μmol/J and a power source at 90 percent worst-case efficiency is listed at 2.7 μmol/J AC-derated PPE and 105 W AC-derated input wattage. If you model the DC figure against AC input wattage, you overstate both photons and savings.
Understand what LM-79 does and does not establish. It provides a snapshot of performance under specified operating conditions, usually at the beginning of operation. It does not address lifetime ratings, changing performance over time, or LED case temperature. Lifetime and maintenance come from separate methods — LM-80 with TM-21 projections, or LM-84 with TM-28 — and even those are projections with stated limits.
A PPE number without a matching test report is unverified. Treat it as a placeholder in the model and flag the payback as provisional until the report arrives.
Equal Wattage Is Not Equal Delivered Light: Handling Uniformity
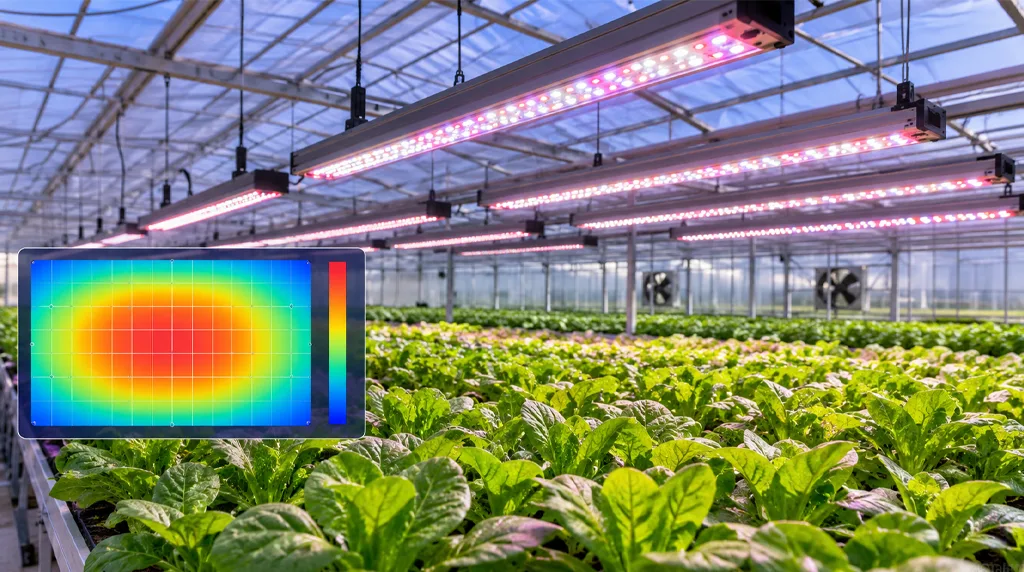
PPE tells you how many photons a fixture produces per joule. It says nothing about where those photons land. Two fixtures drawing identical wattage with identical PPE can deliver very different usable light if one concentrates output under the fixture and the other spreads it evenly across the canopy.
The difference shows up as spill light — light that reaches walls and walkways instead of plants — and as non-uniformity, where the center of the grid is above target and the edges are below it. A higher-efficacy fixture with poor uniformity may need closer spacing or additional units to hit the target at the weakest point, which erodes the savings the efficacy figure promised.
Ask for a PPFD uniformity map or photometric layout at your planned mounting height, covering the full bench area including edges. Then size the fixture count to the minimum PPFD in the grid, not the average. A layout that averages 600 μmol/m²/s but dips to 480 at the bench edge is not a 600 μmol/m²/s design; the crop at the edge will tell you so.
This is also where the first-order sizing check from Step 1 gets corrected. The photon budget assumed every emitted photon reached the canopy. The uniformity map tells you what fraction actually does, and the fixture count rises accordingly.
Compliance Documents: What ETL, CE and RoHS Do and Do Not Tell You
These marks appear on specification sheets and in sales decks, and buyers often treat them as a bundle of performance assurances. They are not.
ETL Listed is a safety certification. It is issued by an OSHA-recognized Nationally Recognized Testing Laboratory (NRTL) after independent testing to the applicable product safety standard, with periodic follow-up inspections. For horticultural lighting, the applicable standard is ANSI/UL 8800, which the DLC requires as the safety certification basis for listed products.
CE marking is a European market declaration. The manufacturer drafts and signs an EU declaration of conformity and affixes the mark; it is a statement of compliance with applicable EU rules, not a third-party performance rating.
RoHS restricts the use of certain hazardous substances in electrical and electronic equipment. It is a materials compliance mark.
None of the three certifies efficacy, spectrum or lifetime. A fixture can be perfectly safe, fully compliant, and mediocre in μmol/J. Conversely, a fixture with an impressive PPE figure and no NRTL listing is a project risk: code officials may enforce special requirements on equipment not rated by a national testing lab. Safety certification is a gating item for the project, not a performance credential — treat it as a pass/fail prerequisite and evaluate performance separately.
Common Mistakes That Break the Model
Each of these moves the answer, and each one belongs at a specific step in the model.
- Using a bare-board PPE as a fixture rating (Step 1, Step 8). Inflates photons per fixture and understates fixture count.
- Comparing fixtures at unequal DLI (Step 1, Step 6). Produces savings that are really a light-level change.
- Ignoring demand charges (Step 2). Understates baseline cost and overstates the retrofit’s share of the savings.
- Treating an unconfirmed rebate as certain (Step 4). Shortens payback on paper and lengthens it in reality.
- Omitting controls wiring and installation labor (Step 3, Step 4). Understates capex, sometimes by a large margin on a retrofit.
- Assuming HVAC savings without checking the heat balance (Step 3). Wrong sign in a greenhouse that uses lighting for heat.
- Scheduling replacement on a generic lifetime (Step 3). Misplaces a major cost line by years in either direction.
Verify Your Result
Run these five checks against the finished model before it goes to decision-makers.
Sensitivity check from the article’s worked example: the candidate fixture’s efficacy is reduced 10 percent, from the claimed 3.0 to 2.7 µmol/J, holding DLI, canopy area, photoperiod, wattage per fixture, and all cost inputs constant. Values are illustrative arithmetic on stated assumptions, not measured performance.
- Does the fixture count reproduce the target DLI at the minimum PPFD point? Not the average — the weakest point in the uniformity map.
- Does the PPE figure trace to a named LM-79-19 report for the exact model and configuration quoted? Including the AC-derated value if the fixture is DC-powered.
- Are demand charges and the omitted cost lines present as separate rows? HVAC, controls wiring, installation, maintenance, replacement.
- Is every incentive conditional? Modeled at zero until confirmed in writing.
- Does the payback change materially if the candidate’s real-world PPE is 10 percent below the claim? In the worked example, dropping the candidate from 3.0 to 2.7 μmol/J raises the fixture count from 278 to about 309 and the connected load from 200.2 kW to 222.5 kW, cutting annual operating savings by roughly 19 percent and stretching payback from 2.79 to about 3.4 years.
If that last test flips the decision, the project is marginal. That does not make it wrong — it makes the sensitivity something decision-makers need to see, alongside the conditions under which the project still clears your hurdle rate.
FAQ
Is a 3.0 µmol/J fixture always better than a 2.7 µmol/J one at a lower price?
No. While higher-efficacy fixtures win on operating cost per unit of delivered light, the actual ROI high efficacy grow lights deliver depends heavily on capex, uniformity, replacement timing, and your investment horizon. A 2.7 µmol/J fixture at a materially lower installed cost with a good uniformity map and a long maintenance interval can win on five-year TCO, particularly if your electricity price is low or your peak demand is not set by lighting. Run both through the same model at the same DLI to compare the true ROI high efficacy grow lights generate in your facility.
How should I treat a fixture whose QPL listing shows a derated AC PPE?
When calculating the ROI high efficacy grow lights provide, always use the derated figure along with the AC-derated input wattage that accompanies it. The DLC lists DC-powered fixtures at their AC-derated PPE, calculated from the worst-case power-source efficiency, and requires those fixtures to meet the PPE threshold at that derated value. Modeling the DC figure against AC input wattage double-counts the loss and distorts your financial projections.
Is DLC listing required for a rebate?
Not universally, and not sufficient on its own. Many efficiency programs use the Horticultural QPL when specifying eligible equipment, and some regional programs offer horticultural lighting rebates that do not require energy modeling. Because utility incentives directly boost the ROI high efficacy grow lights achieve, confirm the exact rules with your program administrator before purchase, as a listed fixture does not automatically qualify.
How do I handle a retrofit where the existing fixtures have years of service left?
To accurately model the ROI high efficacy grow lights offer in an early retrofit, credit the baseline with the years it would actually have run, and place the new capex at the point of actual replacement rather than at the start of the horizon. If the existing fixtures have three years remaining, a five-year TCO comparison that charges the full new capex in year one overstates the retrofit’s cost by the value of three years of deferred spending. Alternatively, model the retrofit as an early replacement and include the residual value of the displaced fixtures as a line item — whichever your finance team prefers, state it.