Engineer the perfect light spectrum for optimal plant growth. Boost your yields and cultivate year-round with our energy-efficient LED solutions. Tell us your needs for a customized lighting strategy and quote.
This process is for commercial indoor cultivation operators who need to design (or re-spec) spectrum intentionally, then prove it works at scale. That means a spectrum choice you can defend to cultivation, facilities, procurement, and whoever signs off on inspections and rebates.
By the end, you will receive a complete custom LED grow light solution. The plan starts with crop light demand (PPFD/DLI), then locks in spectrum guardrails, layout, controls, and thermal integration. The goal is not “the best spectrum.” It’s a spectrum strategy that stays stable when you install it across rooms and sites.
What PPFD, DLI, spectrum, and uniformity mean
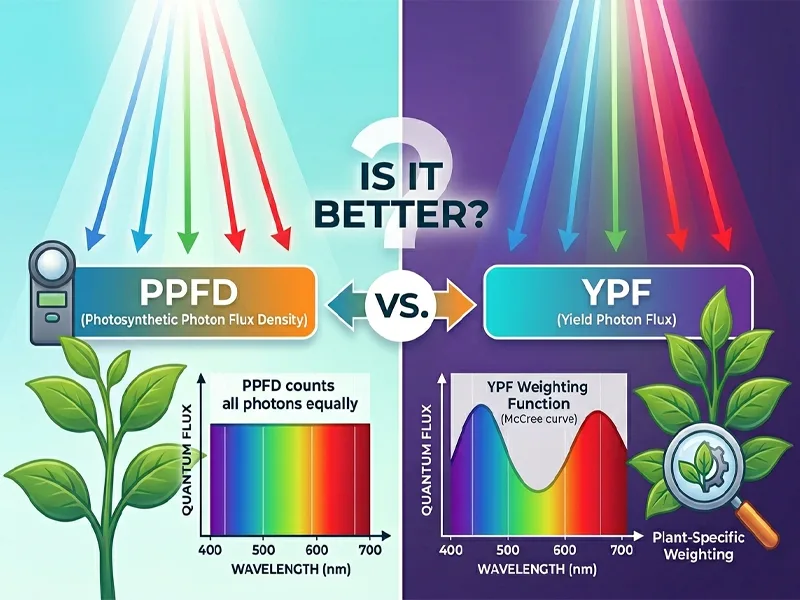
PPFD (photosynthetic photon flux density) is the instantaneous density of photosynthetic photons hitting the canopy, in µmol/m²/s.
DLI (daily light integral) is the total photosynthetic photons delivered over a day, in mol/m²/d. Virginia Tech Extension’s DLI calculation guide (2025) is a solid reference for the unit math and conversions.
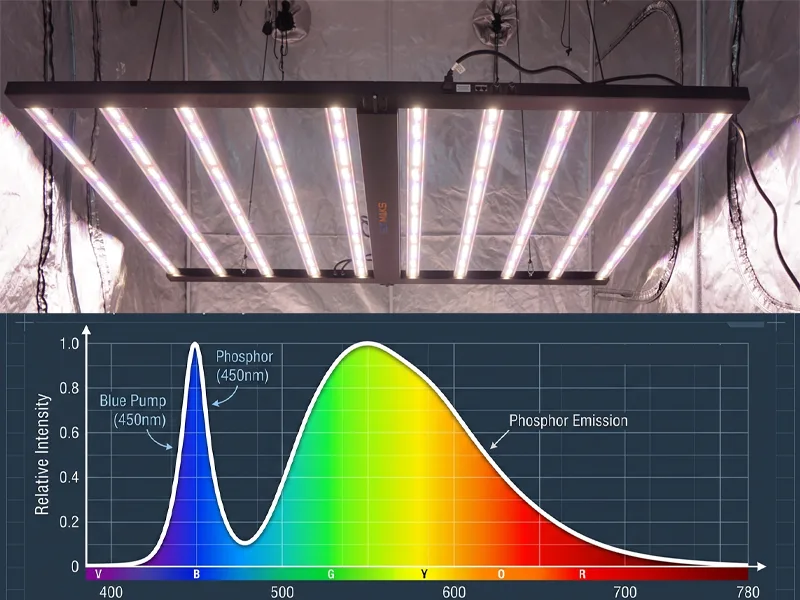
Spectrum is the distribution of photon output by wavelength (what fraction is blue, green, red, far-red, and UV).
Uniformity is how evenly PPFD is delivered across the canopy. Your average PPFD can look “right” while edges or aisles are under-lit, and that variability shows up as uneven morphology and inconsistent finish times.
How to avoid common pitfalls and validate changes
The fastest way to lose time is to change more than one variable at once. If you adjust the spectrum, and also change fixture height, dimming behavior, and photoperiod, you won’t know what actually caused the crop response.
Treat the spectrum as a controlled input, then validate with measurements: a canopy PPFD map, a DLI check that includes ramping, and a uniformity target you can repeat. If your verification method isn’t written down, it won’t survive a multi-site rollout.
Table of Contents
Quantify crop light demand
Set PPFD and DLI by crop and stage
Start with a crop-and-stage target expressed in DLI, then convert to a PPFD target that fits your photoperiod and operational constraints.
For constant PPFD, the conversion is straightforward:
What matters operationally is that DLI gives you flexibility. You can often reach the same DLI with:
a higher PPFD and shorter day (more intensity, more risk of hotspots and stress)
a lower PPFD and longer day (more hours, potentially easier on the canopy, different HVAC/runtime implications)
Done when: you have a table by crop and stage with target DLI, chosen photoperiod, and the resulting target PPFD at the canopy.
Define uniformity and verification
Before you “optimize spectrum,” define uniformity and how you will prove you hit it.
Common ways to express uniformity in a room include:
min/avg PPFD ratio across the measurement grid
coefficient of variation (CV) across points
max/min ratio to catch hotspots
The exact target depends on crop tolerance and operating style, but the measurement discipline is universal: take many readings at canopy height, not a few points under a fixture.
Practical verification notes:
Build a repeatable grid (same coordinates every time) and record canopy height.
Use a quantum sensor designed for PAR measurements, and keep calibration current.
If you use ramping, don’t estimate DLI from “full output” PPFD. Log or calculate the ramp contribution.
⚠️ Warning: If you accept a vendor’s PPFD map without verifying it in your room, you’re accepting their assumptions about reflectance, mounting height, and spacing.
Done when: you have a written measurement plan (grid density, sensor height, logging method) and a baseline PPFD map for the current setup.
Map targets to photoperiod and CO₂
PPFD and DLI don’t live alone. If you raise PPFD materially, the crop’s ability to use that light depends on the rest of the environment, especially CO₂, temperature, and airflow.
Two practical rules of thumb for decision-making:
Don’t set PPFD targets that assume elevated CO₂ if your CO₂ system can’t hold setpoint consistently.
Align photoperiod decisions with labor windows and thermal constraints. The cheapest kWh is rarely the only constraint; the “best” schedule can still create humidity, leaf temperature, or dehumidification problems.
Done when: your DLI plan and PPFD targets are explicitly tied to your CO₂ strategy and HVAC operating envelope (day/night setpoints, dehumidification capacity, airflow plan).
Design your spectral strategy
Stage-based blue/green/red/far-red/UV
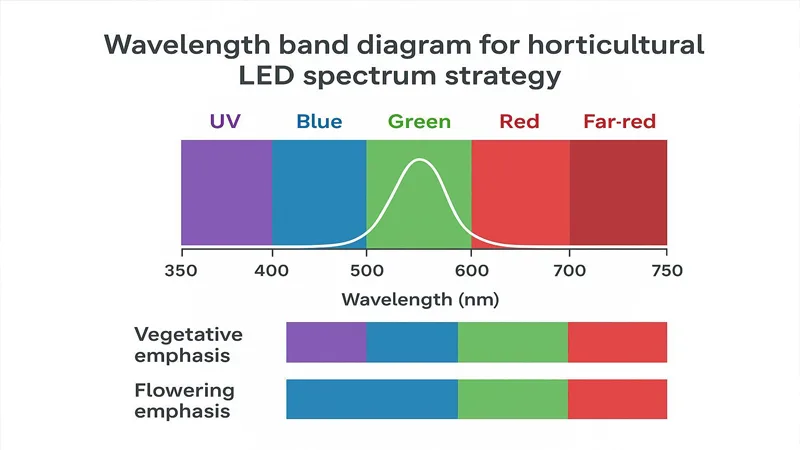
Spectrum strategy should start with a stage-based objective, not a diode wishlist.
In vegetative stages, you typically bias toward enough blue to manage morphology (tight internodes, leaf development), without pushing stress responses.
In flowering/finishing stages, you typically bias toward higher red share for photosynthesis efficiency and production goals, then consider whether far-red or limited UV has a role.
Green is not “wasted.” In dense canopies, it can contribute to penetration and distribution. The question is balance and outcomes, not whether green is “useful.”
Your “spectrum recipe” should be documented as channel ratios (or a spectral power distribution target) tied to a stage and DLI plan. If you can’t describe it in a way that survives procurement, you won’t be able to repeat it later.
Guardrails for far‑red, UV, and ePAR use
Far-red, UV, and ePAR are where spectrum work tends to go wrong, because it’s easy to change morphology while believing you’re only changing photosynthesis.
Guardrails that keep teams out of trouble:
Far-red (700–750 nm) can influence morphology and shade-avoidance responses. Treat it as a timed tool, not “more is better.” Decide up front whether you’re using it for end-of-day signaling, for a specific developmental effect, or not at all.
UV (typically UVA for most LED applications) is a stressor. If you use it, start with limited exposure windows and define a stop condition (leaf damage, slowed growth, quality regression).
ePAR (extended PAR) expands the accounting band beyond 700 nm. That affects how you compare fixtures and interpret efficacy claims. If you’re mixing vendors or updating specs, make sure you’re comparing like-for-like metrics.
Done when: you have an explicit list of what you will not do (maximum far-red contribution, UV exposure limits, and measurement definitions for PAR vs ePAR) before you run any trials.
Trial design and quality assays
Treat spectrum changes like process changes in a facility: controlled, measured, and reversible.
A practical trial design approach:
Hold DLI constant, change one spectral variable.
Keep layout and uniformity constant during the trial. If you must change the layout, treat it as a separate test.
Decide your evaluation metrics before you start: morphology targets, time-to-finish, quality assays relevant to your crop, and any signs of stress.
You don’t need a research lab, but you do need discipline: consistent sampling locations, documented environment setpoints, and a clear definition of “success.”
Done when: you can show a before/after PPFD map, a controlled spectral change description, and a short report that ties crop outcomes to measured inputs.
Model layout and select fixtures (custom LED grow light spectrum at scale)
Photometry, height, spacing, and overlap
Once PPFD/DLI targets and spectral guardrails are set, layout becomes a photometry problem: deliver the target PPFD uniformly, with predictable overlap.
What to model (and then verify in-room):
mounting height range (including serviceability constraints)
fixture spacing and row-to-row overlap
aisle effects and edge losses
reflectance assumptions (walls, curtains, racks)
Then, validate the model with a canopy PPFD map. If you can’t match the model within an acceptable band, treat the model as wrong until proven otherwise.
Optics for rooms vs. vertical racks
Optics and distribution requirements change with geometry.
In open rooms, you’re typically balancing coverage area, overlap, and glare control.
In vertical racks, you’re managing shorter throw distances, tighter uniformity windows, and inter-reflections. Small spacing errors can become big PPFD differences at the canopy.
Decide whether you need wider distribution for fewer fixtures, or tighter distribution to control spill and hotspots. There isn’t a universal answer; there’s the answer that fits your canopy, height, and workflow.
PPE, reliability, listings, surge protection
In commercial facilities, fixture selection isn’t only about PPE (photosynthetic photon efficacy). Reliability and inspection readiness are often the real constraints.
Request and review:
photometric files (IES/LDT) and PPFD maps
driver behavior under dimming and at temperature
surge protection approach and grounding expectations
safety listing scope and any installation conditions
Neutral brand context (≤30 words): SLTMAKS can support layout simulations using photometric files and provide certification documentation packages aligned with inspection expectations, helping teams standardize fixture selection across rooms.
For a practical internal reference on distance and mapping fundamentals, see the SLTMAKS distance chart for full spectrum LED grow lights.
Done when: you have a layout model, a verification plan, and a fixture short list that meets photometry, dimming behavior, and listing requirements.
Controls and thermal integration
Recipes with 0–10 V/DALI and ramping
A “spectrum recipe” only survives the real world if your control architecture can reproduce it.
Clarify early:
control interface compatibility (0–10 V, DALI, or another system)
channel mapping (what does each channel actually control?)
ramp behavior (how quickly does output change, and does it affect DLI accounting?)
Ramping is often treated as a comfort feature, but it changes your daily photon delivery unless you measure it correctly. Capture this in your commissioning checks.
Thermal/HVAC math and airflow planning
Lighting changes the room’s heat balance. Even when LEDs reduce radiant heat compared to legacy systems, electrical input still becomes heat in the space, and distribution matters.
Plan for:
changes in sensible load due to lighting power density
canopy temperature shifts due to spectrum and airflow changes
airflow patterns that interact with the tighter rack geometry
If you’re increasing PPFD, assume you may need to revisit air mixing and dehumidification strategy, not just setpoints.
Done when: your lighting plan is reflected in HVAC assumptions (loads, airflow, dehumidification), and facilities agree it’s within capacity.
Commissioning, safety, and EM behavior
Commissioning is where “paper specs” meet reality.
Commissioning checks to document:
PPFD map at canopy height in a representative zone
dimming response and channel integrity (no unexpected cross-talk)
grounding and surge protection confirmation
electromagnetic (EM) behavior: verify controls aren’t noisy, and drivers behave normally under facility conditions
Define your sign-off criteria ahead of time, and treat deviations as change control items.
Done when: you have a commissioning record that includes PPFD uniformity, control behavior under dimming, and safety checks suitable for audit and replication.
Procurement, compliance, and ROI
DLC Hort V4.0 and controllability
If you rely on utility rebates or want a standardized efficiency baseline, DLC matters.
The DesignLights Consortium (DLC) publishes requirements and a qualified products framework for horticultural lighting. Their Hort V4.0 Technical Requirements became the application basis starting April 18, 2025, including a higher minimum PPE threshold.
If you’re planning multi-site deployments, pay attention to the transition timeline in DLC’s Hort V4.0 QPL revision cycle. It affects whether a product remains listed during your procurement window.
Controllability is not a “nice to have” in many programs. Treat it as part of your requirements spec: interface compatibility, dimming range, and how settings are documented for verification.
Safety listings and documentation pack
Plan to build a documentation pack before you place a large PO. At a minimum, most teams need:
safety listing evidence and scope (what standards and configurations are covered)
installation instructions and any required conditions (mounting, spacing, wiring)
photometric files and PPFD maps
control interface documentation (0–10 V, DALI, channel mapping)
warranty terms and service process
Define who owns document review (procurement, facilities, compliance) and what the stop conditions are if something is missing.
For an internal evaluation lens on avoiding low-quality fixtures and documentation gaps, reference the SLTMAKS LED grow lights buyer’s guide.
TCO, incentives, payback, and IRR
ROI for lighting is rarely “fixture efficiency only.” Include costs that operators actually feel:
energy cost at your tariff (and how controls affect it)
HVAC and dehumidification impacts
maintenance labor and downtime risk
replacement parts and warranty coverage
incentive eligibility and documentation effort
Build at least two scenarios (conservative and expected) and use the same assumptions across sites. If you change spectrum or PPFD targets, update the model; don’t assume the original payback still holds.
Done when: procurement can see the total cost of ownership (TCO) inputs and assumptions, and operations agree the plan is supportable without hidden HVAC or labor costs.
Conclusion
Key steps recap and sequencing
The safest sequence is boring on purpose:
Quantify crop demand with DLI/PPFD targets.
Define uniformity and measurement, then capture a baseline.
Set spectrum guardrails by stage, especially around far-red, UV, and ePAR definitions.
Model layout, then verify it with real PPFD mapping.
Confirm controls can reproduce recipes and that ramping is accounted for.
Integrate thermal/HVAC assumptions before scaling.
Lock procurement around compliance documentation, DLC requirements, and TCO.
Pilot, measure, and standardize before scaling
If you do one thing to de-risk spectrum design, do this: pilot in a representative zone, measure like you’ll measure after rollout, and standardize the procedure.
That standardization is what lets you scale across rooms without re-learning the same lessons.
Final checklist to de‑risk deployment
Use this as a final gate before ordering or retrofitting a full room:
PPFD and DLI targets are written per crop and stage.
Photoperiod and CO₂ assumptions are explicit.
Uniformity targets and a measurement grid are defined.
Spectrum recipe is documented by stage, with far-red/UV limits.
The layout model exists, and you can reproduce it with PPFD mapping.
Controls mapping (0–10 V/DALI) is confirmed, and commissioning tests are defined.
Facilities have reviewed HVAC/airflow impacts.
DLC and safety documentation are collected, review-owned, and stored.
TCO model includes HVAC, maintenance, and downtime assumptions.
If you want a practical way to start aligning spectrum choices with fixtures and deployment constraints, the SLTMAKS-recommended LED grow light guide can serve as a reference point for how recipes and evaluation criteria are typically framed.
FAQ
Why should commercial operators prioritize DLI over PPFD when setting light targets?
While PPFD measures instantaneous intensity, DLI (Daily Light Integral) measures the total amount of light delivered over 24 hours. Focusing on DLI provides operational flexibility; you can achieve the same biological outcome by balancing a higher PPFD with a shorter photoperiod, or a lower PPFD with a longer day. This allows you to optimize for electricity tariffs, HVAC capacity, and crop stress management.
What are the risks of ignoring “ePAR” (400–750 nm) in modern spectrum design?
Traditional PAR only accounts for 400–700 nm. However, modern standards like DLC Hort V4.0 and the ePAR metric recognize that far-red (700–750 nm) significantly influences photosynthesis and plant morphology. If you don’t account for ePAR, you may miscalculate the true efficacy (PPE) of your fixtures and overlook the “shade-avoidance” responses—like excessive stretching—caused by unmonitored far-red levels.
How does green light contribute to a high-density canopy strategy?
Green light is often misunderstood as “wasted.” In fact, green light has superior canopy penetration compared to red and blue light. While red and blue are heavily absorbed by the top layer of leaves, green light bounces deeper into the canopy, driving photosynthesis in lower leaves and ensuring more uniform growth and ripening throughout the plant profile.
What environmental adjustments are mandatory when increasing PPFD targets?
Light does not act in a vacuum. If you increase PPFD to drive higher yields, you must ensure your CO₂ supplementation is consistent and sufficient to process that light. Additionally, higher light intensity—even from LEDs—changes the sensible heat load. You must verify that your HVAC and dehumidification systems can handle the increased transpiration and maintain leaf temperature setpoints.
Why is “Uniformity” more critical than “Average PPFD” in a large-scale rollout?
An average PPFD can be misleading; it may mask “hotspots” in the center and “dim zones” at the aisles. Poor uniformity leads to inconsistent morphology and uneven finish times, which complicates labor scheduling and harvest logistics. A professional design uses a measurement grid to calculate the Coefficient of Variation (CV), ensuring every plant across the room receives the same spectral recipe.
What should be included in a “Spectrum Validation” documentation pack?
Before scaling a custom spectrum, you should compile a pack that includes: ·Photometric files (IES/LDT) to prove layout accuracy. ·Channel mapping for 0-10V or DALI controls to ensure the “recipe” is repeatable. ·Safety and Compliance evidence (e.g., DLC Hort V4.0 listing) for rebate eligibility. ·Thermal/EM behavior reports to confirm that the drivers won’t interfere with facility sensors or overload the electrical grid.