Introduction
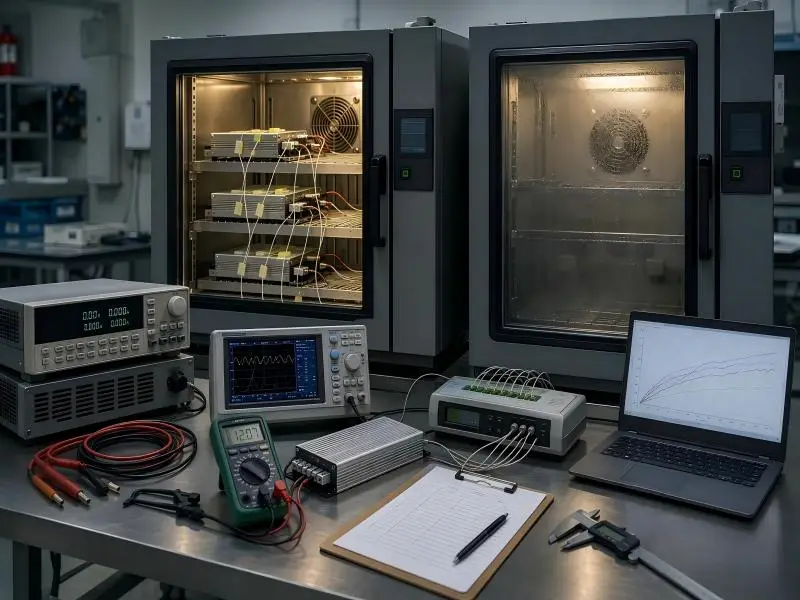
A driver that fails mid-flower does not just take a fixture offline. It removes a known photon load from a room planned around a specific daily light integral, forces the remaining fixtures to carry a canopy they weren’t scheduled for, and pushes the replacement lead time—often 8 to 14 weeks—straight into a harvest calendar. Across a 500-fixture site, the driver stops being a component and becomes an uptime risk with a calculable cost.
That cost is exactly why testing LED grow light drivers for comprehensive reliability deserves its own qualification file, separate from whatever the fixture datasheet says about LEDs. The LED package and the driver age differently and are certified under different scopes, yet suppliers routinely present a single “50,000 hours” figure as though it covers both.
Rebate eligibility is the second reason. Utility horticultural programmes gate on documentation that describes the driver, not just the fixture: the current DesignLights Consortium requirements call for driver lifetime data, the driver’s temperature measurement point, and in-situ temperature measurement demonstrating performance at the fixture’s highest rated ambient temperature. Without that file, a qualifying installation can still fail the paperwork.
This guide works through the compliance framework, the test plan, the environmental and electrical stress routines, and the reliability metrics that turn test results into procurement clauses. By the end, you will have acceptance gates you can write into a purchase order and a dossier structure your team can audit against.
Compliance Framework for Testing LED Grow Light Drivers
System vs. Component Scope
The most expensive misunderstanding in horticultural lighting documentation is treating a component listing as a system listing. They evaluate different things, and an inspector checks the right one.
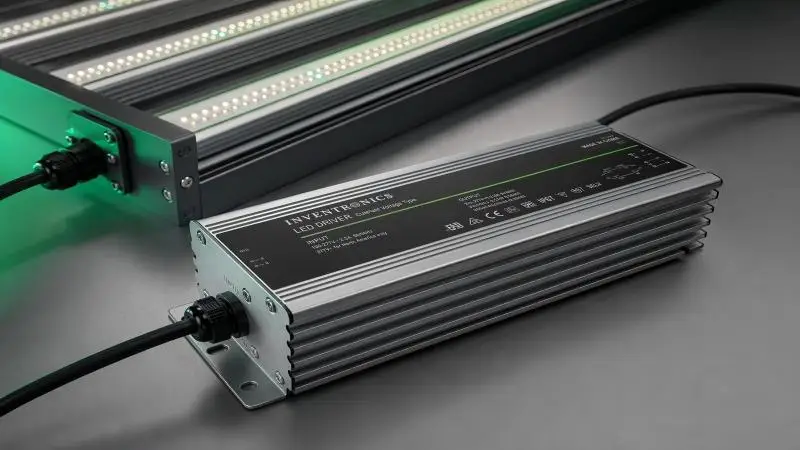
UL 8800 covers horticultural lighting equipment and systems. Its scope includes luminaires and, where a horticultural system is involved, an assessment of lampholders, wire harnesses, plugs and connectors, LED packages, drivers, lamps, hardware and grow structures. It also folds in horticulture-specific conditions — damp locations, elevated ambient temperature, and photobiological safety assessment.
UL 8750 sits one level down. It covers LED equipment that is integral to a luminaire or lighting system: drivers, controllers, arrays and packages, plus power sources built into LED luminaires. Horticultural LED components inside a fixture are subject to its humidity requirements.
In practice, this means a grow light built around a UL 8750-listed driver still needs its own UL 8800 evaluation as finished horticultural equipment. Intertek makes the same distinction plainly: UL 8750 ensures the internal LED components of a fixture are designed and tested to operate safely, but it does not certify the complete luminaire. Ask which of the two documents a supplier is sending you, and check that the model number on it matches the model you are buying.
UL 8800 and UL 8750
UL 8800 was introduced in 2017, published as a harmonized U.S./Canadian standard in 2019, and is the first set of standardised requirements written specifically for horticultural lighting equipment. Beyond electrical safety, it addresses damp and wet location suitability and elevated ambient operation — the two environmental factors that separate a grow room from a warehouse.
UL 8750 carries the driver-level evaluation. For a facility engineer, the practical question is not which standard is “better” but which scope the certificate covers. A UL 8800 certification scope for horticultural luminaires document should name the finished fixture; the driver evaluation appears as supporting evidence inside it, not as a substitute for it.
IEC 61347-2-13 and IEC 62384
On the international side, the driver is evaluated on two separate axes. IEC 61347-2-13 addresses safety requirements for LED controlgear — the driver itself rather than the complete luminaire. IEC 62384 covers performance characteristics of electronic controlgear for LED modules, such as operating behaviour and ratings. Together they describe the driver; neither describes the horticultural fixture, and neither substitutes for an NRTL listing against ANSI/CAN/UL 8800 where the local authority having jurisdiction requires one.
That matters most in one specific situation: when a supplier offers an IEC report as evidence for a North American installation. It is real evidence, but it answers a different question than the one the inspector is asking.
Test Plan and Setup
Worst-Case Thermal and Electrical Conditions
Driver life is governed by the temperature at the case, not the temperature on the wall thermostat. Any test plan that runs at comfortable bench ambient is measuring something the fixture will never experience.
Start by establishing the driver’s case temperature point — the Tc location the driver manufacturer designates for lifetime derating — and instrument it directly.
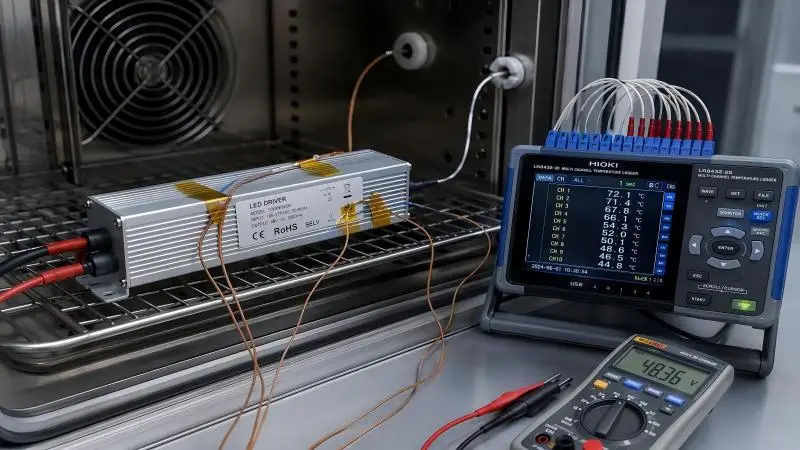
Then reproduce the real thermal stack: driver compartment air temperature, radiant load from the LED board and heat sink, and the containment effect of a canopy that reduces air exchange above the fixture. In dense rooms, the driver compartment commonly runs 10 to 15 °C above room ambient, which moves the projection by a full doubling step for every 10 °C.
Electrical worst case is not simply full power. Test at maximum rated drive current, at the input voltage extremes the site actually delivers, and at the highest ambient the room reaches on a summer afternoon with cooling at reduced capacity. Then repeat at the low end of the dimming range, where many drivers leave their stable regulation window.
⚠️ Warning: A Tc or MTBF figure quoted at 25 °C bench ambient tells you nothing about a canopy room running 36 °C at the driver compartment. Demand the condition statement alongside the number, or the number cannot be used in a design decision.
Loads, Fixtures, and Controls Alignment
Driver output behaviour is meaningless unless the load matches the intended LED configuration. A constant-current driver must be tested against a load presenting the LED board’s forward voltage at rated current, not a resistor bank tuned to a convenient figure. Constant-current vs constant-voltage driver selection covers where that boundary sits for different board topologies.
Align the control layer before you start logging. Confirm the dimming protocol in use — 0–10 V and DALI are not interchangeable — then run the same control signal the production controller will send, including the ramp profile. A control mismatch won’t show up on a bench; it shows up as a fixture that flickers in the room but not in the lab.
Instrumentation, Logging, and Acceptance Gates
Log temperature, input voltage and current, output voltage and current, power factor, THD, and the dimming control signal. Sample fast enough to catch transient behaviour during ramps — a 1 Hz log will miss exactly the events that matter at low dim levels.
Every acceptance gate should state five things: the test standard, the stress level, the duration or cycle count, the sample size, and the pass/fail criterion. A result reported as “passed HTOL” without those five fields cannot be reviewed by anyone else, including your own EHS team two years later.
Environmental Stress Tests
High-Temperature Operating Life (HTOL) at Tc
HTOL runs the driver powered and loaded at an elevated case temperature for a defined duration, with the goal of exposing early-life failures and characterising wear-out behaviour. Semiconductor programmes apply the same logic per JESD22-A108 — temperature plus electrical bias, at or above maximum rated conditions, for 500 to 1,000 hours.
Two interpretation rules matter. First, HTOL is run at a stress level above the application condition, so the result is an acceleration result, not a direct lifetime claim. Second, a test that produces zero failures does not mean zero field failures — it establishes a statistical upper bound on the failure rate at the tested confidence level. Report it that way, and it stays useful; report it as “no failures, therefore reliable,” and it becomes a liability.
Damp Heat and Condensation Exposure
Damp heat, steady state is defined by IEC 60068-2-78 damp heat steady state and evaluates whether equipment survives prolonged high humidity at constant temperature without condensation. The widely used biased condition for active parts is 85 °C and 85 % relative humidity for 1,000 hours.
The trap is that steady-state damp heat is not the same test as condensation cycling. A grow room that swings in temperature will condense moisture at seals, potting interfaces, and connector faces in a way a constant-temperature chamber never reproduces. A driver can pass a clean 85/85 result and still corrode at the terminal block within a year. If the site sees temperature swings, plan a cyclic-humidity variant as well.
Temperature Cycling and Thermal Shock
Temperature cycling subjects the assembly to repeated transitions between defined low and high extremes, with controlled ramp rates and dwell times, per IEC 60068-2-14 (JEDEC JESD22-A104 is the equivalent semiconductor-side reference). It stresses solder joints, interconnects, and encapsulants — the mechanical fatigue paths that humidity testing does not touch. Cycle count matters as much as the temperature span; a 1,000-cycle run across a wide span is a different test from a 100-cycle run across the same span.
Thermal shock applies the same thermal extremes with abrupt transitions instead of controlled ramps. It targets material and interface defects — seal integrity, potting delamination, CTE mismatch — that a slow cycle can let pass. Running both is not redundant; they fail different things.
Electrical Stability and Flicker
Output Regulation, PF, THD, Efficiency Drift
Electrical performance is not a single-point measurement. It is a drift map across load and temperature.
Start with the thresholds a programme will actually check. The DLC Horticultural Technical Requirements V4.0 require a measured power factor of at least 0.90 and a current THDi no greater than 20 %, established at any reported input voltage at full output or in the non-dimmed state through benchtop electrical testing or ANSI/IES LM-79. Reproduce those conditions exactly when you verify them; a PF reading taken at 40 % dim is not the number the programme recognises.
Then track what changes: output current regulation across the full dim range, efficiency at 100 %, 50 % and minimum output, and the same three points again at the top of the thermal envelope. Efficiency that holds at 100 % and collapses at 10 % produces heat where the driver has the least airflow.
Dimming-Cycle Stability and Sunrise/Sunset Profiles
Dimming is where driver behaviour gets interesting, because the low end of the range is where control loops are least stable. Output ripple typically rises as the output current falls, and the modulation depth of any residual ripple becomes more visible against a lower average output.
Two perceptual metrics now carry the weight. PstLM is the short-term light modulation measure, applying to roughly 0 to 80 Hz, and a value of 1.0 is the point at which about half of observers perceive flicker. SVM is the stroboscopic visibility measure covering the 80 to 2,000 Hz band, where 1.0 is the just-visible threshold. The commonly cited limits are PstLM ≤ 1.0 and SVM ≤ 0.4 flicker limits, and the same thresholds are used in the EU Ecodesign single lighting regulation.
IEEE 1789 takes a different route, defining low-risk and no-observable-effect regions as a function of percent modulation against fundamental frequency rather than as fixed numbers. That frequency dependence is why a fixture with low-frequency pulse behaviour can sit outside the IEEE 1789 low-risk flicker regions even when its nominal percent modulation looks modest.
In practice, test flicker across the whole ramp, not at a single point. Logarithmic dimming curves help because human brightness perception is roughly logarithmic, so perceived change is smoother and abrupt current steps near the bottom of the range are avoided. Sunrise and sunset profiles are gentler than step dimming because they spread the change over time and reduce transient stress on the driver — but the profile itself does not guarantee low flicker. If the underlying current loop is poorly controlled, a slow ramp can still produce visible modulation as it passes through the unstable region near minimum output.
The chart illustrates the behaviour to watch for: both metrics stay comfortably inside their limits at high output and diverge as dimming deepens, with SVM typically crossing its 0.4 threshold first. That crossing point is the figure to record in your test file — it identifies the lowest dim level the fixture can hold before visible modulation becomes a risk, which matters for ramp profiles that spend time at low output.
Surge Immunity and EMC Considerations
A commercial distribution network serving grow rooms produces transients from motor starts, capacitor bank switching, and utility events. IEC 61000-4-5 defines the surge immunity test; a 4 kV line-to-line rating is a widely used procurement baseline for commercial drivers, and it is frequently reviewed as a programme-specific add-on rather than a core listing metric.
Test the driver both unpowered and powered, verify that protection features recover without latching, and check for parameter shift after the surge rather than only for catastrophic failure. A driver that survives 4 kV but drifts 5 % on output current has failed in a way that will surface later as uneven canopy light.
Reliability Metrics and Reporting
MTBF per Telcordia and Condition Statements
MTBF is the most quoted and least understood number on a driver datasheet. It is a statistical estimate of aggregate failure rate across a population operating in the flat portion of their life — the inverse of the field failure rate. An MTBF of 100,000 hours does not mean a driver runs for 100,000 hours. It means one failure per 100,000 cumulative operating hours across a population.
The calculation method changes the answer. Telcordia SR-332, MIL-HDBK-217F, and IEC 61709 use different models and different ambient assumptions, and can produce materially different figures for the same bill of materials. Supplier-published values for commercial drivers range from the tens of thousands to the hundreds of thousands of hours, and most of that spread is assumption, not hardware quality. MTBF is a population statistic, not a lifetime, and life expectancy is set by the weakest component in the assembly — usually the electrolytic capacitor.
Pro Tip: Write the condition statement into your specification, not just the target number: “MTBF: X hours, calculated per Telcordia SR-332 for the stated bill of materials, ambient, duty cycle and confidence level.” A number without that sentence cannot be compared against a competing bid.
Tc-Based Lifetime Projections and Limits
Where MTBF describes a population, Tc-based lifetime describes a degradation mechanism. The dominant one is electrolytic capacitor aging: electrolyte is lost over time as the seal degrades, capacitance falls, and equivalent series resistance rises. Higher ESR increases ripple heating, which accelerates further aging — a self-reinforcing loop. End-of-life criteria are typically a capacitance drop to roughly 80 % of nominal or a doubling of ESR.
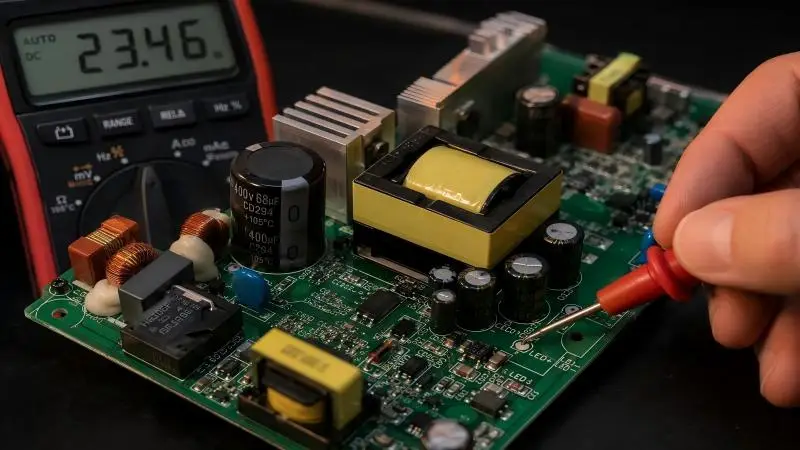
Temperature controls the rate, and the relationship is steep. According to electrolytic capacitor dry-out and ESR rise documented in LED-Professional’s lifetime analysis, every 10 °C reduction in capacitor temperature approximately doubles life, and every 10 °C rise approximately halves it. Capacitor manufacturers rate 105 °C parts at 10,000 to 12,000 hours and generally cap achievable life around 15 years.
That is the whole argument for Tc-based reporting. A projection stated as “Y hours at Tc = Z °C, rated load and specified ambient; valid only under these conditions” is decision-useful, because you can compare Z against the temperature your room actually reaches. A bare MTBF figure is not.
Optocouplers are the second wear-out path. Their quantum efficiency declines under thermal and electrical stress, so current transfer ratio falls even at constant forward current. Mitigation — lower forward current, lower duty cycle, running below 125 °C — is a design decision you can ask about but not retrofit, which makes it a legitimate qualification question rather than a maintenance issue.
Separating LM-80/TM-21 from Driver Life
LM-80 measures lumen maintenance for LED packages, arrays and modules over time. TM-21 extrapolates that data to project long-term light output retention. Both describe the light source. Neither describes the driver.
A driver does not emit lumens and does not age by losing light output. It fails functionally or degrades electrically. TM-21 cannot be applied to a driver, and a datasheet that presents a TM-21 projection as driver life has conflated two different physics. The IES research on LED driver useful life confirms there is currently no single accepted test method for estimating driver lifetime; handbook-based statistical methods are the industry fallback and must always carry their conditions.
The practical audit rule: a fixture needs both numbers. Q90 or L90 from LM-80/TM-21 for the LED array, and a separate Tc-based driver life projection with its temperature stated. If a supplier offers only one figure for the whole fixture, one of the two mechanisms is unaccounted for.
Building the dossier. The value of all this testing is in how it gets documented, and the structure is worth adopting even where a programme does not mandate it. A usable driver dossier typically holds the driver specification sheet with its lifetime-versus-temperature curve and designated TMP, the in-situ temperature measurement report showing the measured temperature at that point under the fixture’s highest rated ambient condition, the environmental stress reports with their five reporting fields, the electrical performance data at both full and minimum output, and the surge test result. Alongside it goes the safety listing evidence and the LED-side Q90 data from a separate file.
That structure is what makes a specification defensible. SLTMAKS publishes driver operating conditions, temperature justification, and thermal behaviour data as part of its standard product documentation set — the same categories a qualification file needs — which is why a documented dossier is easier to assemble when the supplier already treats those figures as specification data rather than as answers to a special request. The test, regardless of supplier, is whether you can retrieve each item without waiting for a project-specific email chain.
From Test Data to Procurement and Uptime
Specifying Acceptance Criteria and Warranties
Test data only reduces risk when it has been converted into contract language. The clauses below are the ones worth writing into a purchase order, because each one is checkable at delivery.
| Acceptance criterion | Specification language |
|---|---|
| Driver lifetime | Driver lifetime ≥ 50,000 hours at the fixture’s highest rated ambient temperature, evidenced by a Tc-based projection naming the temperature measurement point |
| In-situ verification | In-situ temperature measurement report showing driver TMP temperature at highest rated ambient |
| Power quality | Power factor ≥ 0.90 and current THDi ≤ 20 % at rated input voltage in the non-dimmed state |
| Flicker | PstLM ≤ 1.0 and SVM ≤ 0.4 at 100 %, 50 % and minimum output, and at every point along the sunrise/sunset ramp |
| Surge immunity | IEC 61000-4-5 compliance at ≥ 4 kV line-to-line, with no parameter shift after the test |
| Certification scope | ANSI/CAN/UL 8800 listing for the finished luminaire by an OSHA-recognized NRTL, with the exact model number listed |
| Environmental | Retention of published electrical and thermal performance after damp heat and temperature cycling per the agreed test plan |
| Warranty | Minimum 5-year coverage explicitly including driver failure, with a stated claim process and spare-part availability commitment |
The warranty clause deserves attention. A five-year fixture warranty that excludes the driver, or that requires return of the entire fixture before a replacement ships, transfers the downtime risk straight back to you. Ask what ships first.
Qualification Dossiers for Audits and Rebates
Rebate administrators do not approve a product family. They match an exact model number against the current DLC Horticultural Qualified Products List, and the file has to support the match.
Assemble the project file with the exact model number, not the family name; the manufacturer cut sheet for that variant; the acceptance and test reports supporting the listing, including the PF and THDi electrical data; the safety certification documentation; any utility pre-approval or reservation paperwork; and installation records with installed quantity and location. Capture a dated screenshot or PDF of the QPL entry at the time of application or purchase — listings and programme versions change, and a delisting discovered at audit is much harder to argue than one discovered before ordering.
Maintenance Planning and Spare Strategies
Test results inform what your maintenance team does with the data. Two signals are worth acting on before failure occurs.
First, log driver compartment temperatures during peak load. Thermal shutdown cycling is an early indicator that a driver is running at its thermal limit; in a room, it usually presents as a fixture that dims or drops out and recovers, which is easy to misread as a controls problem. Second, watch for repeated failures of the same driver model across multiple fixtures. A pattern failure is a procurement signal, not a maintenance inconvenience.
Spare strategy follows from lead time rather than from price. Maintain a minimum 5 % on-hand spare driver pool for each active driver model in rooms above 50 fixtures, and track supplier lead times quarterly — supply chain disruptions have pushed commercial driver lead times into the 8 to 14 week range. Reduce the number of active driver SKUs where spectrum requirements allow, because each additional model carries its own spare stock, documentation, and compatibility confirmation. Potted drivers are sealed by design and are not field-serviceable, so the spare is the repair; the grow light driver fault isolation and replacement criteria reference covers how to confirm a driver fault before pulling a replacement from stock.
Conclusion
A reliability claim that survives an audit has three properties. It names the standard that was applied. It states the condition under which the result is valid. And it keeps the LED’s light-decay mechanism separate from the driver’s electrical wear-out mechanism, because the two need different tests, different metrics and different documents.
Standardising that across sites is largely a matter of refusing numbers without conditions. A package that arrives with a Tc-based lifetime projection, an in-situ temperature report, environmental stress results carrying their reporting fields, and separate LED-side Q90 data is one you can compare, clause and audit. One that arrives with a single headline figure tells you the specification has not been written yet.
Key Takeaway: Match the metric to the mechanism. MTBF describes population failure rate under stated conditions, Tc-based projection describes wear-out life at a stated case temperature, and LM-80/TM-21 describes LED lumen maintenance. Only the first two have anything to do with your driver.
Next steps for your team:
- Add the acceptance-criteria table to your lighting procurement specification for the next fixture or retrofit package
- Instrument driver compartment temperatures in one representative room at peak load and compare them against the supplier’s Tc derating curve
- Request the complete driver dossier — lifetime-versus-temperature curve, TMP, in-situ report, stress-test reports, electrical data, surge result — before the next award
- Cross-check driver management against your spare-parts model, because a documented driver cannot ship a second time while you wait for a production run
If you are assembling acceptance criteria or a qualification dossier for an upcoming project, talk to the SLTMAKS technical team for specification support and product documentation that maps to the categories above.
FAQ
How is an LED grow light driver’s lifetime different from the fixture’s rated hours?
They’re measured against different mechanisms. A fixture’s headline hours usually come from LM-80/TM-21 data, which describes how the LED packages lose light output over time. The driver doesn’t emit light and doesn’t age by dimming — it fails functionally or drifts electrically, most often through electrolytic capacitor dry-out and optocoupler wear. TM-21 cannot be applied to a driver, so a single “50,000 hours” figure for the whole fixture leaves one of the two aging paths unaccounted for. Ask for a Tc-based driver projection with its case temperature stated, plus the LED-side Q90 or L90 separately.
Does a UL 8750-listed driver make the whole grow light certified?
No. UL 8750 evaluates the LED equipment inside a luminaire — drivers, controllers, arrays, and packages — but it does not certify the finished luminaire. A complete horticultural fixture built around a UL 8750-listed driver still needs its own UL 8800 evaluation as finished horticultural equipment, because UL 8800 covers the system-level conditions specific to grow rooms: damp locations, elevated ambient temperature, and photobiological safety. When a supplier sends certification paperwork, identify which document it is and confirm the exact model number listed matches the model you’re buying.
What should you measure and specify to confirm driver reliability for uptime?
Instrument the driver’s designated case temperature point (Tc) inside the real thermal stack, not at bench ambient, since a driver compartment in a dense canopy room commonly runs 10–15 °C above room ambient. Test at maximum rated drive current, at real input voltage extremes, at peak summer ambient, and again at the low end of the dim range. Record PF ≥ 0.90 and THDi ≤ 20 % in the non-dimmed state, flicker (PstLM ≤ 1.0, SVM ≤ 0.4) across the full ramp, and any post-surge parameter shift. Then write those into the purchase order with the standard, stress level, duration, sample size, and pass/fail criterion attached.