Introduction
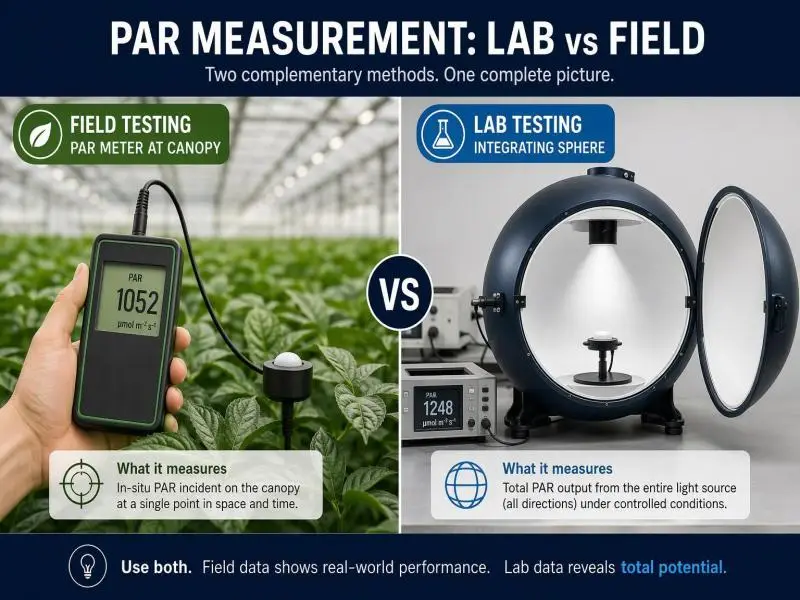
A fixture that reports 2,800 µmol/s of PPF on an accredited LM-79 report and a canopy that measures 780 µmol/m²/s under a handheld quantum sensor are not in conflict. They are answers to different questions. The sphere report describes what the luminaire emits under controlled laboratory conditions; the field map describes what reaches the crop after mounting height, spacing, wall reflectance, and fixture geometry have taken their share.
That distinction matters commercially. A procurement decision made on sphere data alone can overpay for output the room cannot deliver evenly, while a field map alone cannot tell you whether a fixture meets the DLC efficacy threshold or whether its spectrum will hold up under dimming. Used together, the two methods close the loop between specification and crop response: the lab report establishes fixture-level PPF, PPE, and spectral quantum distribution, and the field map establishes delivered PPFD, uniformity, and the dimming level that actually hits your target.
This article sets out the metric definitions, the DLC V4.0 requirements that shape what a credible report contains, the physical reasons the two methods diverge, and a field PPFD standard operating procedure you can hand to a technician. The aim is a measurement program that supports yield consistency, uniformity across a canopy, and defensible energy calculations rather than a single number on a datasheet.
Table of Contents
Definitions and Standards
PAR, PPF, PPFD, PPE
Photosynthetically active radiation (PAR) is the 400–700 nm waveband used to quantify light for photosynthesis. Four quantities do most of the work in horticultural procurement, and confusing them is the root of most lab-versus-field disputes.
- PPF (photosynthetic photon flux) is the total photon output of a fixture in the PAR range per second, in µmol/s. It is a property of the luminaire, not the room.
- PPFD (photosynthetic photon flux density) is PPF arriving per unit canopy area, in µmol/m²/s. It is a property of a location in your facility at a moment in time.
- PPE (photosynthetic photon efficacy) is PPF divided by electrical input power, in µmol/J. It is the efficiency metric that DLC thresholds and utility incentives are built on.
- DLI (daily light integral) integrates PPFD over the photoperiod into mol/m²/day, and is the variable most closely tied to cumulative growth.
A fixture’s PPF does not become PPFD until it is installed. The conversion depends on how much of the emitted flux lands on the canopy, which is a function of mounting height, beam distribution, spacing, and room surfaces.
DLC V4.0 Buyer Implications
The DesignLights Consortium’s Horticultural Lighting Technical Requirements V4.0 took effect on April 18, 2025, and raised the minimum PPE threshold to 2.5 µmol/J — an 8.7% increase over V3.0 and, by the DLC’s account, more than 45% above the most efficacious non-LED option, the 1000W double-ended high-pressure sodium luminaire. The DLC states that this increase will delist the least efficacious V3-listed products, roughly 11% of the QPL.
For buyers, several details in the V4.0 policy document change what a submittal must contain:
- PPF must be reported to ANSI/IES LM-79 across 400–700 nm, with 400–500, 500–600, and 600–700 nm bins reported alongside the total. Far-red photon flux (700–800 nm) is reported separately.
- Spectral quantum distribution (SQD) and photosynthetic photon intensity distribution (PPID) are reported, the latter with a TM-33 XML file and a distribution image generated with the DLC’s public tool.
- Testing must come from laboratories accredited to ISO 17025 and the relevant standard, and only LM-79-19 or newer reports are accepted for new applications. Partial reports — the policy explicitly names an integrating sphere report without PPF — are rejected.
- Dimming behavior is reported: minimum input wattage, minimum PPF, default wattage, and default PPF, plus the control method.
- Safety certification to ANSI/UL 8800 by an OSHA-recognized NRTL is required.
- Tolerances exist for qualification (PPE at −5%, for example), which is why a listed product’s measured value can sit slightly below a nominal figure without disqualification.
Two practical consequences follow. First, a V3 listing is not equivalent to a V4.0 listing; the V3.0 QPL update deadline was October 31, 2025, with delisting on January 5, 2026, so confirm which version a quoted product is listed under. Second, a DLC listing does not automatically qualify a fixture for a utility rebate — the Resource Innovation Institute’s lighting guide advises checking with the program before purchase.
Lab vs Field Metric Scope
The scope boundary is the single most useful thing to write into your specification:
| Question | Method | Metric |
|---|---|---|
| What does the fixture emit, and how efficiently? | Accredited LM-79 sphere or goniophotometer test | PPF, PPE, SQD, PPID |
| What reaches the canopy, and how evenly? | Field quantum sensor mapping | PPFD, uniformity ratio, DLI |
A lab report cannot tell you your uniformity. A field map cannot tell you your PPE as listed. Neither substitutes for the other, and a procurement file should contain both.
PAR Meter vs Integrating Sphere: Core Differences
What Each Method Measures
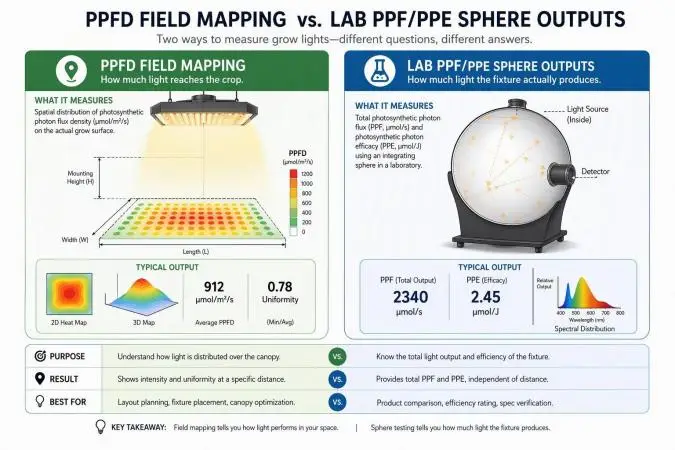
An integrating sphere is a hollow, diffuse-reflecting enclosure that collects essentially all light emitted by a luminaire and presents it to a spectroradiometer. In the 4π configuration used in accredited testing, the fixture operates in its intended orientation inside the sphere, and the system is calibrated with a standard light source before measurement. The output is total flux plus a full spectral power distribution — the raw material for PPF, PPE, and SQD. A goniophotometer instead rotates the fixture and measures intensity at many angles, producing the PPID that describes how flux is distributed in space.
A quantum sensor is a photodetector behind an optical filter and a cosine-correcting diffuser, calibrated to report photon flux density. It measures one point, one plane, one moment. Mapping means repeating that point measurement across a grid and aggregating.
The difference in what is being characterized is fundamental: the sphere integrates over all directions and reports a fixture property; the sensor samples a direction-weighted flux at a location and reports an installation property.
Accuracy and Uncertainty
Accredited photometric testing carries quantified uncertainty. A representative LM-79 report from an ISO 17025-accredited laboratory states a luminous flux uncertainty of U = 2.1% (k = 2) at 95% confidence, with power measurement uncertainty of 0.46%. The LM-79-19 method itself notes that typical testing laboratories have expanded uncertainty of at least 3% (k = 2), and that differences between sphere and goniometer systems in NIST interlaboratory comparisons were not statistically significant at that level. In other words, a few percent of spread between two accredited labs is normal and not evidence of misrepresentation.
Field measurement has a different error budget, and it is larger. Published sensor specifications illustrate the components: the Apogee SQ-521 manual lists calibration uncertainty of ±5%, measurement repeatability under 1%, long-term drift under 2% per year, non-linearity under 1%, directional (cosine) response of ±2% at 45° zenith and ±5% at 75°, temperature response of −0.11% per °C, and a 0.6 s response time to reach 95% of a step change.
Those numbers compound in the field. A sensor held a few degrees off horizontal, read before the display settles, or used two years after its last calibration can easily produce a 5–10% deviation that has nothing to do with the fixture. Add placement error — a reading taken in an aisle, under a walkway shadow, or at a height above the canopy — and the gap between a field number and a lab-derived expectation widens further.
The practical implication is that field data should be treated as a distribution with a tolerance band, not a precise scalar. When a field average sits within roughly 10% of a simulation or a lab-derived estimate, the two are broadly consistent; a 30% shortfall is a real finding worth investigating.
Spectral Considerations
Quantum sensors are not spectrally neutral. Each sensor’s filter and detector combination has a spectral response that approximates, but does not match, the defined PAR action spectrum. The resulting spectral error depends on both the sensor and the light source.
The Apogee comparison of eight quantum sensor models quantifies this. For the SQ-500, spectral errors were typically small across the tested sources — 0.5% under cool white LED, 0.2% under warm white LED, 2.8% under a 667 nm red LED, and −3.9% under an 80/20 red-blue LED mixture.
Sensors using gallium arsenide phosphide photodetectors fared far worse under narrowband red: the SQ-100 showed −62.1% under a 667 nm red LED and −72.8% under the red-blue mixture. The study’s conclusion is direct: sensors with GaAsP photodetectors must be used with caution for absolute PPFD and should not be used to measure LEDs without first verifying the sensor under those specific LEDs.
This is why a full-spectrum sensor matters for LED cultivation. The SQ-500 specification cites a spectral range of 389 to 692 nm ±5 nm, extended relative to earlier designs specifically to improve LED measurement accuracy.
The lab side of the spectrum question is handled differently. An integrating sphere with a spectroradiometer measures the actual spectral power distribution of the fixture rather than inferring it through a filter, which is why DLC V4.0 requires SQD reporting and why spectrally tunable products must have each predefined spectral setting tested and named on the QPL.
This is where a documented test chain helps. SLTMAKS publishes integrating-sphere test data for its grow light lines and states that custom spectrum products ship with third-party PPF measurement reports and complete SPD curve files, alongside goniophotometer testing and PPFD uniformity work on diode layout.
For an operator, the value is not the claim itself but the artifact: an SPD file you can compare against your sensor’s response curve, and a PPF figure you can carry into a room-level mapping plan. When the spectrum is validated in a sphere, and the delivery is mapped in the room, the two datasets answer the same question from opposite ends — what the fixture produces, and what the crop receives.
One caution on spectrum and efficacy: far-red output in the 700–800 nm band is reported separately under V4.0 and does not count toward PPE, so a broad spectrum with substantial far-red will show a lower PPE than a narrow red-blue fixture of similar visual brightness. Compare fixtures on the same metric basis.
Field PPFD SOP for Growers
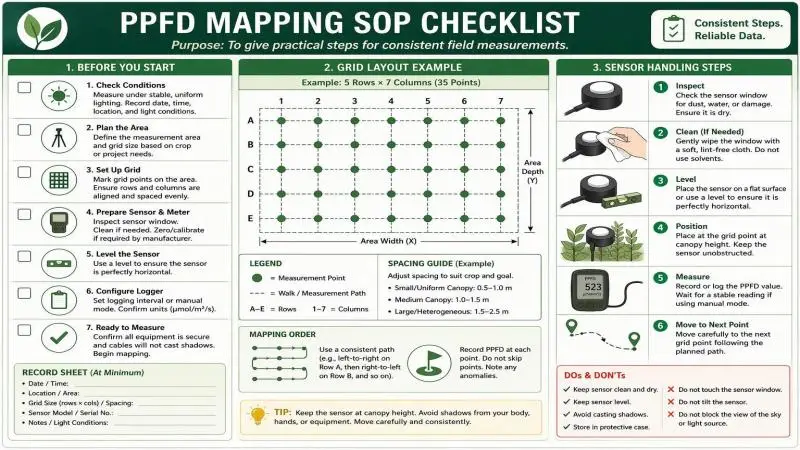
A field map is only as good as its protocol. The following SOP is written to be repeatable across technicians, rooms, and harvest cycles.
Grid Design and Uniformity
Define the measurement plane first: the horizontal surface at the top of the canopy at its expected mature height, not the floor and not the fixture plane. Mark it physically so the same plane is used next time.
Lay out a grid that samples the cultivated area, not the room. A common approach is a rectangular grid sized so that no cell is larger than roughly 0.5–1 m² in dense bench or rack systems, with grid lines offset from fixture rows so you are not repeatedly sampling directly under a fixture center. Include the edges of the canopy area — edge cells are where uniformity failures appear — but exclude aisles and walkways unless you are deliberately documenting spill light.
Record the number of points and the area they represent. The Resource Innovation Institute’s guidance is to take readings in an evenly spaced grid so values can be averaged across the canopy and compared to the crop’s target PPFD, and to measure in enough locations that the average is meaningful.
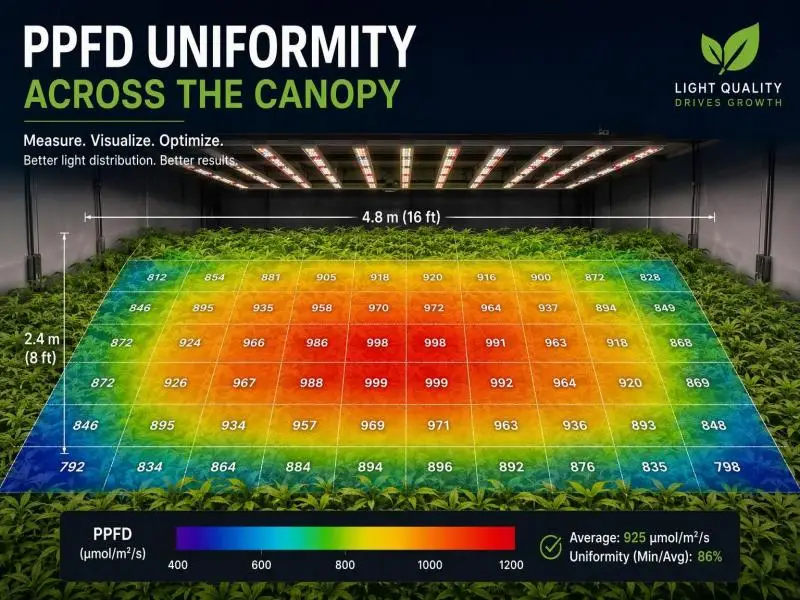
Compute uniformity as the ratio of minimum to average PPFD across the measured plane, and label the convention. Coefficient of variation and max/min are also in use, so an unlabeled uniformity figure cannot be reliably compared against a design simulation or an earlier campaign that used a different one.
Because the ratio is driven by the weakest cell, the grid decides the result — which is why edge cells and the gaps between fixture rows have to be in it. A minimum-to-average ratio of 0.80 or better is a reasonable design target for commercial production; below roughly 0.70, variation across the canopy becomes agronomically significant. Report minimum, maximum, average, and the ratio, and keep the raw grid so the map can be compared to the next campaign.
Sensor Calibration and Corrections
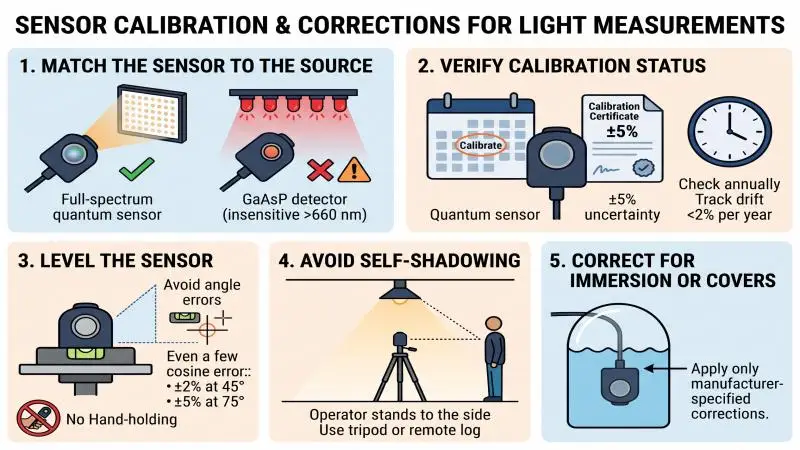
- Match the sensor to the source. Use a full-spectrum quantum sensor for LED measurement. A sensor with a gallium arsenide phosphide detector is insensitive above roughly 660 nm, and the comparison study cited above showed large errors under narrowband red; its guidance is not to use such a sensor for LEDs without first verifying it under the specific fixture spectrum.
- Verify calibration status. Manufacturer calibration uncertainty is typically ±5%, and long-term drift is specified at under 2% per year. Track the calibration date and send the sensor out on the manufacturer’s recommended interval, or verify it against a reference under the actual fixture spectrum.
- Level the sensor. Cosine response error grows with zenith angle — ±2% at 45° and ±5% at 75° on the SQ-521 — so a sensor off horizontal by more than a few degrees introduces avoidable bias. Use the bubble level or mounting fixture, not freehand holding.
- Avoid self-shadowing. The operator’s body and clothing reflect and block light. Stand to the side of the measurement point, or use a tripod or remote-logging sensor, and repeat any reading that changes when the operator moves.
- Correct for immersion or diffuser covers only as specified. If the sensor is used under a protective dome or in a different medium, apply only the corrections the manufacturer documents.
Recording Conditions and Repeatability
Every map should carry the conditions that produced it, because a PPFD number without context cannot be compared to anything:
- Operating state: dimming level or control signal value, and whether the reading was at full output or a production setpoint.
- Stabilization: elapsed operating time at the start of mapping. LED output and driver behavior change during warm-up and with operating temperature; the goal is to compare results after the fixture reaches a reproducible state, not to assume a universal warm-up duration.
- Display settling: allow the reading to settle according to the meter’s sampling behavior rather than recording the first fluctuating value; if the meter logs, average a stable interval at each cell.
- Ambient conditions: room air temperature, and whether other light sources (sunlight through glazing, supplemental fixtures on a different circuit) contributed.
- Fixture configuration: mounting height, spacing, lens or optic type, and any recent layout changes.
- Metadata: date, technician, sensor model and serial number, calibration due date, and the grid diagram with point numbering.
Repeatability comes from repetition. Re-map at the same points after any change to mounting height, dimming schedule, or fixture model, and on a routine interval — every six months is a common cadence for spot-check verification against commissioning data, with a full grid re-measurement every two to three years or after a crop or system change. Investigate deviations beyond about 10% rather than adjusting targets to match a drifting measurement.
Conclusion
The two methods are complementary instruments in one measurement program, and each has a defined job.
Use integrating sphere and goniophotometer reports for fixture-level facts: PPF, PPE, spectral quantum distribution, and intensity distribution, produced under LM-79-19 at an accredited laboratory and reported to the DLC V4.0 format. These are the numbers that establish compliance, support utility incentive applications, and let you compare products on a common basis. Use PAR meter mapping for room-level delivery: the PPFD your canopy actually receives, the uniformity ratio across the production area, and the dimming level that hits your crop target without overshooting.
Expect the two to differ, and do not treat the difference as an error. Geometry — mounting height, spacing, beam angle, wall and floor reflectance — and environment — temperature, warm-up state, sensor placement — sit between the fixture’s emitted flux and the canopy’s received flux density. A field average within about 10% of a lab-derived expectation is a reasonable consistency check; a larger gap is a prompt to inspect layout, sensor condition, and operating state before concluding anything about the fixture.
Tune dimming and mounting to close the gap deliberately. If the map shows the center of the room over target and the edges under it, the fix is spacing and height, not a higher setpoint everywhere. If the average is right but uniformity is poor, raising output to lift the weakest cells wastes energy in the strongest ones. Measure, adjust, and re-measure at the same points — that loop, run on both lab data and field data, is what turns a lighting specification into predictable,
FAQ
What is the difference between an integrating sphere report and a PAR meter reading?
According to article.txt, an integrating sphere measures the total photon flux (PPF) a fixture emits under controlled laboratory conditions. A PAR meter measures the photosynthetic photon flux density (PPFD) that actually reaches the crop canopy in a specific real-world facility.
Why do field PPFD measurements differ from lab-tested PPF ratings?
Lab data reflects pure fixture output, whereas field measurements described in article.txt are heavily influenced by mounting height, fixture spacing, and wall reflectance. Additionally, field readings carry larger error margins due to sensor calibration drift, minor leveling inaccuracies, or operator shadowing.
What are the DLC V4.0 requirements for horticultural lighting?
The DLC V4.0 standard mandates a minimum photosynthetic photon efficacy (PPE) threshold of 2.5 µmol/J. Submittals must include accredited LM-79 reports, spectral quantum distribution (SQD), specific dimming behaviors, and safety certifications.
How should growers properly map PPFD in their facilities?
Growers must establish a consistent horizontal measurement plane at the expected mature canopy height. Technicians should use a full-spectrum quantum sensor designed for LEDs, perfectly level the device, map points across an evenly spaced grid, and calculate the uniformity ratio.