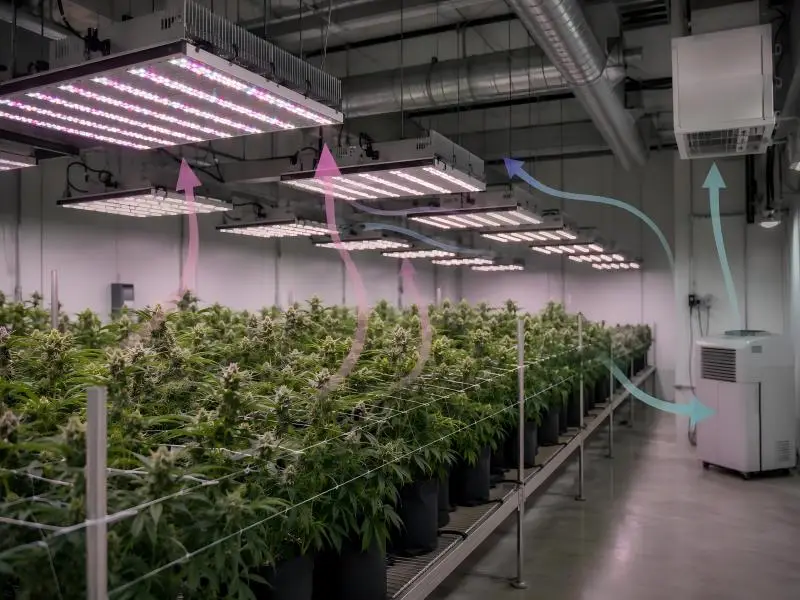
When scaling a commercial indoor farm or retrofitting a multi-thousand-square-foot facility, lighting procurement represents one of the largest capital expenditures you will make. Beyond the initial fixture cost, your choice directly dictates facility power density, monthly electricity bills, HVAC thermal loads, and ultimately, grams per watt of yield.
Yet, commercial growers frequently discover a frustrating reality: the performance metrics published on marketing datasheets do not always match real-world canopy measurements. When fixture efficacy or photon flux claims are exaggerated—even by 10% to 15%—the compounded impact on operational expenses and crop uniformity can derail financial projections.
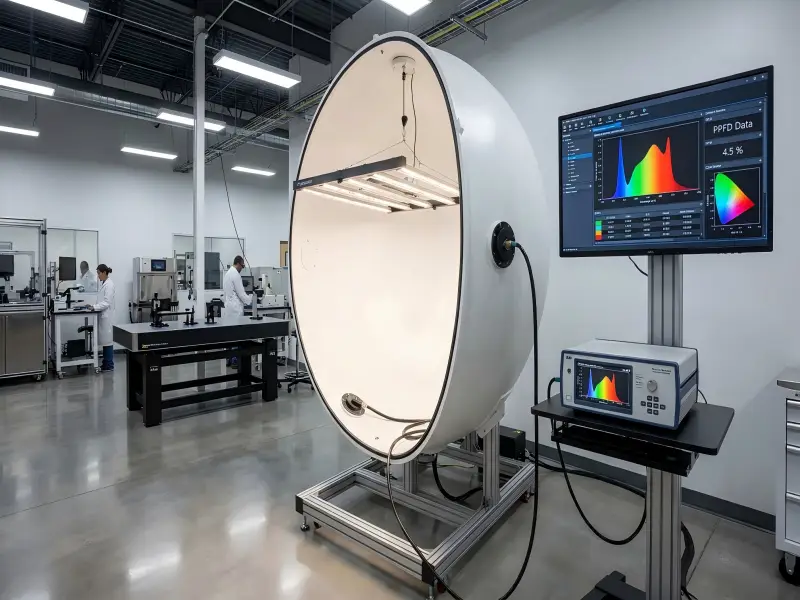
To eliminate guesswork and provide absolute engineering transparency, reputable manufacturers rely on the precise science of integrating sphere testing for grow lights. In this guide, we break down how this spectroradiometry works, how standards like ANSI/IES LM-79-19 protect buyers, and how commercial operators can evaluate test reports to ensure every spec is verified.
Table of Contents
Why Growers Can’t Always Trust Light Specs
In the competitive horticultural lighting market, spec sheet inflation remains a persistent challenge. Commercial buyers are often inundated with impressive headline figures—such as “3.0 µmol/J efficacy” or “1500 PPFD at 12 inches”—without clear context regarding how those numbers were derived.
Marketing Claims vs. Laboratory Truth
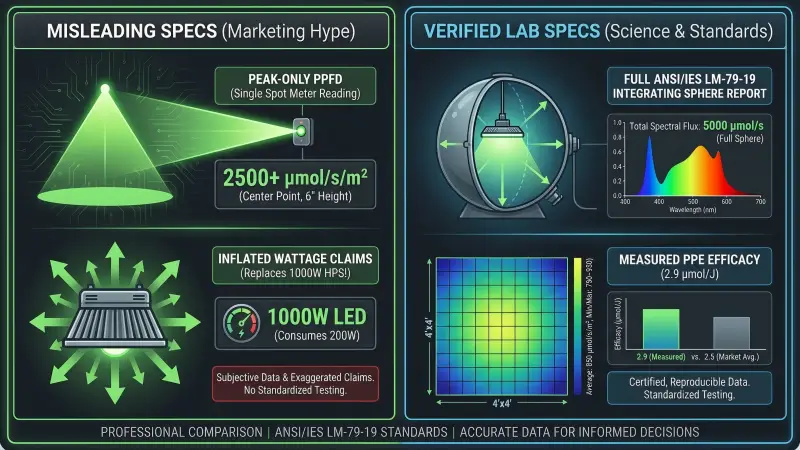
Datasheets frequently present best-case numbers calculated under artificial conditions rather than operational reality. Common misdirections include:
- Calculated theoretical efficacy: Multiplying the raw LED chip manufacturer’s benchtop efficacy by the total LED count, completely ignoring driver efficiency losses, thermal degradation, and optical cover impedance.
- Nominal wattage rating: Calculating photosynthetic photon efficacy (PPE) using a rounded or nominal fixture power rating (e.g., 600W) rather than actual measured AC power draw (e.g., 635W at full load).
- Uncalibrated field meters: Presenting flux values measured with handheld, uncalibrated quantum sensors subject to angular error and spectral mismatch.
The Dangers of Peak PPFD and Inflated PPE
A common marketing tactic is highlighting a single “peak PPFD” spot measurement directly beneath the center of a fixture hung low above the canopy. While a central reading of 1,200 µmol/m²/s looks impressive on a social media graphic, it says nothing about light uniformity across a 4×4 ft or 4×6 ft bench. If the edges drop to 300 µmol/m²/s, the canopy experiences uneven transpiration, uneven nutrient uptake, and inconsistent yield quality.
Similarly, an inflated PPE rating misleads energy consumption models. A 0.2 µmol/J discrepancy on a 1,000-fixture facility operating 18 hours per day translates into tens of thousands of dollars in unexpected annual power and cooling costs. Verified laboratory data is the only defense against these costly discrepancies.
The Basics of Integrating Sphere Testing Grow Lights
To measure a luminaire’s total optical output and electrical performance with mathematical precision, lighting engineers use an integrating sphere paired with an array spectroradiometer.
How an Integrating Sphere Works
An integrating sphere is a hollow spherical chamber whose interior surface is coated with an ultra-reflective, diffuse white material—typically barium sulfate (BaSO4) or expanded polytetrafluoroethylene (PTFE)—boasting 95% to 98% reflectance across the visible spectrum.
- Total photometric capture: The LED grow light fixture is mounted at the center of the sphere in 4π geometry (or over an entry port in 2π geometry). When powered on, every photon emitted by the fixture reflects repeatedly off the diffuse internal walls, distributing light uniformly across the interior surface.
- Spectral detection: A fiber-optic sensor port positioned on the sphere wall routes the integrated light to a high-precision array spectroradiometer. Internal baffles shield the detector port from direct line-of-sight exposure to the fixture, ensuring only fully integrated, scattered light reaches the sensor.
- Traceable calibration: Before testing, the system undergoes self-absorption correction (accounting for light absorbed by the physical body of the fixture) and is calibrated against standard reference lamps traceable to national metrology institutes like NIST.
The ANSI/IES LM-79-19 Standard
Credible horticultural lighting measurement relies on the ANSI/IES LM-79-19 standard, the industry-recognized approved method for optical and electrical measurements of solid-state lighting products.
LM-79-19 establishes rigorous laboratory protocols:
- Thermal stabilization: The fixture must operate continuously in the sphere at a controlled ambient temperature (25°C ± 1°C) until thermal equilibrium is achieved (defined as output changing by less than 0.5% over 15 minutes).
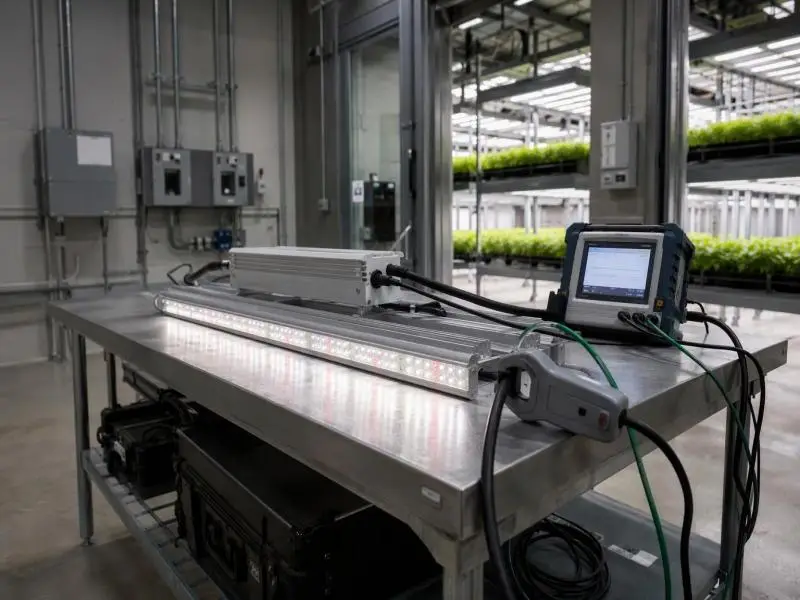
- Electrical precision: Input AC/DC voltage, current, total harmonic distortion (THD), and active power draw (watts) are measured using calibrated power analyzers.
- Reproducibility: Standardized operating conditions ensure that test results can be independently reproduced across accredited third-party laboratories worldwide.
From SPD to PPF and PPE
The spectroradiometer captures the fixture’s Spectral Power Distribution (SPD)—measuring radiant power across discrete wavelengths (typically 380 nm to 800 nm). From this raw SPD curve:
- Total photosynthetic photon Flux (PPF) is derived by integrating the photon emission rate across the 400 nm to 700 nm waveband, expressed in micromoles per second (µmol/s).
- Photosynthetic photon efficacy (PPE) is calculated by dividing total PPF by the actual measured electrical input wattage:
PPE formula: PPE (µmol/J) = Total PPF (µmol/s) ÷ Measured Input Power (Watts)
Distinguishing this laboratory-measured total output from field canopy performance is essential for facility planning.
PPF, PPFD, and PPE: Understanding the Difference
Commercial growers must navigate three closely related metrics that describe light output, canopy delivery, and energy efficiency.
PPF: Total Fixture Output
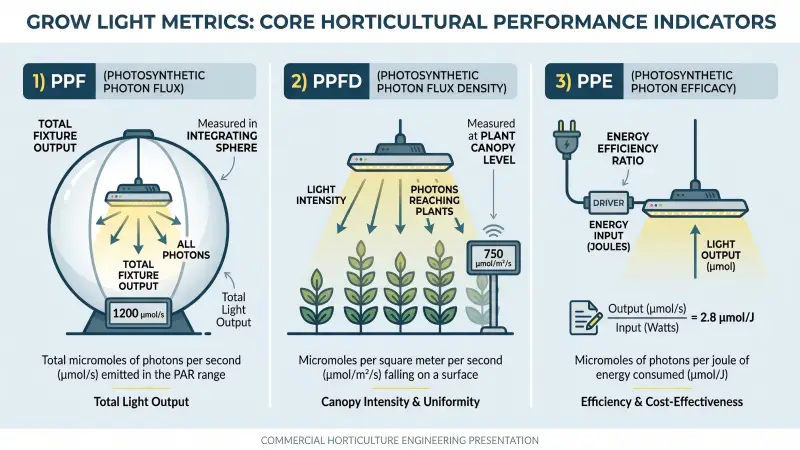
Photosynthetic Photon Flux (PPF) represents the total number of PAR photons (400–700 nm) emitted by a fixture every second, measured in micromoles per second (µmol/s).
- Key takeaway: PPF measures the total “engine capacity” of the fixture inside the integrating sphere. It tells you how much total light the unit produces, but does not indicate where those photons land in your grow room.
PPFD: Light at the Canopy
Photosynthetic Photon Flux Density (PPFD) measures the concentration of PAR photons arriving at a specific surface area per second, expressed in micromoles per square meter per second (µmol/m²/s).
- Measurement method: PPFD cannot be measured inside an integrating sphere. It is measured in open space across a grid of points on the plant canopy using a calibrated quantum PAR sensor.
- Influencing factors: PPFD varies significantly based on hanging height, fixture spacing, optic beam angle, and wall reflectivity. A complete PPFD grid map shows center-to-edge uniformity across the targeted cultivation area.
PPE: Efficiency That Drives ROI
Photosynthetic Photon Efficacy (PPE) measures how efficiently a fixture converts electrical energy into PAR photons, expressed in micromoles per joule (µmol/J).
| Efficacy Tier | PPE Range (µmol/J) | Operational Context |
|---|---|---|
| Legacy HPS | 1.3 – 1.7 µmol/J | High heat output, frequent lamp replacements, high energy costs |
| Entry LED | 2.1 – 2.4 µmol/J | Basic retrofit tier, moderate efficiency gains |
| Commercial benchmark | 2.6 – 2.8 µmol/J | Current standard for commercial indoor cultivation facilities |
| Premium high-efficacy | 2.9 – 3.2+ µmol/J | Advanced Samsung LED diodes, optimized drivers, low thermal penalty |
Accurate PPE data is the foundation of total cost of ownership (TCO) calculations, enabling facility operators to forecast monthly utility expense reductions and evaluate utility rebate eligibility.
How We Test Every SLTMAKS Fixture
At SLTMAKS, we believe commercial growers deserve total certainty before committing capital. Every fixture series undergoes exhaustive laboratory testing to verify optical, thermal, and electrical performance.
- Dual protocol rigor: Our testing procedures strictly comply with both ANSI/IES LM-79-19 (electrical and photometric measurement) and ANSI/ASABE S640 (quantities and units for horticultural lighting).
- 100% efficacy verification: We test every model variant—including full-spectrum formulations powered by top-bin Samsung LED diodes—inside calibrated integrating sphere systems to verify exact PPF output and active AC power draw across 120V, 277V, and 480V input configurations.
- Audit-ready documentation: All photometric files (.IES / .LDT) and LM-79 test reports are generated with complete traceability, supporting independent audits for local utility incentive applications.
By combining sphere-verified total output with simulated goniophotometric layout mapping, SLTMAKS commercial LED grow lights allow facility directors to plan crop light integral (DLI) targets with mathematical precision.
How to Verify Grow Light Specs Before You Buy
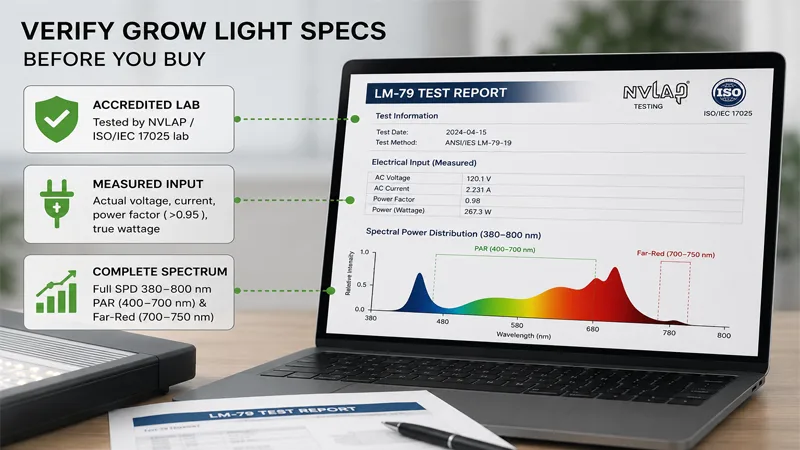
Before issuing a purchase order for commercial fixtures, procurement teams should conduct a structured audit of vendor datasheets and test reports.
What to Look for in Test Reports
Request complete, unabridged third-party laboratory LM-79 test reports. A legitimate report must contain:
- Accredited laboratory details: Test date, lab accreditation credentials (e.g., NVLAP, ISO/IEC 17025), and explicit reference to ANSI/IES LM-79-19 testing methods.
- Measured electrical input: Actual tested AC voltage, current, power factor (>0.95), and true wattage—not a nominal marketing approximation.
- Complete spectral power distribution: The full SPD graph from 380 nm to 800 nm, including PAR (400–700 nm) and Far-Red (700–750 nm) photon counts.
Red Flags in Marketing and Datasheets
⚠️ Warning: Watch out for these three red flags on vendor spec sheets:
- No test standard citation: Claiming PPF or PPE figures without referencing LM-79 or an accredited laboratory report.
- Peak PPFD without grid density: Displaying a high center PPFD number without a multi-point grid map specifying hanging height, room size, and wall reflectance.
- Missing driver voltage data: Stating a single PPE number that fails to specify tested input voltage (efficacy often varies slightly between 120V and 277V/480V operation).
Using Verified Data for ROI Planning
- Screen via DLC qualification: Use the DesignLights Consortium (DLC) horticultural requirements Qualified Products List (QPL) as an initial screen. DLC qualification mandates independent LM-79 testing and minimum efficacy thresholds required for energy efficiency rebates.
- Standardize on PPE first: Evaluate fixtures based on verified µmol/J efficacy to establish baseline energy consumption per micromole delivered.
- Model uniformity via photometric layouts: Combine sphere-verified total PPF with IES photometric files to run 3D light plan simulations, ensuring uniform PPFD across the canopy before hanging a single light.
FAQ
What is integrating sphere testing, and why is it essential for LED grow lights?
What is integrating sphere testing, and why is it essential for LED grow lights?
Integrating sphere testing is a laboratory optical measurement method that places a fixture inside a highly reflective spherical chamber to capture its total light output (photosynthetic photon flux, or PPF) and active electrical power draw. It provides mathematically precise, uncalibrated, error-free data on total photon production and energy efficiency (PPE), eliminating misleading marketing claims.
What is the difference between PPF and PPFD in grow light testing?
What is the difference between PPF and PPFD in grow light testing?
PPF (Photosynthetic Photon Flux) measures the total amount of PAR light a fixture emits per second in all directions, as determined inside an integrating sphere. PPFD (Photosynthetic Photon Flux Density) measures how many of those photons actually reach a specific area of the plant canopy per second, which depends on hanging height, fixture spacing, and room reflectivity.
How does ANSI/IES LM-79-19 testing protect commercial growers?
How does ANSI/IES LM-79-19 testing protect commercial growers?
ANSI/IES LM-79-19 is the standardized industry protocol for measuring the electrical and photometric performance of solid-state lighting. Testing under LM-79-19 ensures the fixture reaches thermal equilibrium, measures active AC power draw accurately, and delivers verifiable, reproducible spectral and efficiency metrics needed for reliable ROI calculations and utility rebate qualification.
Can an integrating sphere measure canopy light distribution (PPFD)?
Can an integrating sphere measure canopy light distribution (PPFD)?
No. An integrating sphere measures total fixture photon output (PPF) and spectral power distribution (SPD) in an enclosed environment. To measure PPFD and multi-point canopy light distribution, manufacturers use goniophotometric testing and open-space quantum PAR sensor grid mapping.
Why do measured LED grow light specs differ from theoretical chip specs?
Why do measured LED grow light specs differ from theoretical chip specs?
Theoretical specs calculate efficacy using LED ratings at ideal benchtop conditions, ignoring driver efficiency losses, thermal degradation, and optical cover impedance. Integrating sphere testing measures the fully assembled fixture under actual operating conditions, capturing true AC power consumption and real photon output.
What key documents should I request from a manufacturer to verify grow light specs?
What key documents should I request from a manufacturer to verify grow light specs?
Before purchasing, request an unabridged, third-party laboratory ANSI/IES LM-79-19 test report, the fixture’s Spectral Power Distribution (SPD) report, complete IES photometric layout files (.IES/.LDT) for 3D simulation, and proof of DesignLights Consortium (DLC) qualification.
Making Confident Procurement Decisions
In commercial horticulture, precision lighting is not an expense—it is a production tool. Relying on unverified marketing claims introduces unnecessary risk into crop yield, harvest consistency, and facility cash flow.
Integrating sphere testing under ANSI/IES LM-79-19 provides the objective foundation required for commercial light specification. By converting raw light output into verified spectral, photon flux, and efficacy data, sphere testing transforms purchasing decisions from marketing guesswork into reliable facility engineering.
When evaluating your next lighting expansion or HPS retrofit, insist on verified laboratory reports. Every dollar invested in your canopy deserves performance backed by rigorous optical science.