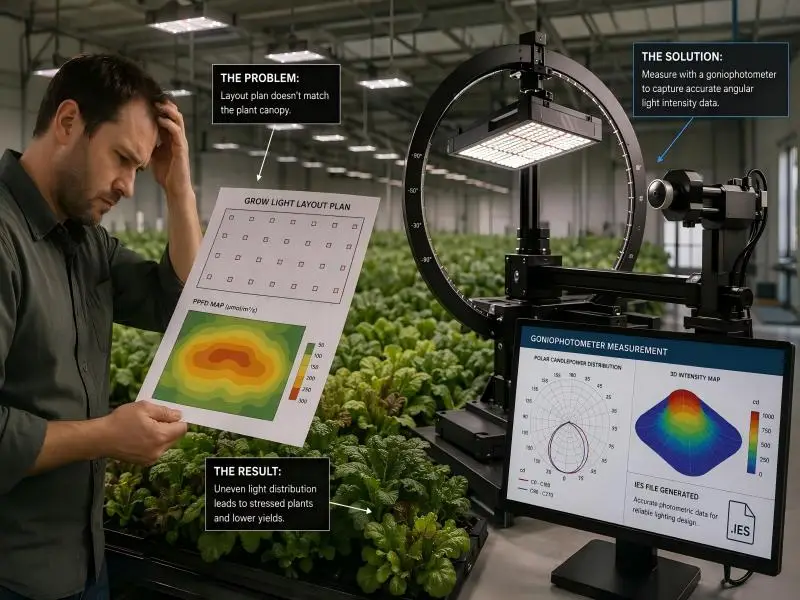
A grower specifies a fixture, receives a photometric file, imports it into layout software, and builds a plan around the predicted canopy uniformity. Then PAR (photosynthetically active radiation) meter readings come in from the first installed row, and the numbers don’t line up. Sometimes the file is wrong. More often, the file is fine, and the assumptions behind its use were never checked.
At the core of horticultural lighting design are grow light IES files, which translate physical fixture performance into actionable digital layouts. The instrument behind that data is the goniophotometer. It rotates a fixture through defined angular positions and records how much light leaves in each direction. Those angular intensity readings, plus a set of metadata describing the test, become the standard format that design software reads. This article treats these measurement records rather than simple designs: what the instrument measures, how the measurement becomes a file, where photopic and horticultural quantities diverge, and what to verify before a layout is trusted. It is written for commercial indoor and greenhouse operators evaluating fixtures and their documentation.
Table of Contents
How Goniophotometers Generate Grow Light IES Files and Differ from Integrating Spheres
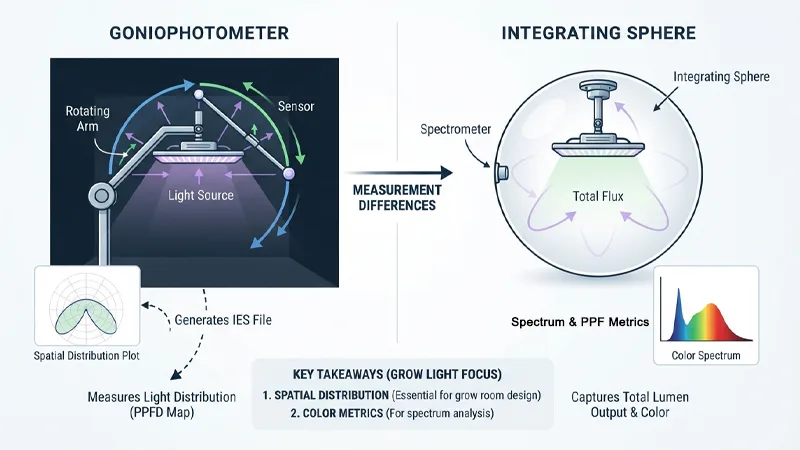
A goniophotometer records luminous intensity at a series of locations surrounding the test sample; total luminous flux is then calculated from those readings. An integrating sphere works the other way around: it captures total flux and colorimetric data inside a single enclosure, without resolving where the light goes.
The practical consequence is that the two methods answer different questions. As the U.S. Department of Energy’s guide to understanding LM-79 reports puts it, a report built only on sphere data will not characterize spatial distribution, and a report built only on goniophotometry is unlikely to include color metrics. If both methods were used, the report may carry two sets of values. Some goniophotometers can measure colorimetric performance, but most do not.
For a grow room layout, spatial distribution is the whole point. A fixture’s total PPF tells you how much light it produces; the distribution tells you where it lands. Only the goniophotometer resolves the second.
Measurement Geometry and the Far-Field Condition
Distributions are described in angular coordinates. Type C instruments, the common configuration for architectural and horticultural luminaires, use a C-plane and gamma scheme: gamma is the vertical angle from the fixture’s optical axis, and C identifies the horizontal plane in which that vertical sweep is taken. A file is essentially a grid of intensity values indexed by those two angles.
The measurement only represents the fixture’s behavior in a room if the detector sits far enough away that the inverse-square law holds. ANSI/IES LM-79-19 requires a test distance greater than five times the longest luminous dimension of the device, and notes that this is sufficient for products with a nearly Lambertian distribution. Beam-forming products may need larger distances, determined experimentally by measuring how intensity varies with distance. The test distance is a reported item, and it matters later: a distribution captured at a distance that does not satisfy the far-field condition will be extrapolated by software in ways the measurement does not support.
What the Instrument Does Not Tell You
The goniophotometer characterizes the fixture as tested, at a stabilized operating state, in a controlled ambient. LM-79 describes stabilization as the point where variation across at least three readings of light output and power, taken over 20 minutes, falls below 0.5%; the time required typically ranges from about 30 minutes for small integrated lamps to two hours or more for large luminaires. That stabilization time is recorded because the tested condition is part of what the file represents.
What the file does not represent: behavior at other drive currents or dimming settings, output after aging, or performance in the thermal environment of a specific room. A fixture tested at full output in a 25 °C lab is not the same object as a dimmed fixture running above a canopy in a warm, humid zone.
From Angular Measurements to an IES File
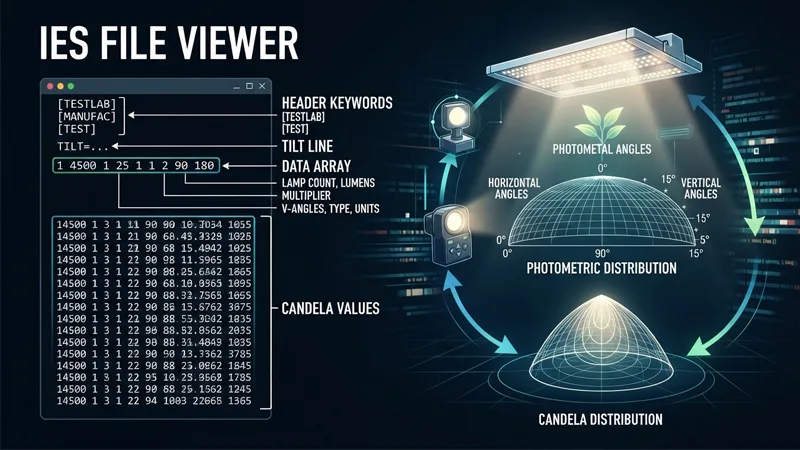
The conversion from raw readings to a distributable file is mostly bookkeeping, but the bookkeeping is where most practical problems hide. The file is a structured record of one specific test, not a general description of a product family.
The Structure of an IES File
The IES file format is defined by LM-63, an ASCII text standard. The format documentation published by Lighting Analysts lays out the sequence a specifier will see when opening a file in a text editor: a header of bracketed keywords such as [TESTLAB], [TEST], [ISSUEDATE] and [MANUFAC]; a TILT= line; then a line carrying the number of lamps, lumens per lamp, a multiplier, the number of vertical angles, the photometric type and the units type; followed by the horizontal angle set, the vertical angle set, and the candela values for each horizontal plane.
Older and newer versions of the standard coexist in the field. The 2002 edition is widely used, and the IES currently lists a later revision, ANSI/IES LM-63-19(R25). Not every manufacturer uses the current keyword scheme; parsers such as Photometric Toolbox fall back to reading everything before the TILT= line as descriptive text when keywords are absent. The edition declared in the file governs how its fields should be read.
Metadata That Determines How the File Behaves in Software
The multiplier, units type, photometric type, and angle sets are not cosmetic. They govern how design software scales and orients the distribution. A candela multiplier other than 1 changes every intensity value in the file. The photometric type defines the coordinate system, so the angle arrays cannot be interpreted until it is known. The luminous dimensions describe the photometric opening, not necessarily the external housing.
This is why a file can be internally consistent and still be applied incorrectly: if the metadata does not match the fixture as installed — its orientation, its configuration, its operating condition — the software will place a correct distribution in the wrong frame. The candela values can all be right while the layout is wrong.
Where Horticultural Reporting Diverges from the Base Format
The base photometric file has no concept of plant-relevant light. Horticultural programs add a reporting layer on top of it. The DesignLights Consortium’s Technical Requirements for LED-based Horticultural Lighting V4.0 is one documented example, and it is a program requirement for products submitted under that program rather than a universal legal obligation.
Under V4.0, photosynthetic photon intensity distribution (PPID, in µmol·s⁻¹·sr⁻¹) must be measured and reported by an appropriately accredited facility. PPID is integrated across 400–700 nm and therefore carries no spectral distribution information itself — it tells you the angular photon intensity, not the color of the light at each angle. The DLC also requires an ANSI/IES TM-33 XML document alongside the LM-79 report, with specified header, luminaire, and emitter fields. Note also that V4.0 accepts only tests performed to the 2019 or newer version of LM-79, conducted at full output or non-dimmed state.
Can a Standard Photopic IES File Represent Horticultural Light?
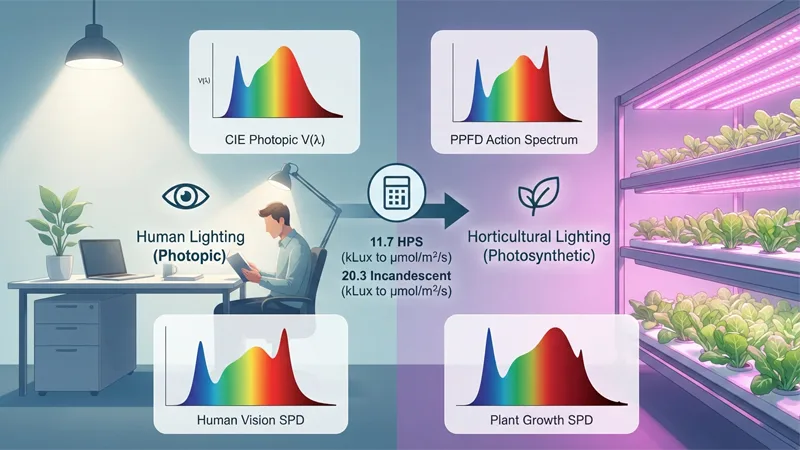
A standard photopic IES file describes luminous intensity weighted by the human eye’s response — the CIE luminous efficiency function. Plant-relevant quantities are photon-based and integrated over 400–700 nm. The two are related through the source’s spectral power distribution (SPD), which means a conversion is possible only when the spectrum is known, and the conversion factor is source-specific rather than a fixed constant.
Conversion factors published by AGi32 for translating illuminance in kilolux to PPFD in µmol·s⁻¹·m⁻². The spread across source types — from 11.7 for standard HPS to 20.3 for incandescent (CIE A) — shows why a single factor cannot serve fixtures with different spectra. Values are the software’s published table, derived from CIE 15:4 colorimetry data plus one manufacturer’s digitized white-LED SPD curves; they are conversion constants, not measured grow-light performance.
Why the Conversion Factor Is Not Universal
AGi32’s PPFD documentation publishes a table of conversion factors from kilolux to µmol·s⁻¹·m⁻². The spread is wide: about 20.3 for incandescent (CIE A), 11.7 for standard HPS, 14.4 to 16.3 across metal halide types, and roughly 14.3 to 18.1 for the white LEDs listed, with daylight values around 18.1 to 18.6.
The reason is straightforward once the spectrum is in view. A source that concentrates energy where the eye is insensitive but plants absorb — deep red, for instance — will have a low luminous flux relative to its photon output, and therefore a high conversion factor. A broad white LED with substantial green output sits lower. Applying a single factor across different fixtures or spectra introduces error proportional to how different those spectra are. The factor has to be tied to the actual spectral distribution of the source being modeled.
What Changes When the File Is Exported in PPFD
Some measurement systems can export IES or LDT files in PPFD units directly, so horticultural quantities can be used in conventional lighting design software. Viso Systems, for example, describes exporting IES and LDT files in PPFD for import into DIALux or AGi32. DIALux’s horticulture training similarly notes that alongside the photometric file, the spectral distribution is also required to convert photometric values to photosynthetic ones.
AGi32 takes a different route: PPFD is selected as a calculation type, and the software applies a conversion factor chosen in its PPFD Factors dialog. Its documentation states a limitation worth knowing: all sources contributing to a calculation grid are assumed to share the selected factor. In a room where every fixture is the same model at the same spectrum, that assumption holds. In a mixed installation — say, broad-spectrum top lights plus narrow-band supplemental bars — a single factor cannot be correct for all of them, and the grid will be biased toward whichever spectrum the factor suits.
Why a Valid IES File Can Still Produce an Inaccurate Layout
A file can parse correctly, carry plausible metadata, and still yield a poor prediction. The reason is that the file describes a fixture under test conditions while the layout describes an installation. Several assumptions must hold for the prediction to transfer.
Assumptions the Calculation Makes
The software treats each fixture as a point source, or as a distribution measured at a distance where the inverse-square law applies, and sums the contributions of multiple fixtures without modeling how they interact optically. Superposition is a good approximation for separated fixtures and a poor one where luminaires are packed closely or share optics.
Narrow-beam products are specifically flagged in LM-79 as challenging for both sphere and goniophotometer systems, and the required test distance for beam-forming products may need experimental determination. A tightly focused horticultural fixture with steep intensity gradients is exactly the case where a distribution measured too close, or interpolated too coarsely, will misrepresent the edges of the beam.
Installation Conditions the File Does Not Capture
The gaps between the tested fixture and the installed one are practical and cumulative:
- Drive current and dimming. The file represents one operating state. A dimmed fixture’s distribution shape is usually similar, but its absolute intensity is not, and some drivers behave differently at low output.
- Ambient temperature and thermal state. Output and spectrum shift with junction temperature. A lab at 25 °C is not a canopy zone at 30 °C with restricted airflow.
- Mounting height and orientation. The file’s coordinate system must be mapped correctly onto the installed geometry. A rotated or tilted fixture produces a rotated or tilted distribution.
- Reflective surfaces and obstructions. Walls, trays, ducting, and the canopy itself redistribute light in ways the file knows nothing about.
- Unit-to-unit variation. The tested unit is a sample. Delivered units vary within manufacturing tolerance.
None of these makes the file defective. They make the layout a prediction to be verified against measurements in the room, not a guarantee of what the canopy will receive.
What to Check on a Supplied Grow Light IES File and Test Report
Documentation review is faster when it follows a sequence. Three checks cover most of what matters.
Trace the File Back to an Accredited Test
The report should identify the testing laboratory, and the laboratory’s accreditation scope should cover the relevant method. In the United States, NVLAP administers an Energy Efficient Lighting Products program for laboratories performing lamp and luminaire testing. Laboratories applying for LM-79 accreditation must successfully complete NIST solid-state lighting proficiency testing before LM-79 is added to their scope, and accredited laboratories are required to participate in subsequent rounds.
For horticultural submissions, the DLC requires PPID to be measured and reported by an appropriately accredited facility. Confirming that the lab’s scope covers the method used — not just that the lab is accredited for something — is the check that matters.
Check That the File Matches the Product and the Claim
Compare the metadata to the product being purchased: model number and configuration, the operating conditions under test, the units and photometric type, and whether the distribution is measured or derived. The DLC’s TM-33 requirements give a concrete example of metadata that reveals how a file was produced: the intensity scaling field must be “false,” and scaling with respect to laboratory measurements is not accepted; the angle interpolation field must be explicitly “true” or “false,” not blank. A file that fails these checks is telling you something about its provenance.
Confirm the Quantity Is the One You Need
Before importing, establish whether the file carries a photopic distribution or a horticultural one. If the layout is to be read in PPFD, establish where the spectral data and conversion factor came from and whether they apply to the fixture and spectrum actually being specified. A photopic file imported into a PPFD calculation without a matching factor will produce a grid that looks authoritative and is systematically off.
What to Ask a Supplier When Requesting Photometric Documentation
The preceding checks translate into a short set of questions a buyer can put to a supplier. The purpose is to establish what was measured, by whom, and under what conditions — not to demand a particular brand of instrument or laboratory.
Questions About the Test
- Which laboratory performed the measurement, and what does its accreditation scope include?
- Which standard and version were followed — for example, LM-79-19 or newer?
- What operating conditions applied: drive current, dimming state, ambient temperature, and the stabilization criteria used?
- What test distance was used, and was the far-field condition verified for this product’s beam characteristics?
- Is the reported distribution measured, or has it been scaled or interpolated?
Questions About the File and Its Use
- Which file format and version are supplied — LM-63-2002, a later revision, or another format?
- Is the file photopic, or has it been exported in PPFD units?
- What spectral data accompanies the file, and does the conversion factor correspond to this fixture’s spectrum?
- Can the supplier confirm the file corresponds to the exact model and configuration being purchased?
A supplier able to answer these questions is providing the traceability a layout depends on. The answers belong with the project documentation rather than in a single email thread, because the next person to open the layout will need them.
FAQ
What is a grow light IES file?
Grow light IES files are photometric data files formatted in the LM-63 standard that record a horticultural fixture’s angular intensity distribution together with metadata describing the lab test. The usefulness of a grow light IES file for horticultural planning depends on whether the quantities it carries are photopic or plant-relevant.
Does an IES file contain PPFD?
Standard photopic grow light IES files contain luminous intensity (candelas), not PPFD. To get PPFD values, you must either use grow light IES files exported directly in PPFD units or apply a source-specific conversion factor derived from the fixture’s spectral power distribution.
Can I use a photopic IES file for a grow room layout?
Yes, photopic grow light IES files can be used for a grow room layout if the lighting software and spectral conversion are handled correctly, though accuracy depends on applying a conversion factor matched to the actual spectrum. Mixing fixtures with different spectra under a single factor is a known limitation of at least one common design package.
Why does my layout not match my PAR meter readings?
Even accurate grow light IES files only describe a tested unit under controlled laboratory conditions; your actual grow room has its own mounting geometry, wall reflectances, dimming state, and thermal environment. Always verify the metadata and conversion factor inside your grow light IES files before concluding the data is wrong.
Is a goniophotometer report required for every grow light?
Testing and documentation requirements depend on the rebate program or project specification the fixture is submitted to. For example, DLC horticultural requirements specify that PPID must be measured by an accredited facility to generate valid grow light IES files and TM-33 documents. Confirm against the applicable program’s documentation rather than assuming a general rule.
What is the difference between an IES file and an LDT file?
Both IES files and LDT (EULUMDAT) files are photometric data formats carrying angular intensity distributions, differing mainly in regional conventions (North America vs. Europe) and software support. The choice is usually dictated by the lighting design software in use rather than by the goniophotometer measurement itself.