Introduction
In the commercial horticultural lighting industry, specification sheets have become an arms race of single-number metrics. For years, facility operators and procurement teams evaluating commercial fixtures have operated under a foundational assumption: a higher grow light efficacy μmol/J rating automatically guarantees a higher harvest yield per watt of electricity consumed. When lighting manufacturers advertise fixture efficiencies jumping from 2.1 μmol/J to 2.8 μmol/J or even 3.2 μmol/J, it is easy to assume that crop biomass and dried flower output will scale in a linear, one-to-one ratio.
However, experienced commercial facility directors regularly observe a perplexing disconnect in real-world harvests. Two facilities operating fixtures with identical 2.8 μmol/J ratings can report wildly divergent harvest outcomes—one achieving an elite 1.25 grams per watt while the other struggles to break 0.70 grams per watt. Conversely, well-managed cultivation rooms retrofitted with mid-range fixtures frequently out-yield poorly configured rooms equipped with the highest-spec LEDs on the market.
The reality comes down to a fundamental photobiological distinction: grow light efficacy μmol/J measures input electrical energy to photon output conversion, not harvest outcomes. Efficacy quantifies physics, whereas yield quantifies biological conversion within a multi-variable living system.
To build a profitable, repeatable commercial cultivation enterprise, operators must close the gap between spec-sheet efficiency and actual grams per kilowatt-hour (g/kWh). Doing so requires looking past marketing numbers, understanding how photons interact with the crop canopy, and mastering the environmental bridging factors that translate raw light into harvested biomass.
Table of Contents
Reading the Metric Behind the Marketing
To evaluate commercial grow lights accurately, cultivation executives must understand what the industry’s primary efficiency metric actually measures. Photosynthetic Photon Efficacy (PPE), expressed in micromoles per joule (μmol/J), defines how effectively a lighting luminaire converts input electrical energy into photosynthetically active radiation (PAR, spanning 400 to 700 nanometers, or ePAR up to 750 nm).
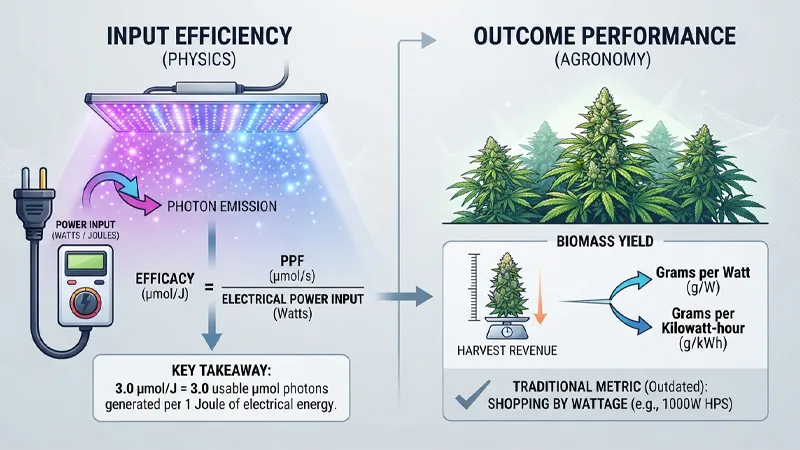
Mathematically, efficacy is calculated by dividing total Photosynthetic Photon Flux (PPF, measured in μmol/s) by total electrical power input (Watts, or Joules per second):
Efficacy (µmol/J) = Photosynthetic Photon Flux (µmol/s)/Electrical Power Input (Watts)
(Where 1 Watt equals 1 Joule per second).
Key takeaway: A fixture rated at 3.0 μmol/J generates 3.0 micromoles of usable PAR photons for every single joule of electrical energy drawn from the facility panel.
This metric is essential for calculating electrical efficiency, but it clarifies a crucial boundary: input efficiency measures physics, whereas outcome performance measures agronomy.
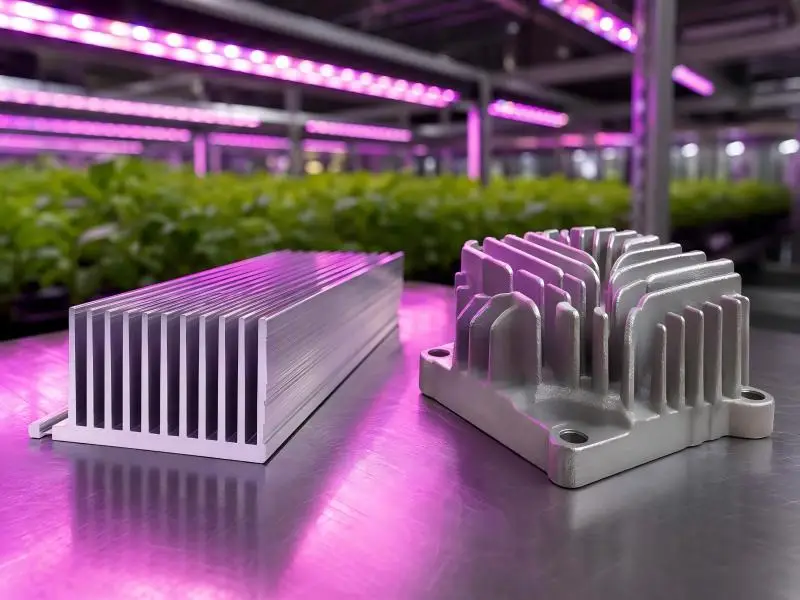
Input efficiency tells you what comes out of the aluminum heat sink when electricity flows through the driver and LED chips. Outcome performance—measured in grams per watt (g/W) or grams per kilowatt-hour (g/kWh)—tells you how efficiently the plant canopy captures those emitted photons, drives carbon fixation via photosynthesis, and allocates metabolic energy into dense flower or fruit biomass.
For decades, traditional indoor growers evaluated fixtures using electrical wattage—shopping for “1000W HPS” or “600W metal halide” systems. In modern horticultural engineering, watts are a notoriously weak predictor of crop success. Wattage merely indicates how much power a fixture draws from your electrical infrastructure; it reveals nothing about how many photons are generated or where those photons land.
Shopping by wattage is equivalent to evaluating a delivery fleet purely by how many gallons of fuel its trucks burn, rather than how many tons of cargo they deliver. Commercial growers must shop by usable photons and photon efficacy, recognizing that while μmol/J dictates electrical operating costs, crop canopy management determines harvest revenue.
Why a Higher μmol/J Doesn’t Guarantee More Yield
The Ceiling, Not the Outcome
Understanding why high-efficacy fixtures sometimes fail to deliver proportional harvest gains requires viewing light efficacy as an environmental ceiling rather than a guaranteed harvest yield.
A high grow light efficacy μmol/J rating raises the upper theoretical limit of what your crop canopy can achieve for a given power footprint. It provides the biological engine with a higher volume of raw photon fuel per kilowatt-hour. However, the fixture itself cannot force the plant to convert those photons into dry biomass.
If the surrounding cultivation environment, irrigation strategy, or canopy structure cannot process that influx of light, the extra photons are lost to photo-inhibition, non-photochemical quenching (heat dissipation), or unabsorbed floor spill. In short, efficacy sets the potential ceiling, but agronomic management determines how close your harvest gets to that ceiling.
Sets the Maximum Theoretical Photon Ceiling per kWh v PPFD Uniformity | DLI | CO2 | VPD | Canopy Pruning | Microclimate v
LIGHT FIXTURE EFFICACY (μmol/J) AGRONOMIC BRIDGING FACTORS REALIZED CROP YIELD (g/W or g/kWh Harvest)
The Bridging Factors That Decide Your Results
Closing the gap between spec-sheet efficacy and real-world harvest weights requires mastering five critical environmental and agronomic bridging factors:
- Canopy PPFD uniformity: Efficacy dictates total photon output from the fixture, but fixture optics and layout dictate how evenly those photons cover the bench. If a room averages 1,000 μmol/m²/s but suffers from severe center hotspots (1,400 μmol/m²/s) and edge drop-offs (500 μmol/m²/s), plants in the center experience light stress and thermal quenching, while edge plants remain light-starved. A lower-efficacy system with 92% canopy uniformity will consistently outperform a higher-efficacy system with 70% uniformity.
- Daily Light Integral (DLI) & photoperiod optimization: DLI measures the total cumulative moles of photons delivered to a square meter over 24 hours (mol/m²/day). High μmol/J fixtures make it energy-efficient to reach target DLIs (e.g., 40–50+ mol/m²/day for high-light commercial crops), but if photoperiod timing or intensity curves are mismanaged, plants cannot process the daily photon load.
- CO₂ enrichment: Photosynthesis relies on a strict stoichiometric balance between photon absorption and carbon assimilation. Under ambient CO₂ levels (≈400 ppm), crop photosynthesis saturates at moderate light intensities (600–800 μmol/m²/s). Deploying high-efficacy LED fixtures delivering 1,100+ μmol/m²/s without elevating CO₂ to 1,200–1,500 ppm forces the plant into carbon starvation, rendering the extra high-efficacy photons biologically useless.
- Vapor pressure deficit (VPD) & thermal management: LED fixtures emit far less radiant heat (infrared) toward the canopy than legacy High-Pressure Sodium (HPS) lamps. While this dramatically lowers HVAC cooling loads, it also lowers leaf surface temperature by 2°C to 4°C. If ambient room temperatures and humidity are not adjusted to maintain an optimal transpiration VPD (1.1–1.4 kPa in flower), stomata close, nutrient transport halts, and yield plummets despite massive light levels.
- Canopy pruning & light penetration: High photon flux at the top leaves provides zero value if dense upper foliage blocks light from penetrating middle and lower bud sites. Active canopy management—selective defoliation, lollipoping, and trellising—ensures that photons drive active photosynthesis throughout the full canopy depth.
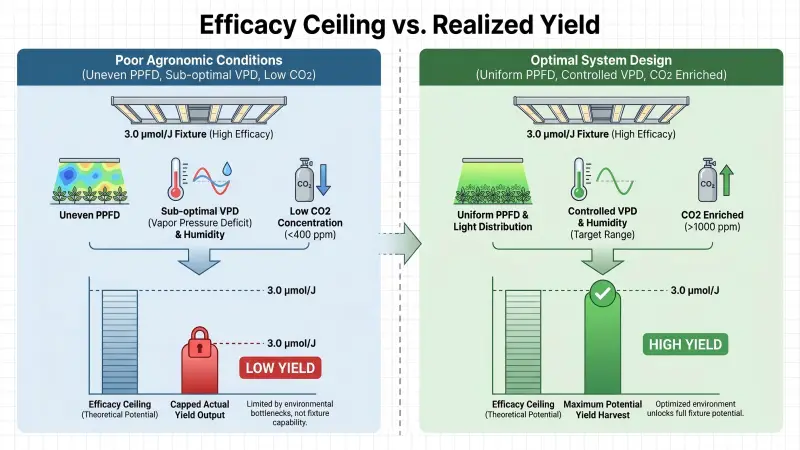
Pro tip: A high-efficacy 3.0 μmol/J fixture mounted improperly or operated in an un-enriched, thermally mismanaged room will routinely underperform a 2.3 μmol/J fixture deployed in a fully optimized, CO₂-enriched microclimate with 90%+ PPFD uniformity.
Commercial Yield Benchmarks: What’s Actually Achievable
When evaluating facility upgrades or new facility builds, procurement teams must translate abstract photon metrics into concrete yield outcomes and financial models. According to MSU Horticultural Lighting Research, commercial lighting efficiency has progressed rapidly over the past decade, dramatically shifting baseline performance expectations.
| Lighting System Tier | Fixture Efficacy Range (μmol/J) | Typical Harvest Yield (g/W) | Commercial Yield Metric (g/kWh) | Primary Limitation / Operational Characteristic |
|---|---|---|---|---|
| Legacy 1000W DE HPS | 1.6 – 1.9 μmol/J | 0.45 – 0.76 g/W | 450 – 760 g/kWh | High radiant heat, rapid lumen decay, high HVAC load |
| Entry-level commercial LED | 2.1 – 2.4 μmol/J | 0.70 – 0.95 g/W | 700 – 950 g/kWh | Basic spectra, moderate uniformity, basic drivers |
| High-efficacy commercial LED | 2.5 – 2.9 μmol/J | 0.95 – 1.25 g/W | 950 – 1,250 g/kWh | Full-spectrum, passive aluminum cooling, uniform optics |
| Elite commercial LED System | 3.0 – 3.3+ μmol/J | 1.20 – 1.60+ g/W | 1,200 – 1,600+ g/kWh | Premium diodes, optimized CO₂/VPD, >90% uniformity |
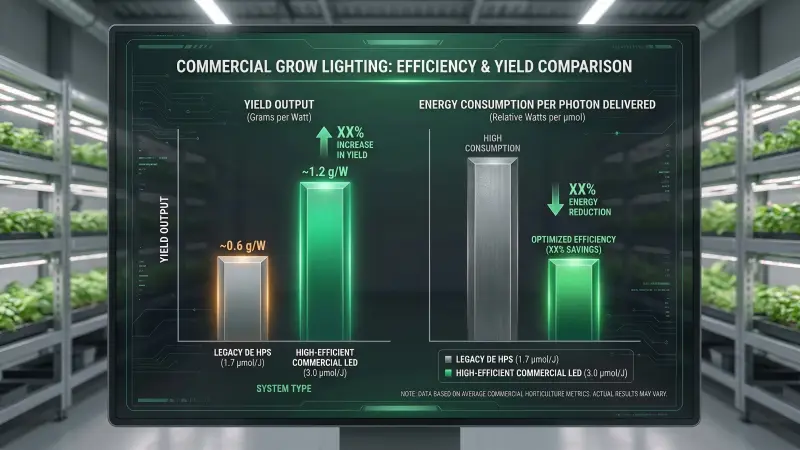
Modern high-efficacy LEDs operating in the 2.5 to 3.0+ μmol/J range deliver roughly double the photon efficacy of legacy DE HPS systems. When deployed within well-controlled environmental parameters, these LED systems allow commercial facilities to jump from traditional HPS yields of 0.50–0.65 g/W to reliable commercial baselines of 1.10–1.35+ g/W.
The ROI Math: Beyond Direct Energy Savings
The financial return on investment (ROI) for high-efficacy LEDs extends far beyond the direct electric meter savings of the lighting circuit itself:
- Direct lighting electricity reduction: Delivering an equivalent canopy PPFD (e.g., 1,000 μmol/m²/s) with a 3.0 μmol/J LED fixture requires roughly 40% to 48% less electrical power than a 1.7 μmol/J HPS system. Over a 100-fixture commercial flower room operating 12 hours per day, this translates into tens of thousands of dollars in direct annual electrical savings.
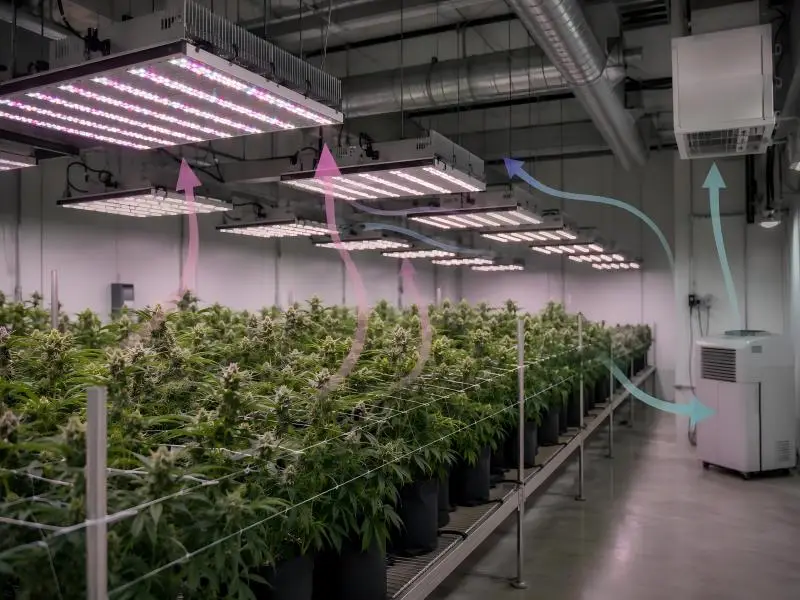
- HVAC tonnage & thermal load reductions: Because LEDs convert a significantly higher percentage of electrical energy into visible photons rather than radiant heat, the thermal load on facility HVAC systems is reduced by 30% to 35%. For every kilowatt saved on lighting power draw, facility operators save an additional 0.33 kW in HVAC compressor load.
- Total Cost of Ownership (TCO) Wins: Combining lower lighting utility bills, reduced HVAC capital expenditure (smaller chiller/dehumidifier sizing), lower maintenance costs (eliminating annual HPS bulb replacements), and local utility rebate incentives creates payback periods ranging between 10 to 18 months for commercial retrofits.
Spotting Misleading Efficacy Claims Before You Buy
As commercial demand for high-efficacy lighting has accelerated, single-number marketing tactics have created significant confusion for procurement teams. Buyers must learn to identify common industry red flags before issuing purchase orders:
- Chip-level vs. fixture-level efficacy: The most pervasive misleading practice is advertising chip-level efficacy rather than complete luminaire efficacy. LED chip manufacturers (such as Samsung or Osram) publish diode efficacy figures measured under ideal laboratory conditions: low drive current, 25°C junction temperature, and no optical cover. However, when chips are assembled into a commercial fixture, real-world factors reduce efficacy:
- Driver losses: Commercial LED drivers operate at 92% to 95% efficiency, losing 5% to 8% of power as heat.Thermal droop: In sealed grow rooms, LED junction temperatures run at 65°C to 85°C, reducing diode photon output by 3% to 6%.Optical & lens losses: Protective glass or silicone coatings absorb an additional 2% to 4% of emitted light.
- Cherry-picked test conditions: Manufacturers may run sphere integration tests at dimmed power levels (e.g., operating a 640W fixture at 200W), where diodes run cooler and more efficiently, and publish those boosted numbers as full-power specifications.
- Single-number marketing: A single overall efficacy number ignores spectrum quality, PPFD drop-offs at bench edges, and long-term diode degradation over multi-year commercial operation.
To ensure performance transparency, procurement teams should verify all grow light efficacy μmol/J claims against independent third-party testing protocols, specifically checking the DLC Qualified Products List (DesignLights Consortium QPL). DLC listing guarantees that fixtures have undergone rigorous testing under ANSI/IES LM-79 standards.
The Verification Checklist for Procuring Teams
Before finalizing a commercial lighting contract, require vendors to submit the following four-part documentation packet:
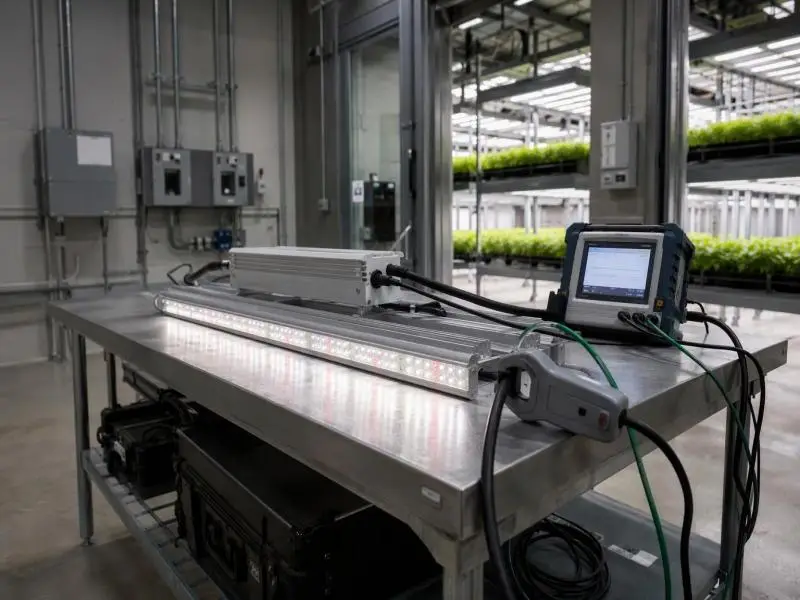
- Third-Party ANSI/IES LM-79 test reports: Ensure an accredited NVLAP laboratory conducted testing on a full, production-grade fixture operating at 100% rated power draw in an integrating sphere and goniophotometer.
- IES/LDT photometric file package: Requires native
.IESor.LDTfiles to run accurate 3D light plan simulations in DIALux or AGi32. Verify that the simulated fixture spacing yields >85% PPFD uniformity across your specific benching layout. - LM-80 & TM-21 lifetime maintenance data: Review LM-80 test reports for individual LED components alongside TM-21 extrapolations. Ensure the fixture maintains Q90 / L90 photon output (retaining >90% of initial light output) for at least 50,000 operational hours.
- Safety certifications & compliance: Confirm full luminaire safety certifications (ETL, UL 8800 for horticultural lighting, CE, RoHS) to satisfy local building codes and electrical inspections.
Commercial equipment suppliers like SLTMAKS are certified in high-efficacy LED systems, document these photometric metrics, DLC listings, and thermal specifications transparently, providing engineering teams with verified IES files and LM-79 reports necessary for multi-site procurement and utility rebate approvals.
Making Efficacy Work for Your Bottom Line
Navigating commercial horticultural lighting requires recognizing that high fixture efficacy is a critical baseline tool—not a silver bullet. Efficacy sets the physical photon ceiling for your facility, but agronomic management, canopy uniformity, and total system integration dictate how much of that potential is realized as profitable crop yield.
WHOLE-FACILITY ROI STRATEGY v MAXIMIZED CROP YIELD & TCO WINS (1.2+ g/W / 1,200+ g/kWh)
v PHYSICAL LIGHTING CAPABILITY
- High μmol/J
- DLC LM-79
- IES uniformity
- Driver quality
v AGRONOMIC SYSTEM ASSIMILATION
- CO2 (1400ppm)
- VPD (1.2 kPa)
- Uniform PPFD
- Pruning / DLI
To maximize your facility’s bottom line:
- Reframe the purchase decision: Move away from evaluating fixtures based on upfront cost per watt or single spec-sheet claims. Evaluate lighting choices based on Total Cost of Ownership (TCO), factoring in fixture longevity, HVAC offset savings, utility rebate eligibility, and expected grams per kilowatt-hour.
- Integrate systems-level controls: Pair high-efficacy LED fixtures with automated climate control systems capable of precisely managing CO₂ injection, temperature ramping, and dehumidification to match elevated photon delivery.
- Optimize bench layouts: Utilize professional light mapping software to eliminate edge drop-offs, ensuring that every square foot of cultivated canopy receives uniform photon density.
FAQ
What is a good μmol/J rating for commercial LED grow lights?
Most modern commercial LED grow lights range between 2.3 and 3.2 μmol/J. While a rating above 2.7 μmol/J is considered high-efficacy, achieving maximum harvest yield depends equally on canopy PPFD uniformity, CO₂ enrichment, and environmental control.
How do I convert μmol/J to harvest yield in grams per watt (g/W)?
There is no direct mathematical conversion because μmol/J measures input electrical efficiency to photon output, while g/W measures biological biomass conversion. High μmol/J fixtures raise the theoretical yield ceiling, but agronomic management determines the final g/W ratio.
Why are my yields low despite using high 3.0 μmol/J LED fixtures?
Low yields with high-efficacy LEDs usually result from environmental bottlenecks, such as poor PPFD uniformity across the bench, insufficient CO₂ levels (under 1,200 ppm), improper Vapor Pressure Deficit (VPD), or reduced leaf surface temperatures.
What is the difference between PPF, PPFD, and PPE (μmol/J)?
PPF (μmol/s) measures total light output per second; PPFD (μmol/m²/s) measures light intensity arriving at the plant canopy; and PPE (μmol/J) measures how efficiently the fixture converts electrical power into photons.
Does upgrading to high μmol/J LEDs reduce facility HVAC cooling loads?
Yes. High-efficacy LEDs convert a greater percentage of power into visible light rather than radiant infrared heat, reducing facility thermal loads and lowering HVAC cooling demands by 30% to 35%.
Conclusion
A high grow light efficacy μmol/J rating is a powerful starting point for commercial indoor cultivation, but it is never the whole story. Efficacy tells you how efficiently a fixture converts electricity into light; it does not guarantee how effectively your crop converts that light into revenue.
To achieve consistent, high-quality harvests at scale, facility operators must move beyond marketing specifications. Measure your actual canopy PPFD distribution, monitor leaf temperatures, optimize environmental parameters to match high light levels, and track true performance in grams per kilowatt-hour.
By treating fixture efficacy as one vital component within a broader, systems-level agronomic strategy, commercial growers can confidently close the gap between spec-sheet expectations and bottom-line profitability.