Introduction
Hitting ≥90% PPFD uniformity on a vertical rack tier is less about chasing peak intensity and more about reducing the spread between the brightest and dimmest zones your crop experiences. When that spread is large, you end up tuning recipes, irrigation, and harvest timing around the worst tray positions—creating variability, waste, and rework.
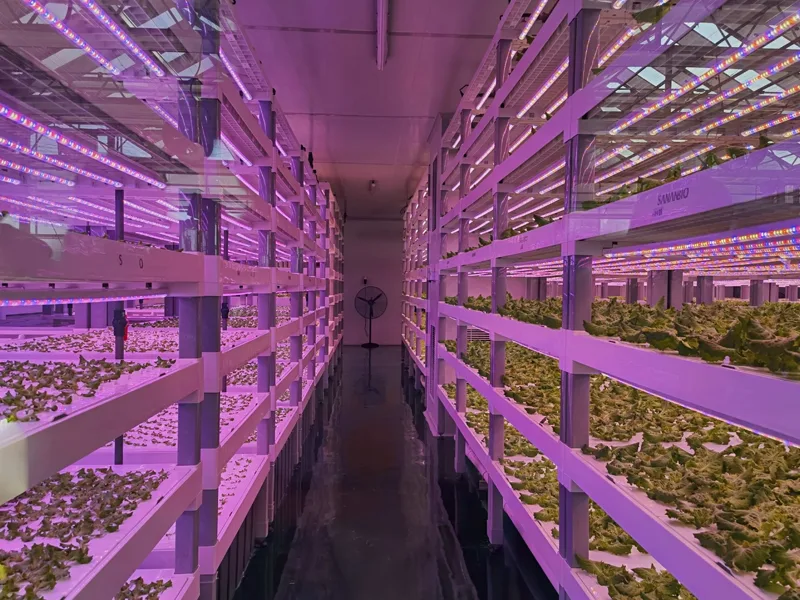
In vertical farming, light uniformity shows up everywhere: inconsistent size grades, uneven coloration, unpredictable time-to-harvest, and extra labor spent rotating trays or rebalancing vertical farm rack lighting plans. It also complicates climate tuning—hot spots can drive localized leaf temperature and transpiration, which then feeds back into humidity and disease risk.
This guide focuses on what operators can control: the right metrics, layout levers (fixture type, optics, spacing, height), how to map PPFD properly, and how to commission and document the result so it’s repeatable across tiers and sites.
Table of Contents
Metrics that matter
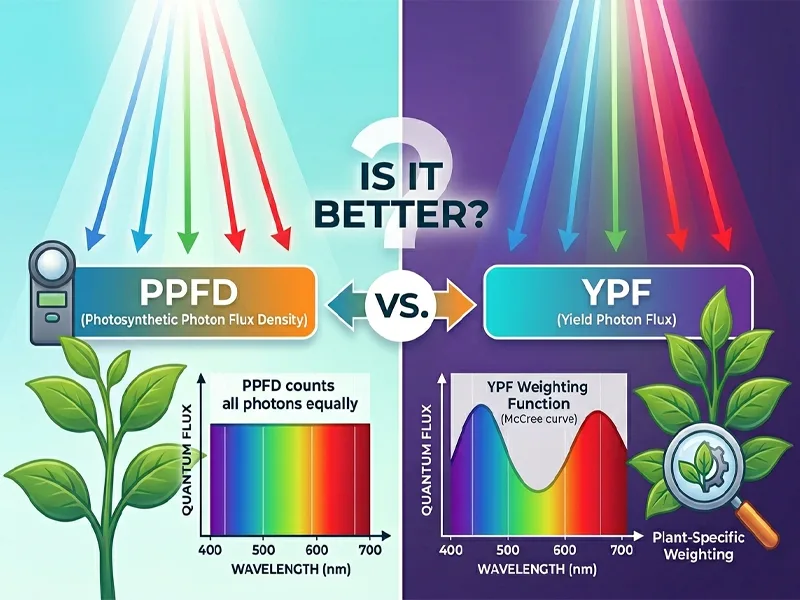
PPFD, DLI, PPF, PPE basics
- PPFD (photosynthetic photon flux density) is the instantaneous photon density at the canopy plane, measured in μmol·m⁻²·s⁻¹. It’s what you map when you’re checking uniformity.
- DLI (daily light integral) is the daily photon dose (mol·m⁻²·day⁻¹). It connects PPFD to photoperiod—useful when you’re balancing energy, heat, and production timing.
- PPF (photosynthetic photon flux) is the total photons emitted by a fixture each second (μmol·s⁻¹). It’s a fixture-level number; it does not tell you distribution.
- PPE (photosynthetic photon efficacy) is photons per watt (μmol·J⁻¹). It’s the efficiency term you use for energy and ROI modeling.
If you’re sizing supplemental light by dose, SLTMAKS’ DLI/PPFD calculation workflow shows the conversion and how a utilization/uniformity factor affects design headroom: Greenhouse supplemental lighting calculation.
Defining uniformity: min/avg and CV targets
There are two operator-friendly ways to define “90%+ uniformity,” and it’s worth writing both into your acceptance criteria.
- Min/Avg uniformity
- Formula: Uₘᵢₙ/ₐᵥg = PPFDmin ÷ PPFDavg
- Target for “90%+”: Uₘᵢₙ/ₐᵥg ≥ 0.90 on the mapped canopy plane for the tier.
- Coefficient of variation (CV%)
- Definition: CV% = (standard deviation ÷ mean) × 100. See the general definition of coefficient of variation (CV).
- Why it helps: CV penalizes “overall scatter,” not just the single worst point.
- Practical target: set a CV ceiling (for example, ≤10–15% for high-uniformity tiers), and treat higher CV as a tuning/layout problem even if average PPFD looks fine.
Pro Tip: Use both metrics. A layout can hit an acceptable average and still have edge losses that show up as a weak PPFDmin. CV helps you spot “noisy” distributions where the mean hides trouble.
Sampling planes and documentation scope
Uniformity is always conditional on where you measure. For vertical racks, define this up front:
- Sampling plane: typically the canopy plane (or the tray plane for empty-rack commissioning), at a documented distance from the fixture.
- Tier scope: map each tier (clearance, reflectivity, and airflow are rarely identical).
- Operating state: dimming %, spectrum channel settings (if applicable), stabilization time, and ambient conditions.
For auditability, capture the same fields you’d want in a commissioning report: height, grid definition, sensor model, calibration date, and raw readings with coordinates. Gossen’s overview of PPFD metrics and grid-based reporting is a useful reference point for documenting PPFDavg and uniformity ratios like PPFDmin/PPFDmax: Horticulture lighting metrics.
Fixture, optics, and layout (light uniformity on vertical farm racks)
Bar arrays vs. point sources at close canopy
At tight mounting heights (common on racks), the geometry is unforgiving. The closer you get to the canopy, the harder it is for a single “point-ish” source to spread evenly without either:
- pushing intensity into a hot spot under the center, or
- needing more height than the rack can spare.
Bar arrays reduce that problem by distributing emitters across the footprint. In practice, they give you more ways to tune overlap and to correct edge losses with row-by-row dimming or zone trims.
When you’re evaluating bar fixtures for racks, treat photometrics as first-class requirements:
- Request IES/LDT photometric files for modeling,
- Ask for PPFD maps at the mounting heights you can actually run.
- and confirm the compliance paperwork your AHJ (authority having jurisdiction) will care about.
If you’re using SLTMAKS as a supplier candidate, the technical due diligence is the same: request IES/LDT files for your exact rack geometry, and confirm safety/compliance documentation (e.g., ETL in the U.S. from an NRTL (Nationally Recognized Testing Laboratory), plus CE and RoHS where applicable). Also, verify stated PPE (μmol·J⁻¹) from test reports rather than brochure claims.
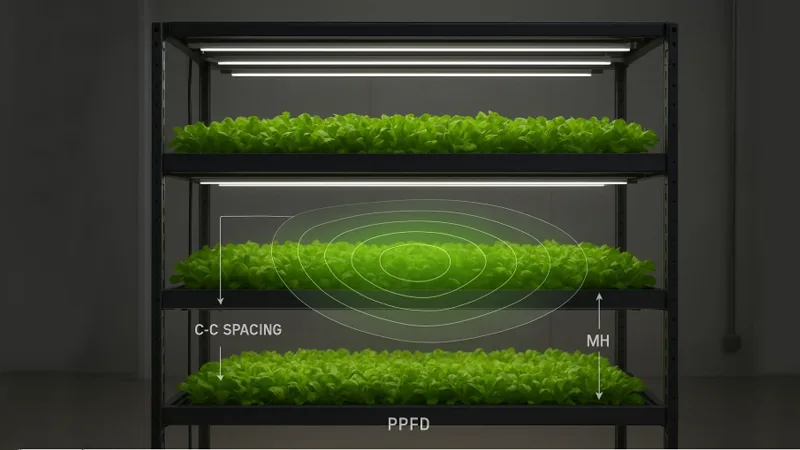
Spacing vs. mounting height (C2C ≈ 0.8–1.2× MH)
For close-canopy bar layouts, uniformity comes down to overlap. As a practical starting point (not a law), use:
- Center-to-center bar spacing (C2C) ≈ 0.8–1.2 × mounting height (MH)
Where:
- C2C is the distance between adjacent bars,
- MH is the distance from the light-emitting surface to the canopy plane you’re designing for.
Why this works: if C2C is too wide for the height, beams don’t overlap enough, and the valleys between bars (and at edges) become your PPFDmin. If C2C is too tight, you can get unnecessary fixture count and “striping” if optics are mismatched.
Use that ratio to set your first layout iteration, then validate two ways:
- Model with the fixture’s IES/LDT file (using your rack reflectivity and real mounting height), and
- Measure with a grid map on an actual tier (or a mock-up bay).
Edge and aisle mitigation strategies
Even when the center of the tier looks clean, edges and aisles usually dominate your uniformity score. Common mitigation levers include:
- Overhang or shifted outer rows: move outer bars closer to the edge line to reduce falloff.
- Staggering: stagger adjacent bars (or rows) so valleys don’t align.
- Edge optics: Use optics that widen distribution at the perimeter while keeping the center controlled.
- Reflective side panels: prefer scattering, matte-white surfaces over mirror-like materials that create localized bright spots.
- Aisle zoning: dedicate a perimeter/aisle zone with independent dimming so you can trim the edges up without over-lighting the center.
Pipp Horticulture’s overview is a useful reminder that geometry and reflectivity are not afterthoughts—uniformity is a system property: 4 strategies for even light distribution in vertical grows.
Measurement and mapping
Grid density and sensor selection
Uniformity claims are only as credible as the measurement method.
- Sensor type: Use a quantum sensor designed for PAR/PPFD measurement with a cosine-corrected diffuser.
- Calibration: record sensor calibration date; treat annual calibration as a baseline.
- Grid density: choose a grid tight enough to resolve valleys between bars and edge losses. If your grid is too coarse, you’ll overestimate uniformity.
As a practical default for commissioning a rack tier:
- start with 8×8 points (64) for a ~1.2 m × 1.2 m tier, or
- 10×10 points (100) for larger tiers.
If you have time constraints, don’t reduce points randomly—keep edge/corner coverage and widen spacing only after you’ve proven the layout is stable.
Procedure to map PPFD and compute min/avg, CV
Use a repeatable workflow so results are comparable across tiers and sites:
- Lock the operating condition
- set dimming %, spectrum setting, and photoperiod state
- record mounting height and tray/canopy reference
- Stabilize
- run at the target dim level until output is thermally stable (log start time and stabilization time)
- Measure the grid
- keep the sensor plane consistent (level, same height)
- record each point with coordinates
- Compute acceptance metrics
- PPFDavg = mean of all points
- PPFDmin = lowest point
- Uₘᵢₙ/ₐᵥg = PPFDmin ÷ PPFDavg
- CV% = (standard deviation ÷ mean) × 100
- Decide what to do next
- if PPFDavg is off target but uniformity is good → adjust dimming first
- if uniformity fails → fix geometry/zoning before increasing intensity
⚠️ Warning: Don’t “optimize” by excluding bad points. If a tray position exists in production, it belongs in your map.
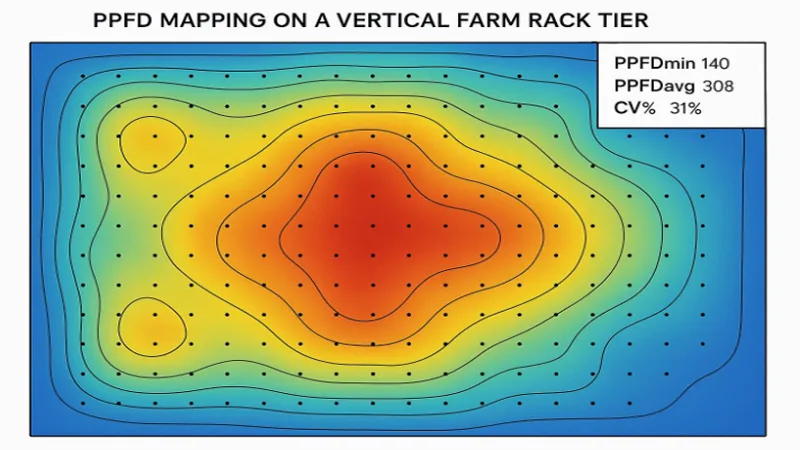
Heatmaps and interpreting outliers
A heatmap is most useful when you interpret it like a diagnostic tool, not a marketing image.
- Hot stripes under bars → optics too narrow for MH, or C2C too tight.
- Cold valleys between bars → C2C too wide for MH, or edge losses not compensated.
- Cold corners / aisle-side losses → perimeter needs a trim zone or edge optics.
- One localized hot spot → mechanical misalignment, reflector issue, or a driver/channel mismatch.
If you’re seeing a few outliers, confirm they’re real:
- Re-check sensor level and shadowing,
- Verify fixture-to-canopy distances at that point,
- Confirm the dimming channel is behaving consistently.
Controls, tuning, and commissioning
Zoning and dimming for balance
Once the physical layout is “close,” controls are the cleanest way to push from good to great.
- Zone by geometry: perimeter vs center, aisle-side vs wall-side, or row-by-row dimming for bar arrays.
- Tune in this order:
- hit PPFDavg at the canopy plane,
- trim perimeter/aisle zones to lift PPFDmin,
- Re-check CV (if CV stays high, geometry/optics still need work).
If you use DLI-based dimming, the acceptance test should still be done at steady output first. Then, validate that the DLI logic achieves the intended dose without creating new uniformity issues at typical dim levels.
Verification checklist and as-built records
Treat uniformity like a commissioning deliverable. At minimum, keep:
- Final rack drawing: mounting height, bar positions, C2C spacing, and any overhang
- fixture bill of materials and zone map (which fixtures are in which dimming zone)
- photometric inputs used (IES/LDT filenames and versions)
- PPFD grid raw data (CSV) + computed PPFDavg, PPFDmin, Uₘᵢₙ/ₐᵥg, CV%
- heatmap images for each tier (date-stamped)
- dimming settings and control logic description (including fail-safe behavior)
This is also where procurement and inspection readiness show up. Your AHJ may ask for documentation related to electrical safety and installation requirements; capturing it early avoids delays.
Maintenance, calibration, and re-tests
Uniformity drifts in real life:
- optics get dusty or film over
- fixtures shift during cleaning/service
- dimming channels drift or get reconfigured
- reflectivity changes (new trays, new liners, paint wear)
Keep a simple re-test cadence:
- spot-check monthly (a small, consistent grid on a reference tier)
- full-map quarterly or after any major change (fixtures, racks, controls)
- Re-calibrate sensors at a defined interval
Compliance, incentives, and ROI
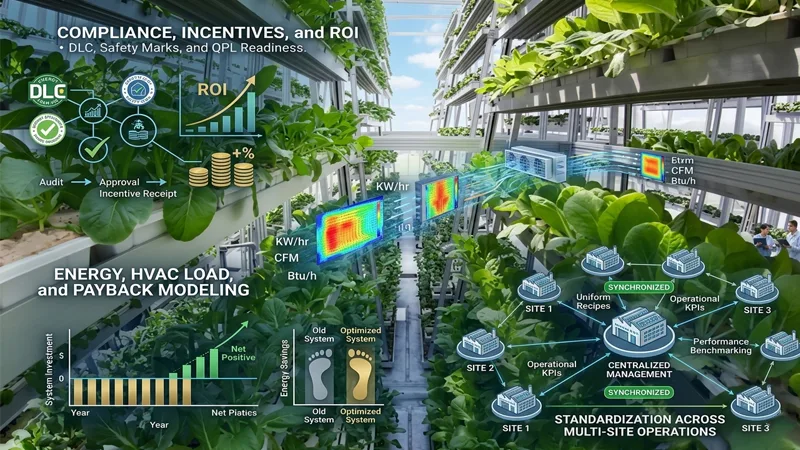
DLC, safety marks, and QPL readiness
If you’re pursuing incentives, understand two separate tracks:
- Safety/compliance for installation and inspection (often requires an NRTL listing in the U.S., such as UL or ETL; plus other region-specific marks).
- Incentive eligibility where applicable (often tied to DLC (DesignLights Consortium) horticulture technical requirements and the Qualified Products List (QPL)).
DLC’s program pages are a useful reference point for what utilities may request: DLC horticulture technical requirements and the DLC Qualified Products List.
The practical takeaway for uniformity work: incentives and audits tend to reward documented performance (photometrics, controllability, commissioning records), not just a nominal fixture spec.
Energy, HVAC load, and payback modeling
Uniformity isn’t only a crop-quality metric. It affects payback in three ways:
- Over-lighting tax: if PPFDmin is low, operators often compensate by raising PPFDavg—spending energy to fix a distribution problem.
- Climate coupling: non-uniform light creates non-uniform transpiration and canopy temperature, which pushes dehumidification and airflow requirements.
- Labor and downtime: manual tray rotation, troubleshooting, and rework all show up as operational costs.
When you model ROI, treat lighting and HVAC as a combined system. SLTMAKS’ discussion of lighting, controls, and system-level tradeoffs in a commercial comparison context is a useful framing reference: LED vs HPS for commercial greenhouse lighting.
Standardization across multi-site operations
If you operate multiple facilities, uniformity targets become a standard you can replicate.
- define a single measurement protocol and acceptance criteria
- keep one “reference tier” design with known results
- version-control IES/LDT inputs and as-built layouts
- require re-commissioning after any retrofit or rack reconfiguration
This turns uniformity from a one-time project into a controllable KPI.
Conclusion
Reaching ≥90% light uniformity on vertical farm racks is realistic when you treat it as a commissioning problem, not a spec-sheet problem.
Start by defining acceptance metrics (PPFDmin/PPFDavg and CV), then design overlap with bar geometry (C2C relative to mounting height), mitigate edge and aisle losses, and validate the tier with a dense PPFD mapping grid. After that, zoning and dimming can take you from “good” to “repeatable,” as long as you document what you built.
The documentation you should keep is simple but powerful: photometric inputs (IES/LDT), raw PPFD grid data, computed min/avg and CV, heatmaps, zone maps, and as-built dimensions. That package protects you during audits, retrofits, and multi-site rollouts.
Finally, iterate layouts carefully: change one variable at a time, re-map, and avoid increasing PPFDavg to compensate for a distribution issue. Uniformity improvements often pay back twice—once through crop consistency, and again by reducing energy and HVAC overhead tied to variability.
FAQ
How is u002290%+ light uniformityu0022 specifically defined for a vertical rack?
o claim 90%+ uniformity, it is recommended to use two complementary metrics:u003cbru003eu003cstrongu003eMin/Avg Uniformityu003c/strongu003e: The ratio of the minimum PPFD to the average PPFD (Min/Avg = PPFDmin / PPFDavg) should be greater than or equal to 0.90.u003cbru003eu003cstrongu003eCoefficient of Variation (CV%)u003c/strongu003e: This measures the u0022overall scatteru0022 of light; a practical target for high-uniformity tiers is a CV ceiling of less than or equal to 10-15%.
What is the ideal relationship between light bar spacing and mounting height?
For bar arrays at close-canopy distances, a practical starting point is to keep the center-to-center bar spacing (u003cstrongu003eC2Cu003c/strongu003e) approximately u003cstrongu003e0.8 to 1.2 timesu003c/strongu003e the mounting height (u003cstrongu003eMHu003c/strongu003e). If the C2C is too wide relative to the height, the beams will not overlap enough, creating u0022valleysu0022 of low light intensity between the bars.
How can operators mitigate light loss at the edges and aisles of the racks?
Since edges and aisles often dominate the uniformity score, several strategies can be used:u003cbru003eu003cstrongu003eShifted Rowsu003c/strongu003e: Move outer bars closer to the edge line to reduce light falloff.u003cbru003eu003cstrongu003eReflective Panelsu003c/strongu003e: Use matte-white surfaces to scatter light back onto the canopy.u003cbru003eu003cstrongu003eAisle Zoningu003c/strongu003e: Use independent dimming for perimeter zones to u0022trimu0022 or increase light levels at the edges without over-lighting the center.u003cbru003eu003cstrongu003eEdge Opticsu003c/strongu003e: Utilize specific optics designed to widen the distribution at the perimeter.
What are the requirements for a credible PPFD mapping procedure?
To ensure accuracy, the mapping must follow a strict protocol:u003cbru003eu003cstrongu003eSensor Selectionu003c/strongu003e: Use a quantum sensor with a cosine-corrected diffuser.u003cbru003eu003cstrongu003eGrid Densityu003c/strongu003e: Use an u003cstrongu003e8x8 grid (64 points)u003c/strongu003e for a 1.2m x 1.2m tier, or a u003cstrongu003e10x10 grid (100 points)u003c/strongu003e for larger tiers.u003cbru003eu003cstrongu003eHonest Reportingu003c/strongu003e: Never exclude u0022bad pointsu0022 from the calculation; if a tray position exists in production, it must be included in the map.
Why is uniformity considered an ROI factor rather than just a crop quality metric?
Poor uniformity impacts the bottom line in three major ways:u003cbru003eu003cstrongu003eEnergy Wasteu003c/strongu003e: Operators often raise the overall light intensity to compensate for a low PPFDmin, effectively paying an u0022over-lighting taxu0022.u003cbru003eu003cstrongu003eHVAC Loadu003c/strongu003e: Non-uniform light creates uneven transpiration and canopy temperatures, complicating humidity control and increasing disease risk.u003cbru003eu003cstrongu003eLabor Costsu003c/strongu003e: Inconsistent growth leads to extra labor spent rotating trays or managing unpredictable harvest timings.