Engineer the perfect light spectrum for optimal plant growth. Boost your yields and cultivate year-round with our energy-efficient LED solutions. Tell us your needs for a customized lighting strategy and quote.
Introduction: Why Lighting Carries the Most Financial Weight
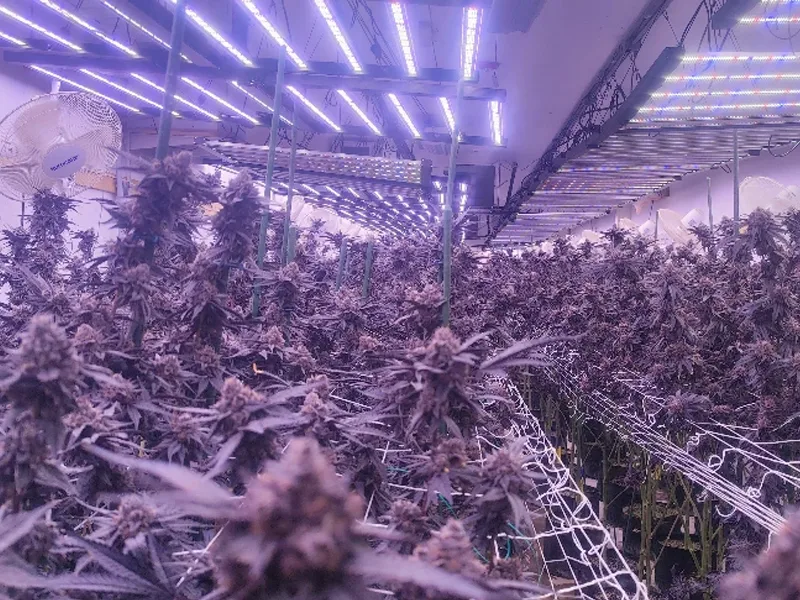
In a controlled indoor cannabis facility, light is the only production input that cannot be borrowed from the natural environment. Temperature, humidity, and CO₂ concentration can all be supplemented or modulated using ambient conditions, but light must be generated in full by the facility itself. This structural reality places the lighting system at the center of every commercial operation.
From a yield standpoint, photosynthetic rate sets the ceiling for dry matter accumulation. When nutrition is adequate, and CO₂ is properly managed, the photon flux density reaching the canopy — measured as PPFD — is the primary variable limiting output. From a quality standpoint, spectral composition and photoperiod rhythm govern the biosynthetic pathways of THC, CBD, terpenes, and other secondary metabolites. These compounds are the core value carriers in commercial cannabis.
From a financial standpoint, electricity consumption by the lighting system typically accounts for 40% to 60% of total operating expenditure in a commercial indoor facility. At that cost weight, every percentage-point difference in efficiency in fixture selection compounds across multi-batch operating cycles into measurable margin divergence.
SLTMAKS, as a commercial-grade LED grow light manufacturer, serves large-scale cannabis facilities across North America and Europe. This guide uses five growth stages as its primary axis and integrates the engineering parameters of the SLTMAKS STG series to deliver an actionable decision framework for commercial cannabis lighting procurement and operations.
Table of Contents
Lighting Fundamentals Every Commercial Grower Must Know
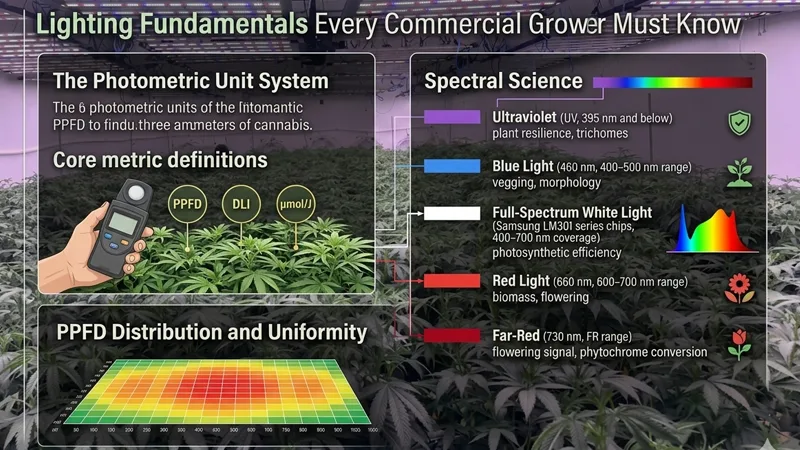
The Photometric Unit System
Two parallel measurement systems exist in horticultural lighting. Confusing them introduces systematic errors into fixture selection and parameter setting.
The radiometric system uses the watt (W) as its base unit, measuring total electromagnetic radiation energy without distinguishing which wavelengths are biologically relevant to plants. Lumens (lm) and lux are radiometric derivatives weighted by the human eye’s spectral sensitivity curve. They carry no direct reference value for plant physiology. Using a lux meter to measure plant light levels is one of the most common — and costly — errors in indoor cultivation.
The photometric quantum system counts photons rather than energy, which directly corresponds to the physical mechanism of photosynthesis. Plants absorb photons, not watts. Photon flux density is therefore the true driving variable behind plant response.
Core metric definitions:
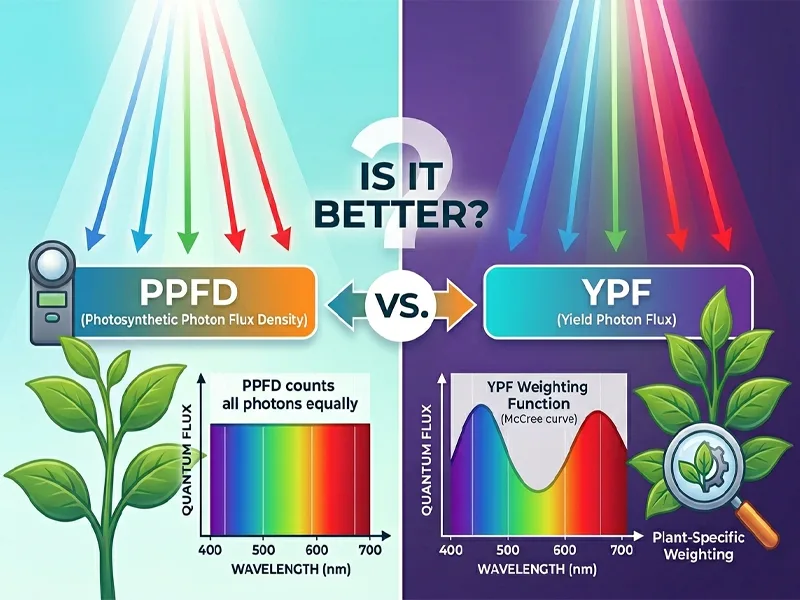
PPFD (Photosynthetic Photon Flux Density) is measured in μmol/m²/s. It quantifies the number of photosynthetically active photons (400–700 nm) landing on one square meter of canopy surface per second. PPFD is an instantaneous intensity metric reflecting conditions at a single point in time.
DLI (Daily Light Integral) is measured in mol/m²/day. It quantifies the total photosynthetically active photons accumulated at the canopy over an entire day. The formula is: DLI = PPFD × photoperiod hours × 3.6 / 1000. DLI is the primary metric for predicting yield potential. Because the same PPFD level at different photoperiod lengths produces different DLI values, adjusting light-on hours is one of the primary levers for electricity cost optimization without sacrificing photon delivery.
PPE (Photosynthetic Photon Efficacy) is measured in μmol/J. It quantifies how many photosynthetically active photons a fixture produces per joule of electricity consumed. PPE is the efficiency metric at the fixture level and the most important dimension for B2B procurement comparison. SLTMAKS STG series fixtures exceed 3.0 μmol/J and carry DLC Horticulture certification, qualifying them for utility rebate programs across major North American markets.
Spectral Science: What Each Wavelength Band Actually Does
Spectrum value does not increase linearly with bandwidth coverage. Different wavelength bands act through fundamentally different physiological mechanisms. Commercial cultivation requires active spectral management by growth stage and target compound, not passive reliance on a fixed output.
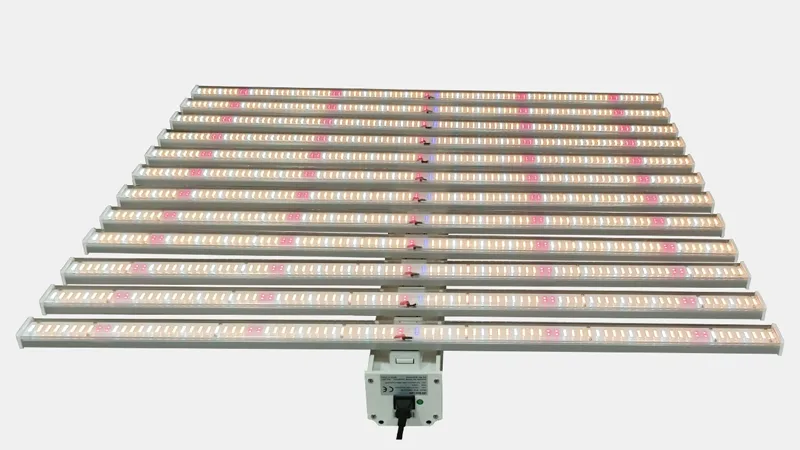
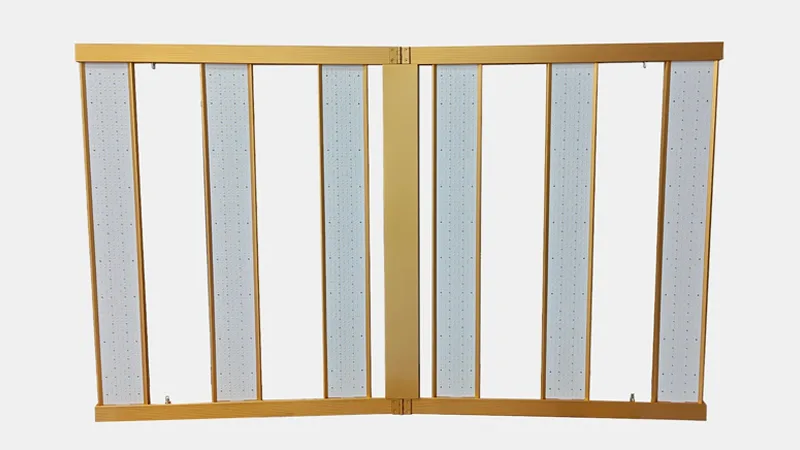
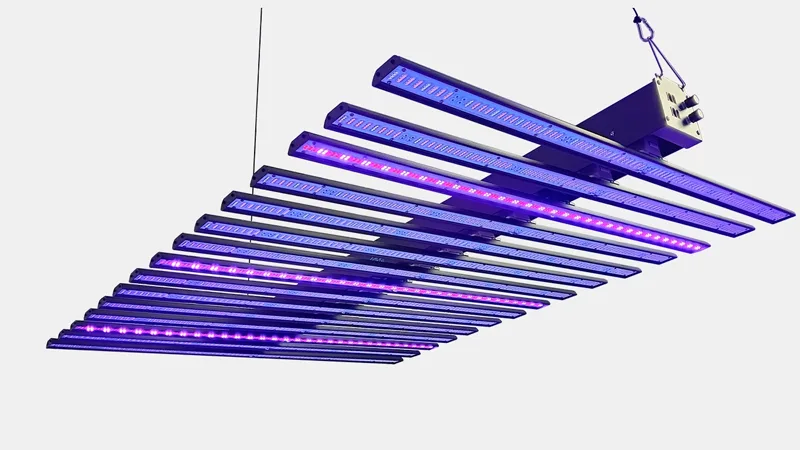
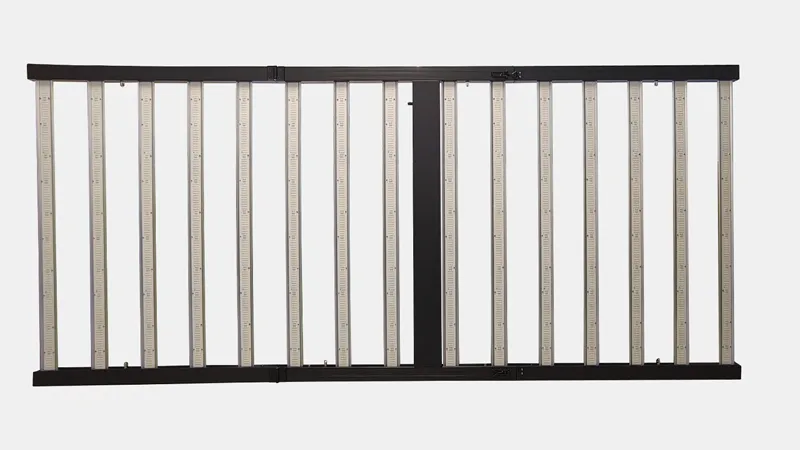
SLTMAKS STG series fixtures use a multi-chip combination: Samsung full-spectrum white LEDs + Epistar 660 nm plant red + 460 nm blue + 730 nm far-red + 395 nm UV. This architecture covers the following functional bands within a single fixture:
Ultraviolet (UV, 395 nm and below)
UV photons function as a stress signal, not a nutritional input. UV-A (315–400 nm) and UV-B (280–315 nm) radiation activate secondary metabolic defense systems, upregulating flavonoid and resin compound biosynthesis. In cannabis cultivation, UV supplementation during the late flowering window shows experimentally supported positive correlation with THCA synthase activity and final THC accumulation. The STG series integrates a 395 nm UV chip. UV output intensity can be controlled independently through the dimming controller during late flower without requiring a separate UV fixture, reducing system complexity.
Blue Light (460 nm, 400–500 nm range)
Blue light acts through phototropin and phytochrome B (phyB) receptors to regulate stomatal opening, chlorophyll synthesis, leaf orientation, and internode elongation suppression. In the vegetative stage, the blue-to-red ratio directly determines plant architecture compactness. Insufficient blue light causes stem elongation (stretch). Excessive blue light over-suppresses extension and limits leaf area development. The 460 nm peak chosen for the STG series targets one of the highest-efficiency absorption peaks for blue-band photosynthesis, rather than using a broadband blue chip that wastes photons outside the target absorption range.
Samsung full-spectrum white chips form the primary photon volume in the STG series. The key advantage of white chips is their coverage of the green band (500–600 nm). Green light penetrates the canopy significantly more deeply than red or blue wavelengths, providing meaningful photosynthetic supplementation to mid- and lower-canopy leaves. In high-density commercial grows, proportional green content improves vertical PPFD distribution uniformity, which raises whole-canopy photosynthetic efficiency beyond what the top-layer PPFD measurement suggests.
Red Light (660 nm, 600–700 nm range)
Red light drives the highest photosynthetic efficiency per photon. The 660 nm peak aligns precisely with the absorption peaks of both chlorophyll a and chlorophyll b. The Epistar 660 nm dedicated plant red chip emits at the exact absorption optimum. Compared to broadband red chips, this narrow peak reduces wasted photons outside the target absorption window, delivering more useful photons per unit of input power.
Far-Red (730 nm, FR range)
The primary mechanism of 730 nm far-red is the Emerson Enhancement Effect: when 660 nm red light and 730 nm far-red are delivered simultaneously, photosynthetic rate is measurably higher than the sum of either band delivered independently. In full-spectrum operating mode, the STG series produces this synergistic output from its integrated 730 nm IR chip, generating photosynthetic drive beyond what PPE figures (calculated on 400–700 nm only) capture. Additionally, End-of-Day far-red pulses at 730 nm shift phytochrome state toward Pr, equivalent to extending dark period signal strength and accelerating the flowering response.
PPFD Distribution and Uniformity
Spatial PPFD uniformity is one of the most commercially consequential parameters that growers consistently underweight. A single-point PPFD reading cannot represent the light environment across an entire growing zone. Multi-point grid measurements producing a PPFD distribution map are required.
Uniformity assessment uses the coefficient of variation (CV = standard deviation/mean). Commercial cultivation targets a CV below 15%, meaning PPFD variation across the grow zone stays within ±15% of the mean. A high CV means some plants operate below light saturation for their entire lifespan, while others receive excess photons, producing measurable within-batch yield and quality inconsistency.
Factors affecting uniformity include fixture mounting height (increasing height expands coverage but reduces intensity), fixture spacing (excessive spacing creates dark zones), reflective surfaces (wall and ceiling reflectivity affect edge-zone supplementation), and room geometry.
SLTMAKS Free DIALux Light Mapping Service
SLTMAKS provides complimentary DIALux photometric simulation for B2B procurement clients. Based on facility floor plan dimensions and PPFD targets, SLTMAKS engineers produce a fixture layout plan and PPFD distribution heat map, verifying uniformity before hardware ships. This eliminates retrofit waste from suboptimal spacing decisions. Submit facility parameters at [sltmaks.com](https://www.sltmaks.com) to request this service.
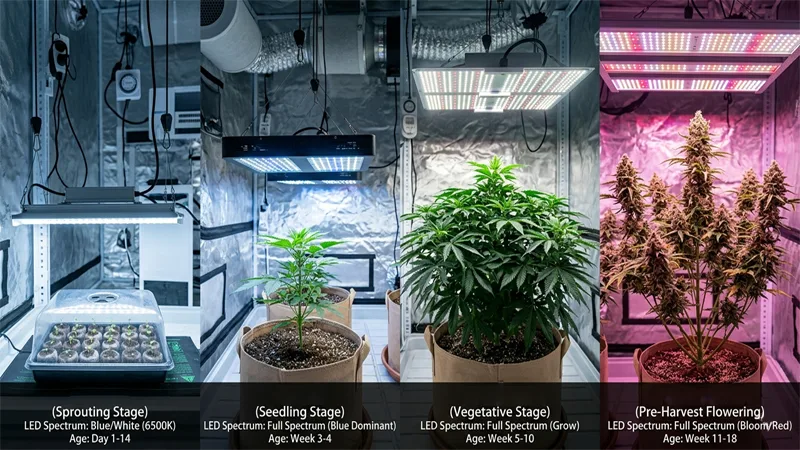
Full-Cycle Commercial Cannabis Lighting Strategy
Stage 1: Seed Germination (Days 0–7)
Stage objective: Trigger seed imbibition, support radicle emergence through the seed coat, and establish initial photosynthetic capacity before the seed’s own nutrient reserves are depleted.
Light Intensity: Germination requires minimal light. Recommended PPFD: 75–150 μmol/m²/s. Target DLI: 5–8 mol/m²/day. Excessive light intensity at this stage risks photo-oxidative damage to the delicate hypocotyl.
Photoperiod: 18/6 (light/dark) is the standard starting configuration. Some operators apply 48–72 hours of complete darkness at the onset of germination to simulate soil conditions, but results vary by cultivar. No large-scale protocol change is warranted without cultivar-specific validation.
Spectrum: Blue-dominant spectrum, equivalent to a 5000–6500K color temperature, suppresses hypocotyl elongation and promotes compact seedling architecture.
Equipment Configuration: STG series fixtures, via 0–10V dimming interface or RJ control port, can be reduced to 10–20% of rated output to cover germination-stage low-light requirements. A single STG fixture at 60–80 cm mounting height at 10–15% power covers two to three 1.2 m × 2.4 m germination trays within the 75–150 μmol/m²/s target range.
Stage 2: Seedling and Clone Propagation (Weeks 1–3)
Stage objective: After germination, the plant enters the root establishment phase. For clonal propagation (cuttings), the primary task is inducing adventitious root formation while maintaining cutting viability.
Light Intensity: Seedling stage PPFD: 200–400 μmol/m²/s. Target DLI: 12–20 mol/m²/day. Before rooting is complete, the cutting’s water absorption capacity is limited. Lower light intensity reduces leaf transpiration and prevents wilting. After rooting (typically 7–14 days), gradually increase intensity toward the upper end of this range.
Photoperiod: 18/6 is the standard configuration for seedlings, establishing photoperiod continuity with the vegetative stage. Some propagation protocols use 24/0 continuous light for clones to maximize photosynthetic support for root development. However, certain cultivars under continuous light exhibit leaf chlorosis or abnormal internode development. Small-scale cultivar validation is recommended before applying 24/0 at the commercial scale.
Commercial Clone Room Layout: Commercial-scale clone rooms typically use multi-tier racking to maximize space utilization. The SLTMAKS STG series uses an external SOSEN driver design, allowing the driver to be mounted on the rack exterior or in an adjacent corridor rather than inside the growing zone. This removes a heat source from the high-humidity environment (70–80% RH) where clones are maintained, and reduces driver failure risk in wet conditions. STG series fixtures meet IP rating requirements for high-humidity cultivation environments.
Stage 3: Vegetative Growth (Veg, Weeks 2–8)
Stage objective: Build a structural canopy framework, expand total leaf area, and establish the node count that will ultimately determine flower site density. Veg duration is a key economic decision — longer veg produces higher per-plant yield potential but extends room occupancy time and operating costs per cycle.
Staged Intensity Ramp:
Early Veg (Weeks 1–2): PPFD 400–600 μmol/m²/s, DLI target 20–28 mol/m²/day. The plant is transitioning from seedling physiology, with the photosynthetic system still expanding. Aggressive early intensity increases the risk of photo-oxidative damage.
Mid-to-Late Veg (Week 3 through flip): PPFD 600–900 μmol/m²/s, DLI target 28–40 mol/m²/day. As leaf area expands and root systems mature, the plant’s capacity to process higher photon flux increases substantially. With CO₂ maintained at 1000–1200 ppm, the light saturation point can be pushed higher.
STG series fixtures accept 100–277V wide-input voltage, compatible with both North American (120V/240V) and European (220–240V) grid standards without intermediate step-down equipment, which simplifies multi-facility electrical deployment.
Photoperiod Selection: 18/6 is the commercial standard for veg, balancing photosynthetic accumulation time against the plant’s need for dark-period metabolic processes. 20/4 is an aggressive option that can reduce veg duration by 20–30% in some cultivars, but at a higher electricity cost and with cultivar-dependent physiological stress risk. 24/0 continuous light in cannabis veg shows strong cultivar dependency — certain Indica-dominant varieties develop leaf chlorosis under continuous light, likely from photosynthetic system overload or disrupted circadian signals. Do not apply 24/0 at commercial scale without prior cultivar-specific validation.
Spectral Management: The spectral objective in veg is to promote vegetative growth while maintaining compact architecture. Recommended blue-to-red ratio (B: R): 1:2 to 1:3, with blue comprising 20–30% of total photon output. The STG series produces a natural broadband B: R distribution through its Samsung white chip base and Epistar 660 nm red supplement. No additional spectral adjustment is required to cover veg-stage spectral requirements.
CO₂ and Light Intensity Co-optimization: At PPFD above 600 μmol/m²/s, ambient CO₂ concentration (~420 ppm) becomes the limiting factor for photosynthetic rate. Supplementing CO₂ to 1000–1500 ppm can increase photosynthetic rate by 30–50% under equivalent light conditions. Beginning CO₂ supplementation from mid-veg onward is a prerequisite for fully realizing the yield potential that STG series high-PPE fixtures make physically possible.
Stage 4: Flowering (Weeks 8–11)
The flowering stage carries the highest technical density of any phase in the full cycle and has the largest impact on final yield and quality. An error in the flowering-stage lighting strategy produces consequences that cannot be corrected downstream.
Photoperiod Transition: The Most Consequential Single Decision
Most cannabis varieties are short-day plants. Flowering is triggered by dark period length, not light period length. When the continuous dark period exceeds the cultivar’s threshold (typically 12 hours), the plant detects sufficient phytochrome Pfr-to-Pr conversion and initiates floral differentiation. The commercial standard transition is to switch from 18/6 (veg) to 12/12 (flower).
Dark Period Integrity: The Engineering Baseline
Cannabis plants in flower are highly sensitive to dark period light contamination. Light as low as 0.01 μmol/m²/s — equivalent to moonlight — is sufficient to reset phytochrome state and interrupt the flowering signal.
In a commercial facility, dark period light contamination sources include: door frame gaps, control panel indicator lights, timer display screens, CO₂ sensor LEDs, and power strip indicator lights. Every one of these points must be engineered out during facility design.
The typical consequence of dark period light contamination is reversion (plants resuming vegetative growth during flower) or feminized plants producing male flowers (hermaphroditism). The latter renders an entire flowering batch non-viable. At commercial scale, a single dark period light leak incident can represent losses in the tens to hundreds of thousands of dollars per batch.
Blackout standard: all wall seams, door frames, and ventilation duct entries must be sealed to an engineering standard. The pass test is: after 10 minutes of full dark adaptation, no light source is visually detectable.
SLTMAKS STG series fixtures produce zero residual light when de-energized. Driver power-off response time is under 1 second, eliminating tail-glow interference during photoperiod transitions.
Autoflowering Cultivar Exception
Autoflowering varieties containing Cannabis ruderalis genetics do not require photoperiod triggering. They flower automatically on a timeline regardless of light schedule, and can be run at 20/4 or 18/6 throughout the entire cycle. This simplifies room management at the cost of lower average yield compared to photoperiod-dependent varieties.
After the photoperiod switch, plants enter a 1–2 week stretch phase during which internodes rapidly elongate. Maintaining late-veg intensity levels is appropriate here; pushing to peak flower intensity immediately is not necessary and increases the risk of thermal stress during structural change.
Spectral Shift: Transition to a flower spectral profile with a higher red ratio (R: B = 4:1). Red light at 660 nm is the primary Pfr phytochrome signal. Strengthening the red proportion is correlated with floral differentiation signal intensity. STG series fixtures allow independent dimming of the Epistar 660 nm red channel relative to the Samsung white base, enabling a smooth spectral transition from veg to early flower profile.
End-of-Day Far-Red (EOD FR) Technique
In the final 15–30 minutes of each light period, delivering a 730 nm far-red pulse at approximately 10–20 μmol/m²/s accelerates phytochrome conversion toward the Pr state, functionally extending dark period signal strength and accelerating the flowering timeline. STG series integrated 730 nm IR chips can be held on independently via the dimming controller for 15–30 minutes after the main lighting period ends, implementing EOD FR without additional equipment.
Mid Flower (Weeks 4–7): Rapid Bud Development
This is the highest light-demand phase of the entire growth cycle and the window where yield is established.
High-yielding Sativa-dominant cultivars, with adequate CO₂ support, maintain photosynthetic response up to 1200–1500 μmol/m²/s. Pushing above 1000 μmol/m²/s requires CO₂ supplementation at 1200–1500 ppm; without it, net photosynthetic rate does not continue to rise and excess photons convert directly to heat.
System Requirements for High-Intensity Strategies
Increasing PPFD to 1000+ μmol/m²/s only converts to yield gains when the following conditions are met simultaneously:
CO₂ concentration ≥ 1200 ppm.
Canopy temperature 24–26°C.
VPD (vapor pressure deficit) 0.8–1.2 kPa.
Nitrogen, phosphorus, and potassium supply at rates matching elevated photosynthetic demand.
STG series fixtures at PPE > 3.0 μmol/J consume less electricity than HPS or lower-efficiency LED alternatives at equivalent PPFD targets. The lower radiant heat output of LED compared to HPS also reduces HVAC cooling load, creating engineering headroom for canopy temperature control at high light intensities.
Early Detection of Light Stress
White or yellow-white bleached patches on the uppermost canopy leaves, spreading outward from the highest-intensity point.
Leaf edges curling upward (cupping), a combined response to light and thermal stress.
White or pale juvenile leaves emerging from bud tips — the characteristic bloom of light bleaching in floral tissue.
Upon identifying these signals, raise fixture mounting height by 5 cm increments and observe for 48 hours. Simultaneously, verify canopy temperature does not exceed 28°C. STG series fixtures ship with hanging rope hardware that allows height adjustment without disassembly.
Late Flower (Weeks 8–11): Maturation and Finish
Light Intensity: Maintain or reduce slightly to PPFD 750–900 μmol/m²/s.
In the maturation phase, bud dry matter accumulation transitions from volumetric expansion to density consolidation. Maintaining light intensity serves trichome gland development rather than additional bud site growth.
UV Enhancement Protocol
The 2–3 weeks before harvest (typically Weeks 9–11) is the target window for UV supplementation. UV-B radiation induces secondary metabolic stress responses; THCA synthase activity is upregulated under UV stress conditions, with a positive effect on final harvestable THC accumulation that is experimentally supported across multiple cultivar studies.
Operational parameters: UV irradiation duration 2–4 hours per day, delivered within the main light period. Exceeding this dose range causes DNA oxidative damage to leaf tissue, reducing rather than improving quality. STG series 395 nm UV chips are independently controllable through the dimming interface, enabling late-flower UV enhancement without changing fixtures or adding external UV hardware.
Finish Spectral Profile
Reduce the blue light proportion to below 10% of the total PPF. Maintain red-dominant output with active 730 nm IR and UV supplementation. This configuration maximizes photosynthetically driven resin gland development while reducing the blue-light-driven stomatal drive that accelerates transpiration — useful for concentrating sugar content during the finish phase.
Stage 5: Pre-Harvest (Final 1–2 Weeks)
48–72 Hour Complete Darkness Treatment
Some commercial growers apply complete darkness for 48–72 hours before harvest, based on the theory that in the absence of light, stored starches and sugars are redirected toward resin compound biosynthesis as trichome internal structures reorganize. Available data on the effect of this practice on final THC content shows inconsistency across cultivars and testing labs. If implementing this treatment, temperature and humidity control must remain active throughout the dark period — dense mature buds are highly susceptible to Botrytis infection under high-humidity dark conditions.
Progressive Intensity Reduction
As an alternative to complete darkness, gradually reduce PPFD to 50–100 μmol/m²/s over the final week while shifting the photoperiod to 10/14, simulating late-autumn natural light conditions that reinforce maturation signaling. STG series 0–10V continuous dimming supports this type of fine-grained intensity ramp-down through a programmable controller without manual adjustment.
Harvest Timing and Light Relationship
Trichome state is the direct indicator of harvest timing: clear trichomes indicate pre-maturity, milky/cloudy indicate peak THC window, and amber indicates THC beginning to degrade to CBN. Under high-PPFD conditions, trichome maturation proceeds faster. More frequent microscopic inspection is required to avoid missing the optimal harvest window when operating at elevated light intensities.
Commercial Facility Lighting System Design
SLTMAKS STG Series Fixture Selection Guide
SLTMAKS STG series fixtures are engineered for commercial cannabis cultivation. Current primary models cover the following specifications:
Model
Power
Bar Count
Flowering Coverage
Recommended Stage
STG-1200W-D
1200W
12 Bar
~4×8 ft (flower)
Veg / Flower
STG-1300W-F
1300W
12 Bar
~4×8 ft (flower)
Flower primary
STG-1400W-D
1400W
15 Bar
~5×8 ft (flower)
Flower primary
STG-1500W-F
1500W
15 Bar
~5×8 ft (flower)
Flower high-yield config
Chip Architecture: Samsung full-spectrum white + Epistar 660 nm plant red + 460 nm blue + 730 nm IR + 395 nm UV.
Driver: SOSEN UL/CUL certified, wide-input AC 100–277V, dimmable.
Certifications: ETL, CE, RoHS; PPE exceeds 3.0 μmol/J; DLC Horticulture certified — qualifies for North American utility rebate programs.
Warranty: 3-year full product warranty.
Customization: SLTMAKS supports custom spectral formulation for specific cultivar profiles or target compound optimization (high-THC / high-CBD configurations). Contact the SLTMAKS engineering team at [sltmaks.com](https://www.sltmaks.com) to initiate a custom recipe development engagement.
Commercial Technology Comparison
Technology
PPE Range (μmol/J)
Upfront Cost
Operating Cost
Spectral Flexibility
Lifespan (hours)
HPS
1.7–2.1
Low
High
None
10,000–15,000
CMH
1.5–1.9
Medium
Medium
Limited
12,000–20,000
Fixed-spectrum LED (industry avg.)
2.5–3.2
High
Low
None
50,000+
SLTMAKS STG Series
3.0+
High
Low
Multi-channel independent dimming
50,000+
B2B Procurement Checklist
Before committing to any commercial LED order, require the following documentation from any supplier:
Third-party PPFD distribution map (mounting height and test area must be explicitly stated — manufacturer self-reported maps have limited reference value).
Third-party PPE certification report (DLC, ETL, Intertek, or equivalent independent lab).
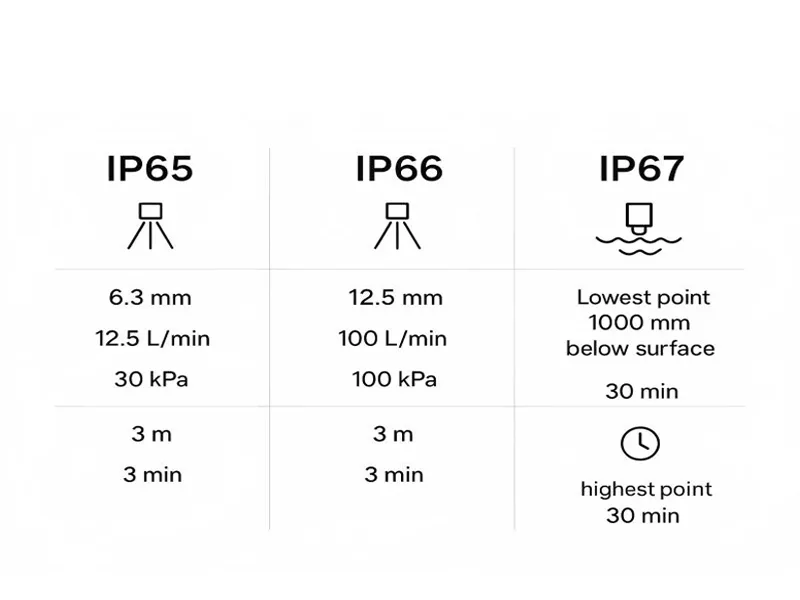
IP protection rating (IP65 or higher recommended for high-humidity cultivation environments).
Driver thermal management design (external driver installation extends LED lifespan by reducing fixture operating temperature).
Dimming interface standard (0–10V is the baseline requirement; RJ protocol supports multi-zone coordinated control).
Warranty terms and regional inventory availability (SLTMAKS maintains warehouse stock in the United States and distribution coverage in Europe, affecting lead time and post-sale service response speed).
Lighting Layout Design
Mounting Height and Coverage Area
The effect of mounting height on PPFD follows the inverse square law: doubling the distance reduces intensity to one quarter of its original value. Refer to the SLTMAKS technical datasheet for the specific PPFD attenuation curve of each STG model. General reference parameters:
Standard flower mounting height of 40–60 cm covers a 4×8 ft to 5×8 ft grow zone per fixture
Higher mounting (>80 cm) expands coverage and improves uniformity but reduces center-point PPFD, requiring higher fixture density to maintain intensity targets
Quick Estimation Formula
Required total wattage (W) = Target PPFD (μmol/m²/s) × Grow area (m²) / PPE (μmol/J)
Example: 10,000 sq ft flowering room, target PPFD 800 μmol/m²/s, STG series PPE 3.0 μmol/J:
Using STG-1400W-D fixtures: 248,000 / 1400 ≈ 177 units
This is a theoretical value. The SLTMAKS engineering team validates the final layout through DIALux simulation before project commitment.
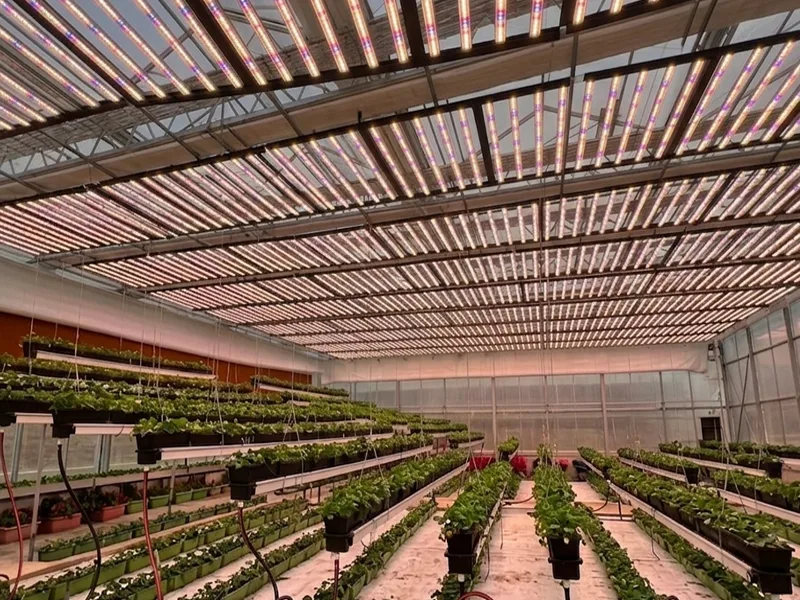
Multi-Tier Vertical Growing
Vertical growing architecture trades fixture mounting headroom for higher yield per unit of floor area. The SLTMAKS STG series bar-form design (12-bar / 15-bar format) operates in environments where tier spacing is compressed to 80–100 cm. External SOSEN drivers can be mounted on rack side panels rather than inside the canopy zone, removing a heat source from the most thermally sensitive area and improving airflow within each tier.
Lighting Control Systems
Controller Tier Selection
Control system investment should scale with facility size and operational complexity.
Entry-level: Digital timers with independent control per room, suitable for 1–3 room operations. Configure redundant timers (dual-circuit protection) to prevent single-point failures from causing dark period disruption.
Mid-level: Programmable multi-zone environmental controllers (TrolMaster, Argus, Priva, and similar platforms) for centralized management of lighting, temperature, CO₂, and humidity across multiple rooms. Supports per-room independent configuration and unified monitoring.
Full-stack: Integrated cloud environmental control platform with real-time data from PPFD sensors, temperature probes, CO₂ monitors, and other measurement points. Supports automatic dimming decisions and remote monitoring. Appropriate for facilities above 10,000 sq ft of flowering canopy. STG series 0–10V and RJ dimming interfaces are directly compatible with all three control tiers without intermediate adapters.
Peak/Off-Peak Electricity Rate Optimization
In time-of-use electricity markets, shifting the high-power lighting hours toward off-peak rate periods (typically 11 PM–7 AM) is a zero-capital-cost method of reducing electricity expenditure by 15–25% annually. This strategy is implemented directly through the STG series time-based dimming programming without any hardware change.
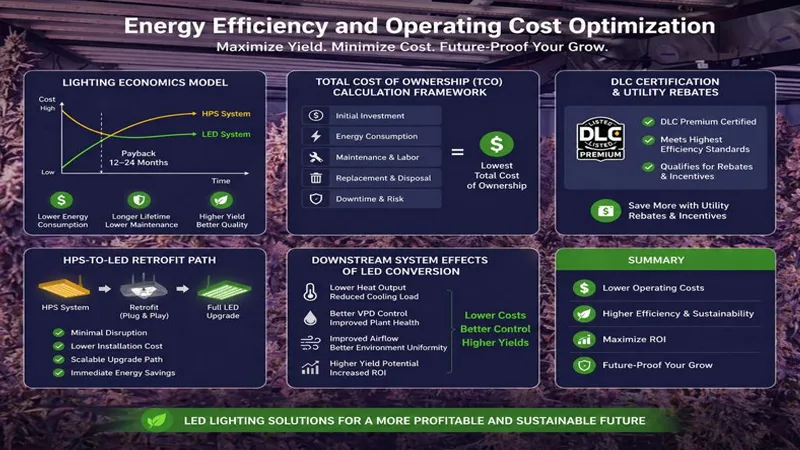
Energy Efficiency and Operating Cost Optimization
Lighting Economics Model
Grams per kilowatt-hour (g/kWh) is the core operational efficiency metric for commercial lighting systems. Current industry benchmark for LED facilities: 0.5–1.5 g/kWh. Leading facilities achieve 1.5–2.5 g/kWh.
Total Cost of Ownership (TCO) Calculation Framework:
At a commercial electricity rate of $0.12/kWh, annual electricity savings are approximately $75,161. Over a 5-year TCO horizon, total electricity savings reach approximately $375,805 — well exceeding the LED fixture purchase premium over HPS.
DLC Certification and Utility Rebates
SLTMAKS STG series DLC Horticulture certification is the primary qualifying credential for North American utility rebate programs. Large-scale retrofit projects can receive rebates ranging from $74,000 to over $170,000 in a single disbursement, substantially shortening the payback period.
Rebate programs update their requirements and eligibility windows periodically. Before project kickoff, contact the SLTMAKS commercial team to confirm the current rebate program status in your facility’s utility territory. SLTMAKS provides a complete compliance document package (product spec sheets, DLC certification files, installation guides) to support the rebate application process.
HPS-to-LED Retrofit Path
Pre-Retrofit Assessment
Before committing to a retrofit, collect the following baseline data:
– PPFD grid measurements across all grow rooms (measurement point spacing ≤ 0.5 m)
– 12 months of monthly electricity bills
– Last 6-cycle production and quality records
– Current HVAC system cooling capacity specifications
SLTMAKS provides a free Facility Lighting Audit service for B2B clients: based on the above data, SLTMAKS engineers produce a complete retrofit report including energy savings projections, fixture configuration plan, and DIALux PPFD layout maps, providing engineering-grade decision support before procurement commitment. Submit a request at [sltmaks.com](https://www.sltmaks.com).
Downstream System Effects of LED Conversion
Replacing HPS with STG series LED reduces fixture radiant heat output substantially (LED dissipates approximately 80% of heat through convection rather than radiation). Sensible heat load in the growing space decreases by 30–50%. This means existing HVAC systems may become oversized after the retrofit, or the same HVAC capacity can support a larger grow footprint. Recalculating HVAC load post-conversion is a required step, not optional — skipping it leads to CO₂ application inefficiency and VPD instability as the environmental equilibrium shifts.
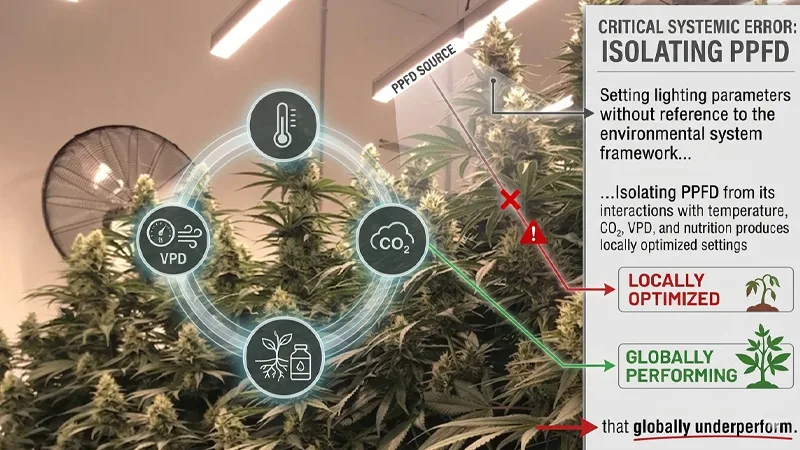
Environmental Integration — Lighting Cannot Be Optimized in Isolation
Setting lighting parameters without reference to the environmental system framework is the most common systemic error in commercial cultivation. Isolating PPFD from its interactions with temperature, CO₂, VPD, and nutrition produces locally optimized settings that globally underperform.
Light and Temperature Co-management
Photosynthetic enzyme activity peaks in the 24–28°C range. High-PPFD lighting transfers heat to the canopy through both radiation and convection, raising canopy temperature 2–5°C above ambient air temperature. HVAC system canopy temperature targets should be calibrated to 24–26°C based on direct canopy measurement, not return-air temperature monitoring alone.
STG series LED fixtures’ reduced radiant heat output directly lowers the thermal management burden on canopy temperature control. Temperature targets that required supplemental cooling under HPS can typically be maintained within existing HVAC capacity under STG LED without capacity expansion.
Light and CO₂ Co-optimization
Elevating CO₂ concentration only increases photosynthetic rate when light is not the limiting factor. CO₂ supplementation at low light intensity produces a negligible yield benefit.
Practical CO₂ dosing guide by PPFD level:
PPFD (μmol/m²/s)
Target CO₂ Concentration (ppm)
< 400
400–600 (ambient, no supplementation needed)
400–700
800–1000
700–1000
1000–1300
> 1000
1200–1500
CO₂ above 1500 ppm provides no additional benefit for most cannabis cultivars. Above 2000 ppm, toxicity symptoms appear in some varieties.
Light and VPD Co-management
VPD (vapor pressure deficit) quantifies the driving force for plant transpiration, measured in kPa. Under PPFD above 800 μmol/m²/s, VPD should be maintained at 0.8–1.2 kPa during flowering.
VPD above 1.5 kPa: plants close stomata to prevent excess water loss, causing photosynthetic rate to collapse — producing the counterintuitive result of high light intensity yielding low canopy performance.
This VPD recalibration requirement is particularly important after an HPS-to-LED conversion. LED fixtures’ reduced radiant heat alters the localized temperature and humidity distribution around the canopy, shifting the effective VPD at the leaf surface relative to what the room sensors report. Post-retrofit VPD monitoring should use canopy-level sensors, not room ambient sensors only.
Light and Nutrition Co-management
Under high-intensity lighting, organic matter synthesis accelerates, and macronutrient consumption rates increase proportionally.
During high-PPFD veg, nitrogen (N) demand increases most significantly. Nitrogen deficiency first presents as chlorosis in lower canopy leaves and rapidly becomes a ceiling on photosynthetic rate — effectively negating the investment in elevated light intensity. During late flowering, as sugar accumulation accelerates, potassium (K) demand increases. Potassium facilitates sugar transport from the source (leaf) to the sink (bud). The higher the photosynthetic rate, the more dependent the transport process becomes on adequate potassium supply.
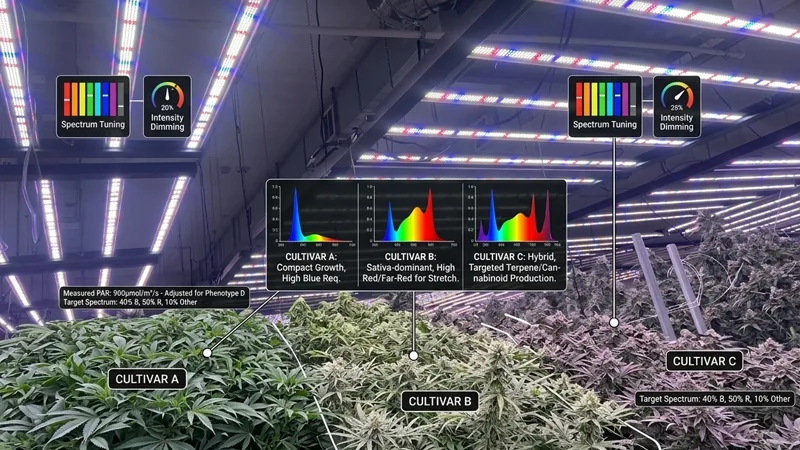
How Cultivar Genetics Affect Lighting Strategy
Genetic Background and Light Response Differences
Indica-Dominant Cultivars
Compact architecture, short internodes, broad leaves. Light saturation point is typically in the 900–1100 μmol/m²/s range. High blue light sensitivity — excessive red-to-blue ratio in veg can cause unnecessary internode extension. Flowering period is typically 8–9 weeks. High sensitivity to photoperiod precision, dark period integrity is non-negotiable.
Sativa-Dominant Cultivars
Tall architecture, long internodes, narrow leaves. Light saturation point can reach 1100–1500 μmol/m²/s, with continued photosynthetic response to elevated intensity under adequate CO₂. Flowering period is typically 10–14 weeks. Faster vegetative growth rate with higher DLI demand throughout. STG-1500W-F configuration is better matched to the higher-intensity requirements of Sativa-dominant flower rooms.
Autoflowering Cultivars
No photoperiod dependency. Can operate at 18/6 or 20/4 throughout the complete lifecycle. Short total cycle (seed to harvest in 60–90 days), suited for commercial operations prioritizing rapid batch turnover. Light parameters align with photoperiod-dependent veg stage parameters across the entire cycle.
High-THC vs. High-CBD Cultivar Lighting Priorities
THC synthesis pathway response to UV exposure has meaningful experimental support. Controlled UV-B supplementation produces relatively consistent positive effects on final THC content across validated cultivar sets. High-CBD cultivars (which express CBDA synthase rather than THCA synthase) show lower overall sensitivity to light intensity variation. For CBD-focused operations, the primary yield driver from high-intensity lighting is increased bud dry weight rather than compound concentration elevation.
SLTMAKS supports custom spectral formulation for high-THC or high-CBD cultivar profiles — UV ratio adjustment, red-to-blue ratio optimization. Commercial facilities with compound-specific optimization targets are encouraged to initiate a custom recipe development consultation with the SLTMAKS engineering team.
Common Lighting Errors: Diagnosis and Resolution
Light Intensity Problems
Symptom
Root Cause
Resolution Steps
Leaf bleaching (white/pale patches on upper canopy)
PPFD exceeds the light saturation point, or the fixture is mounted too close
Raise mounting height 5 cm increments / Reduce fixture output 10–20% / Verify canopy temperature
Excessive stretch (long internodes)
Insufficient PPFD / Insufficient blue light fraction
Lower mounting height or increase fixture density / Verify STG blue channel output
Poor lower canopy yield
Excessive vertical PPFD attenuation
Add side lighting / Adjust defoliation strategy / Reduce overall plant height through training
Male flowers appear in the flower room (hermaphroditism)
Dark period light contamination (the most common cause)
Seal all wall seams and door frames / Cover all indicator lights / Conduct a dark period light audit with dark-adapted eyes
Plants entering flower during the veg schedule
Controller malfunction / Cultivar with lower photoperiod threshold
Cross-verify with redundant timer / Configure power-recovery auto-check
Uneven flowering across the batch
Non-uniform PPFD distribution in the room
Uneven flowering across the batch
Equipment and Maintenance Problems
LED Driver Overheating
Driver operating temperature is the primary determinant of driver lifespan — service life approximately doubles for every 10°C reduction in operating temperature (Arrhenius relationship). STG series external SOSEN driver design allows drivers to be installed in temperature-controlled corridors or equipment rooms, physically isolated from the high-humidity grow space. This is the highest-priority engineering action for maximizing driver service life.
Lumen Maintenance Management
LED fixtures begin producing measurably lower photon output after 5,000–10,000 cumulative operating hours. STG series fixtures are rated at L90 ≥ 36,000 hours. Conduct PPFD measurements every 6 months and compare against initial commissioning data to identify fixtures with accelerated light degradation.
Dust Accumulation
Dust on fixture surfaces and lenses reduces PPFD output by 5–15%. Clean STG series bar surfaces at each harvest cycle (typically every 10–12 weeks) to maintain consistent light transmission.
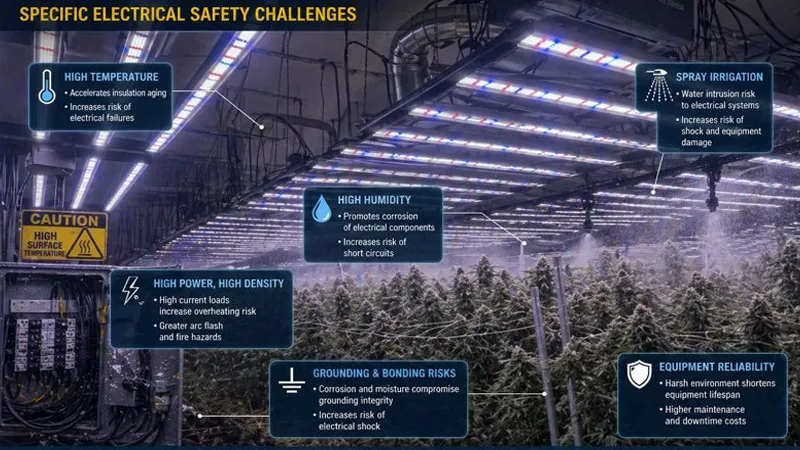
Compliance and Safety Framework
Electrical Safety Standards
Commercial cannabis grow facilities involve high-power, high-density electrical installations in environments (high temperature, high humidity, spray irrigation) that create specific electrical safety challenges.
STG series fixtures hold ETL certification (North American market) and CE certification (European market), satisfying electrical safety admission requirements in their respective target markets and providing documentation for facility compliance submissions.
Core requirements:
All grow room electrical circuits comply with NEC (North America) or IEC 61439 (Europe) as applicable.
Wet-area receptacles and junction boxes rated IP65 or higher.
Systems above 100 kW are designed and installed by a qualified electrical engineering firm.
SLTMAKS includes an Electrical Infrastructure Review in B2B project engagements — verifying driver voltage specifications, dimming protocol compatibility, and circuit load distribution to ensure fixture integration with the facility’s existing electrical system before hardware installation.
DLC Certification and Rebate Compliance
DLC Horticulture certification is the entry credential for North American utility rebate programs. SLTMAKS STG series DLC certification status can be independently verified on the DesignLights Consortium website (designlights.org).
Common rebate compliance failures:
– Purchasing fixtures without DLC certification or below the program’s minimum PPE threshold (rejected at audit, no rebate issued)
– Beginning installation before receiving pre-approval from the utility program (completed installations without pre-approval cannot be retroactively claimed)
– Incomplete installation records or missing procurement documentation
SLTMAKS provides a complete compliance documentation package with B2B orders: product specification sheets, DLC certification files, and installation guides formatted to support utility rebate application submissions.
Workplace Safety
The 395 nm UV chip output during UV enhancement periods poses UV-A/B exposure risk to cultivation staff. Personnel entering the grow room while UV output is active must wear UV-protection eyewear rated to UV400 and protect exposed skin. High-power LED fixtures reach heat sink surface temperatures of 50–70°C during operation; maintenance procedures must be performed after the fixture has cooled. Annual electrical inspection of high-power lighting systems in wet environments should be incorporated into the facility safety management program.
Emerging Technology and SLTMAKS R&D Direction
Precision Spectral Recipe Development
SLTMAKS holds proprietary patents in spectral science and thermal management. Metabolomics-based spectral recipe development is a core R&D focus — analyzing the full-spectrum metabolite profiles of plants under varying spectral treatments to establish dose-response relationships between specific wavelength bands and specific compounds. This work supports the cultivar-specific custom spectral formulation service SLTMAKS offers to B2B clients.
AI-Assisted Adaptive Lighting
Machine learning-integrated adaptive lighting control systems use canopy cameras to analyze plant morphology in real time, combined with multi-sensor environmental data, to dynamically adjust PPFD and spectral output. Commercial maturity for this technology is projected to develop progressively from 2026 to 2028. SLTMAKS STG series interfaces are designed with forward compatibility for AI-driven control protocol integration.
Vertical Cultivation Lighting Innovation
The STG series’ detachable bar-form design (separate fixture body and driver) has commercial validation in multi-tier vertical farming installations. As tier spacing requirements compress further, SLTMAKS is developing thinner bar profiles and flexible light strip configurations to address the geometric and thermal constraints of high-density vertical cultivation architectures.
Full-Cycle Reference Summary and Action Framework
Full-Cycle Lighting Parameter Quick Reference
Growth Stage
Duration
Photoperiod
Target PPFD (μmol/m²/s)
Target DLI (mol/m²/day)
Spectral Priority
SLTMAKS Config
Germination
Days 0–7
18/6
75–150
5–8
Blue-dominant
STG dimmed to 10–15%
Seedling/Clone
Weeks 1–3
18/6
200–400
12–20
Blue primary
STG dimmed to 20–35%
Early Veg
Weeks 1–2
18/6
400–600
20–28
B:R = 1:2
STG at 40–55%
Mid-Late Veg
Weeks 3–8
18/6
600–900
28–40
B:R = 1:3
STG at 60–80%
Early Flower
Weeks 1–3
12/12
600–900
25–35
R:B = 4:1 + FR
Flower spectrum + EOD FR
Mid Flower
Weeks 4–7
12/12
800–1,200
35–45
R:B = 5:1 + FR
STG at 80–100%
Late Flower
Weeks 8–11
12/12
750–900 + UV
30–40
Red dominant + UV-B
UV channel 2–4 hrs/day
Pre-Harvest
Final 1–2 weeks
10/14 or dark
50–100 (or 0)
Per protocol
—
STG at 10% or de-energized
Scale-Based Procurement Recommendations
Mid-Scale Commercial Facilities (5,000–20,000 sq ft of flowering canopy)
Recommended models: STG-1400W-D or STG-1500W-F as flowering primary; STG-1200W-D for veg and clone rooms.
Priority actions: Submit facility parameters for SLTMAKS DIALux verification; initiate DLC utility rebate pre-approval before installation begins; complete electrical infrastructure review for driver voltage and dimming protocol compatibility.
Large-Scale Commercial Facilities (>20,000 sq ft of flowering canopy)
Recommended procurement path: Engage SLTMAKS B2B wholesale channel for volume pricing and supply agreement. Phased retrofit (room by room) is lower risk than full simultaneous replacement. Integrate smart multi-zone control (0–10V or DALI); establish a scheduled PPFD calibration program; integrate lighting data with production batch analytics.
12-Month Lighting Optimization Roadmap
Months 1–2: Baseline Audit
– Complete PPFD grid measurements across all grow rooms (measurement point spacing ≤ 0.5 m); generate distribution heat maps
– Calculate actual DLI per room; identify gaps against target parameters
– Request SLTMAKS free Facility Lighting Audit for retrofit plan and energy savings projections
Months 3–4: Core Parameter Calibration
– Adjust fixture mounting height and spacing based on PPFD audit findings to improve uniformity
– Cross-verify photoperiod controller output against independent timer records
– Establish synchronized monitoring records for light, temperature, CO₂, and VPD
Months 5–8: Systematic Optimization
– Run End-of-Day FR protocol across one full batch; record flowering speed and yield data
– Activate STG UV supplementation in the final 2–3 weeks before harvest; compare quality data against prior batch baseline
– Initiate DLC rebate program application using SLTMAKS compliance documentation package
Months 9–12: Data-Driven Decisions
– Consolidate full-year batch data; build a correlation model between lighting parameters and yield/quality outputs
– Based on TCO analysis, establish a priority schedule for fixture upgrades in the following fiscal year
– Engage SLTMAKS engineering team to develop cultivar-specific spectral recipe for next production cycle
Appendix: Key Terms Glossary
Term
Abbreviation
Definition
Photosynthetic Photon Flux Density
PPFD
Photosynthetically active photons (400–700 nm) received per square meter per second; unit: μmol/m²/s
Daily Light Integral
DLI
Total photosynthetically active photon accumulation per day at canopy level; unit: mol/m²/day
Photosynthetic Photon Efficacy
PPE
Photosynthetically active photons produced per joule of electrical energy consumed; unit: μmol/J
Total Cost of Ownership
TCO
Full lifecycle cost from procurement through decommissioning
Vapor Pressure Deficit
VPD
Water vapor pressure difference between leaf surface and surrounding air; drives transpiration; unit: kPa
Coefficient of Variation
CV
Standard deviation divided by the mean measures the PPFD spatial distribution uniformity
End-of-Day Far-Red
EOD FR
Far-red light pulse delivered at the end of the photoperiod; shifts phytochrome state to promote flowering
Bleaching
—
Standard deviation divided by the mean measures the PPFD spatial distribution uniformity
Hermaphroditism
—
Production of male flowers by a female plant under physiological stress conditions
Autoflowering
—
A cannabis cultivar type that initiates flowering based on age rather than photoperiod
DesignLights Consortium
DLC
North American energy efficiency certification body; DLC Horticulture listing is the primary rebate qualification credential
– Facility Lighting Audit (free, with full retrofit report)
– Volume procurement pricing and supply agreements
– Custom spectral recipe development
– DLC rebate compliance document package
– Electrical infrastructure compatibility review
This document is a SLTMAKS technical reference for commercial cannabis cultivation facilities. All lighting parameter recommendations require calibration against specific cultivar profiles, facility conditions, and target product specifications. Lighting optimization is a continuously data-driven process. Scheduled auditing and iterative adjustment are the operational practices that sustain competitive advantage over time.
FAQ
Why should commercial facilities prioritize PPFD and DLI over Lumens or Lux?
u003cstrongu003eAnswer:u003c/strongu003e In commercial cannabis cultivation, measuring light in Lumens or Lux is a systematic error because those units are weighted toward human visual sensitivity, not plant biology. Plants respond to u003cstrongu003ephotonsu003c/strongu003e, specifically those in the 400–700 nm range.u003cbru003eu003cstrongu003ePPFD (Photosynthetic Photon Flux Density)u003c/strongu003e measures the instantaneous intensity of these photons hitting the canopy.u003cbru003e u003cstrongu003eDLI (Daily Light Integral)u003c/strongu003e measures the total accumulated u0022photon volumeu0022 the plant receives over a 24-hour period. Since DLI is the primary predictor of yield potential, focusing on these photometric units allows growers to accurately set light-on hours and intensity to maximize dry matter accumulation while optimizing electricity costs.
What is the strategic benefit of integrated UV and Far-Red (730 nm) chips in a single fixture?
u003cstrongu003eFar-Red (730 nm):u003c/strongu003e When used during the light period, it triggers the u003cemu003eEmerson Enhancement Effectu003c/emu003e, increasing overall photosynthetic efficiency. When used as an u003cemu003eEnd-of-Day (EOD)u003c/emu003e pulse, it accelerates the transition to the dark-period state, potentially shortening the flowering timeline.