Introduction
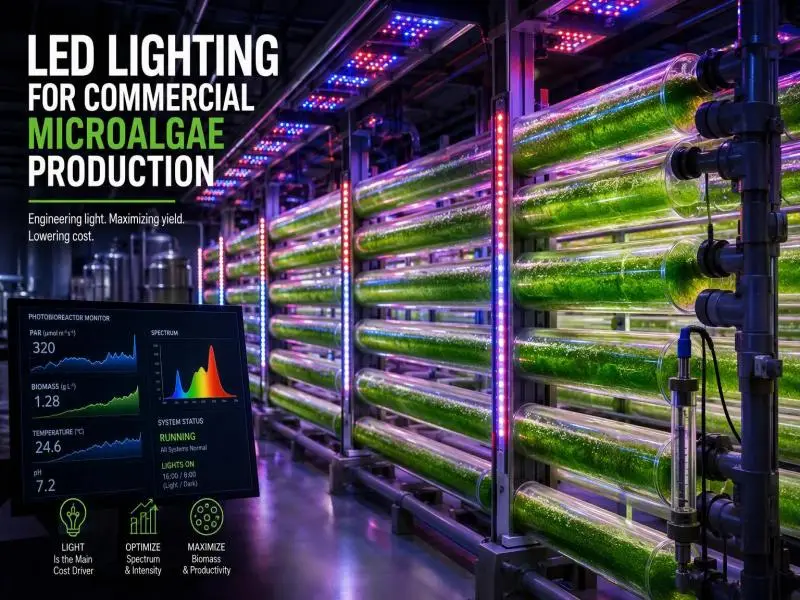
In an internally illuminated photobioreactor (PBR), the lighting system is usually the single largest electrical load and the hardest line item to defend in a cost model. That makes fixture selection a system-design decision rather than a catalogue pick: the choice of fixture sets the connected load, the cooling requirement, the cleaning routine and, ultimately, the energy cost per kilogram of dry biomass.
This guide is written for operators, cultivation leads and procurement staff who are specifying or retrofitting LED systems on tubular, flat-panel and column or bag reactors. It covers the chain that runs from a target photosynthetic photon flux density (PPFD) at the culture surface through fixture count and connected load to cooling and operating cost, plus form factor matching, spectrum choice, trial design, vendor documentation and contamination control.
The evidence base is published PBR energy and techno-economic studies, the DesignLights Consortium (DLC) Horticultural Lighting V4.0 technical requirements, and engineering calculations. No first-hand test data from our own facilities is presented. Each section stands alone but cross-references the others, so a reader who needs only the fixture-count method can start there and return to spectrum and cleaning later.
Table of Contents
What Microalgae LED Grow Lights Must Do in a Photobioreactor
A plant canopy is a fixed surface. The microalgae crop is a moving, light-absorbing suspension behind a transparent wall, so the quantity that matters is the PPFD arriving at the culture surface, and the light must then penetrate an optical path set by tube diameter or panel depth. A fixture that looks impressive on a specification sheet can deliver very little to the cells if it is mounted too far away or aimed at the wrong part of the reactor.
Three quantities govern every later decision:
- Target surface PPFD in µmol m⁻² s⁻¹, set by strain, growth stage and product goal.
- Illuminated surface area actually reached by the fixture, in m², which is a property of the reactor geometry and the mounting arrangement, not of the lamp.
- Photosynthetic photon efficacy (PPE) in µmol J⁻¹, the fixture’s photon output in the 400–700 nm range divided by its total electrical input, including drivers, fans and controls.
Distinguish PPF from PPFD. PPF is the fixture’s total photon output in µmol s⁻¹. PPFD is the photon flux density arriving at a surface in µmol m⁻² s⁻¹. PPF is a property of the fixture; PPFD depends on mounting distance, beam angle, and the area covered. The same fixture therefore produces different PPFD in a narrow tube rack and a wide flat panel, and a fixture’s PPF alone says nothing about what the culture receives.
More photons are not automatically more biomass. The relationship between PPFD and growth rate is nonlinear and follows a saturation curve: below the compensation point respiration exceeds photosynthesis and biomass declines, growth then rises roughly linearly with intensity, and beyond saturation microalgae can experience photoinhibition (Frontiers in Microbiology review).
The Padova pilot study illustrates the efficiency side of the same curve: a higher intensity raised volumetric productivity but lowered efficiency, which the authors attribute in part to the higher intensity (Tormena et al., Energy Conversion and Management 348 (2026) 120775). Design for the knee of the curve, not the fixture’s maximum output.
How to Convert Target PPFD into Fixture Count and Connected Load
This is the calculation that turns a biological target into a procurement number and an electrical load. Run it on your own geometry before requesting quotations.
- Fix the target PPFD at the culture surface for the strain and growth stage. This comes from your own trial data or from species-specific literature, not from a fixture datasheet.
- Measure or compute the illuminated surface area each fixture must cover. For a tube bank, this is the wetted, illuminated wall area, not the footprint of the rack.
- Divide required photon flux by delivered PPF per fixture. Required photon flux is target PPFD multiplied by illuminated area, in µmol s⁻¹. Divide by the fixture’s PPF at the actual mounting distance and beam angle, not its rated maximum at a reference condition.
- Add a uniformity and wall-transmission allowance. Corners and edges receive less light than the centre, and the reactor wall itself transmits less than 100% of incident photons, especially once fouling begins. A margin of 10–30% is a common starting assumption; the correct figure comes from your own light mapping.
- Sum fixture input watts, including drivers, fans, and controls, to get connected load.
- Multiply by hours of operation to get daily kWh, then by your electricity tariff for daily lighting cost.
An illustrative calculation, with every input assumed. Suppose a flat-panel reactor presents 4.0 m² of illuminated face, the target is 150 µmol m⁻² s⁻¹ at the wall, and a candidate panel fixture delivers 400 µmol s⁻¹ at the intended 100 mm standoff. Required photon flux is 150 × 4.0 = 600 µmol s⁻¹, so 600 ÷ 400 = 1.5 fixtures, rounded up to 2.
With a 15% uniformity allowance, the requirement becomes 690 µmol s⁻¹, still 2 fixtures. If each fixture draws 180 W, the connected load is 360 W; at 20 hours per day, that is 7.2 kWh per day. None of these numbers is a measured result — they exist to show the method and the order of operations.
For scale, the Padova pilot gives a real anchor rather than a universal ratio. Its 50 L reactor used seven lamps that drew 57.8 W at the full setting, while the PFD of 160 µmol m⁻² s⁻¹ was reached at a lighting power consumption of 23.1 W. Total maximum consumption for that reactor at 100% light setting was 72.8 W, including 15 W for bubbling and ancillary systems (Tormena et al.). Those are that system’s measured figures; do not transfer the ratio to a different reactor geometry.
Finally, expect a gap between nameplate and reality. PPF is measured per ANSI/IES LM-79 under reference conditions in an integrating sphere or goniometer. In-situ surface PPFD is affected by standoff, beam angle, reflector losses, wall transmission, and fouling. Commissioning measurement, covered later, is where the two are reconciled.
Matching Fixture Form Factor to Tubular, Flat-Panel and Column Reactors
Geometry sets the constraints before any fixture is chosen. The sequence matters: fix pitch and the number of illuminated aspects first, then treat standoff as the free variable.
Tubular reactors. Tube pitch is the first constraint because it determines how many sides can be lit at all. Published tubular design work places the useful pitch at around 50 mm between adjacent absorber tubes, balancing specific growth rate against productivity per unit collector area; below about 25 mm, shading between tubes costs measurable output, and above about 75 mm additional reflector area contributes little because much of the reflected light no longer intercepts a tube (Lumistrips design guidance).
These are typical ranges from design literature, not rules. Where pitch allows, two-sided illumination spreads the same photon delivery across more aspects, lowering peak irradiance at the wall and shortening the maximum optical path from a full diameter to a radius — the light-dilution route to a higher biomass yield on photons at unchanged energy cost. Linear LED bars are typically placed 20–100 mm from the tube; flexible or rigid strips on aluminium profiles can sit at 10–50 mm, but then need excellent thermal separation and protection against moisture and cleaning chemicals.
Flat panels. Uniform coverage of the illuminated face matters more than peak intensity, because the cells at the dim edge of the panel determine the harvest as much as those in the bright centre. Rectangular LED panels beside flat PBRs are typically placed 50–200 mm from the face.
Columns and bags. Radial arrays around the vessel are the usual arrangement, at roughly 50–150 mm, and the design problem is the dark centre: light entering the curved wall attenuates before it reaches the core, so more sides and closer spacing reduce the unlit volume. Bags suffer from insufficient mixing at higher volumes, which compounds the problem (lab-scale PBR review).
| Reactor type | Typical LED standoff | Metric to specify from the vendor |
|---|---|---|
| Tubular, linear bar beside tube | 20–100 mm | PPF per linear metre at stated standoff |
| Tubular, strip on aluminium profile | 10–50 mm | PPF per linear metre at stated standoff |
| Flat panel, rectangular fixture | 50–200 mm | PPF per m² of illuminated face at stated standoff |
| Column or bag, radial array | 50–150 mm | PPF per module at stated standoff and beam angle |
| Internal light rods or light guides | Inside the culture volume | Photon coupling efficiency, sealing and fouling specification |
Whatever the format, demand the per-unit metric tied to a stated mounting distance and beam angle. A PPF figure quoted without a standoff cannot be converted into surface PPFD, and a fixture quoted only in total PPF hides how much of that output actually lands on the reactor.
Choosing Spectrum: Red, Blue, White and Blends
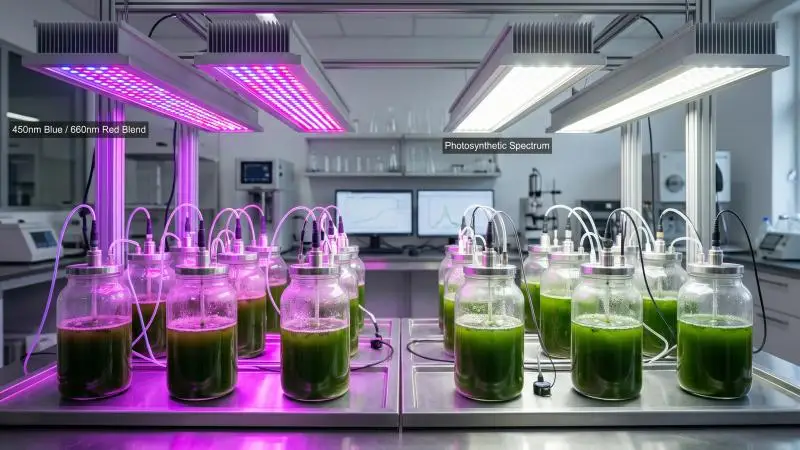
The common horticultural recipe is monochromatic blue at 450 nm plus red at 660 nm, chosen to match chlorophyll absorption. The Padova work describes this mix explicitly and reports that the combination can be applied to maximize the absorption spectrum of pigments such as chlorophyll (Tormena et al.). That does not make it universally best. Spectrum effects are species- and product-specific, and the strongest evidence for any given strain is the primary study on that strain.
Organise the decision by product target rather than by colour preference:
- Biomass-oriented cultures often run efficient red-heavy or red/white recipes, because red photons are delivered at high efficacy and the goal is photons per unit of dry weight.
- Pigment or stress targets may use blue-enriched or high-light stress stages. Haematococcus pluvialis for astaxanthin is the clearest two-stage case: moderate light for growth, then high-light stress to induce accumulation. Dunaliella salina for beta-carotene is typically driven by high light combined with salinity and nutrient stress.
- Hatchery live feed — Tetraselmis, Isochrysis, Pavlova, Chaetoceros — prioritises stability and predictability over maximum intensity, with moderate PPFD and reliable photoperiod.
The following table reproduces the species, use, and lighting-priority guidance from the design literature as that source’s guidance, not as an independent finding:
| Species | Main commercial use | Lighting priority |
|---|---|---|
| Arthrospira platensis (Spirulina) | Protein biomass, phycocyanin, nutraceuticals | Efficient biomass production, often red, white-red or red-blue recipes |
| Chlorella vulgaris / C. sorokiniana | Protein biomass, supplements, cosmetics, wastewater, CO₂ capture | Moderate PPFD for biomass; higher or blue-enriched light for lipid or stress targets |
| Haematococcus pluvialis | Natural astaxanthin | Two-stage lighting: moderate growth, then high-light stress |
| Dunaliella salina | Natural beta-carotene | High light for carotenoid induction, often with salinity and nutrient stress |
| Nannochloropsis species | Aquaculture feed, EPA-rich biomass, lipids | Red, white-blue or red-blue depending on biomass and lipid target |
| Phaeodactylum tricornutum | EPA, fucoxanthin, specialty compounds | Blue and white spectra often relevant for pigment and lipid control |
| Tetraselmis, Isochrysis, Pavlova, Chaetoceros | Live aquaculture feed | Moderate PPFD, stable photoperiod, reliable white or blue-enriched light |
| Scenedesmus, Tetradesmus, Desmodesmus | Wastewater, feed, lipids, robust biomass | Moderate to high PPFD depending on biomass or lipid target |
Source: Lumistrips design guidance.
Two cautions. First, a blend’s value often lies in photomorphological or pigment effects that PPF alone does not capture, so a recipe that wins on µmol J⁻¹ may lose on product titre. Second, spectrum interacts with intensity: the same blue: red ratio delivered at 100 and at 400 µmol m⁻² s⁻¹ is not the same treatment. Fix intensity first, then compare spectra at that intensity.
Running a Small Trial to Fix Intensity and Spectrum
A trial exists to find the knee of the saturation curve for your strain and your reactor, not the maximum the lamps can deliver. The protocol below is a practical adaptation of the method used in the Padova continuous-culture work.
Hold everything else constant. Mixing, CO₂ supply, temperature, pH, and medium composition must be identical across arms so that light is the only variable. In the Padova continuous system, cultures were sparged with a 5% CO₂-air mixture at 1 L/h, stirred magnetically, and held in a thermostated incubator; nitrate and phosphate were measured in the spent medium to confirm nutrients were not limiting (Tormena et al.).
Test a PPFD series, not a single point. Bracket the intended operating target with at least three intensities, for example 60%, 100% and 150% of target, so the shape of the response is visible.
Run each condition to steady state. In the Padova method, steady state was confirmed by daily optical density at 750 nm and usually took about one week; once reached, at least four dry-weight samples were collected on different days covering at least three residence times. Sampling within a single batch or a single harvest tells you almost nothing about a continuous process.
Measure both sides of the ledger. Record dry weight and, where relevant, the target compound, alongside the electrical input to the lighting. That gives productivity in g L⁻¹ d⁻¹ and energy in kWh per kg of dry biomass from the same run.
Randomise, replicate and keep a control. Assign reactor positions randomly so that a position effect is not mistaken for a light effect, replicate each condition, and retain a control arm at your current operating intensity.
Analyse properly. The Padova team verified equal variance with Levene’s test at 95% confidence, ran a one-way ANOVA, and grouped results by Tukey’s method at a 95% confidence interval. A trial without this step cannot distinguish a real effect from run-to-run noise.
Size the trial to answer one question: at what surface PPFD does additional light stop buying additional biomass per kWh? That answer, not the lamp’s maximum, sets the design target you carry into the fixture-count calculation.
What to Require from a Lighting Vendor Before Purchase
Procurement should be a document check, not a conversation about lumens. Each item below substantiates a specific claim, and a vendor who cannot supply it has not demonstrated that claim.
| Document | Claim it substantiates |
|---|---|
| ANSI/IES LM-79 test report from an ISO 17025-accredited lab | PPF in the 400–700 nm range, binned by 400–500, 500–600 and 600–700 nm, plus spectral quantum distribution |
| PPE in µmol J⁻¹ from the same report | Photon output divided by total fixture input watts, including drivers, fans, and controls |
| ANSI/IES LM-80 and TM-21 data, with ISTMT results | Photon flux maintenance over life at the fixture’s real thermal conditions |
| Driver and fan specification sheets with maximum ambient temperature | Lifetime at temperature, not just a nominal hour count |
| Safety certification from an OSHA-recognized NRTL or SCC-recognized body | Compliance with ANSI/UL 8800 for horticultural lighting |
| IP rating per IEC 60529 | Protection against dust and water for the actual mounting and washdown method |
| Warranty terms | Coverage of the complete luminaire, including heat sink, optics, drivers and fans |
The DLC Horticultural Lighting V4.0 technical requirements are a useful reference point for what a documented fixture looks like. Under V4.0, PPF must be reported per LM-79 across 400–700 nm with the three sub-band bins alongside the total; PPE must be at least 2.5 µmol J⁻¹; photon flux maintenance must reach Q90 ≥ 36,000 hours per LM-80/TM-21 or LM-84/TM-28; drivers and fans must be rated for at least 50,000 hours; power factor must be ≥0.9 and THDi ≤20%; safety certification must be ANSI/UL 8800; and the fixture warranty must be at least five years (DLC V4.0).
Testing must be conducted at laboratories accredited to ISO 17025 and the relevant standard by ILAC MRA signatories.
Two limits on that reference point. DLC listing is a horticultural-lighting qualification, not a microalgae-specific standard: it says nothing about whether a fixture’s beam pattern suits a 50 mm tube pitch. And V4.0 does not qualify lamps, light engines or retrofit kits, so a product sold as a lamp cannot be DLC-listed under this version. Verify that the reported metrics match your mounting geometry, and treat the listing as a floor rather than a ceiling.
Heat, Cooling Load and Total Operating Cost
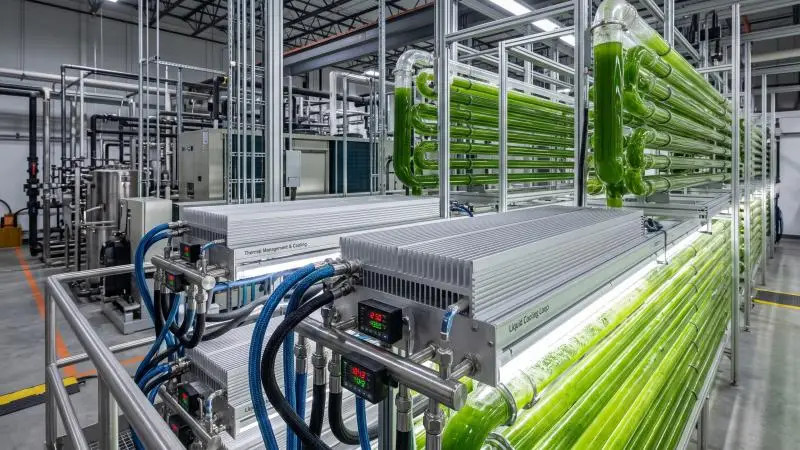
Essentially all electrical input that does not leave the reactor as photons ends up as heat in the culture or the room. Lighting watts are therefore a first-order cooling load, not a rounding error, and the cooling system must be sized with them in mind.
Estimating the load. Start from connected lighting load in watts. Subtract the fraction of radiant energy that leaves the reactor as photons and is not absorbed by the culture or the wall; the remainder is deposited as heat. For an internally illuminated reactor, most of the emitted light is absorbed within the culture or the wall, so a reasonable first estimate is that the great majority of lighting watts become heat. As a worked example, 10 kW of connected lighting load with an assumed 10% of emitted photons escaping without absorption leaves about 9 kW deposited as heat, which is the lighting contribution the chiller or HVAC must remove.
The escaping fraction is the assumption to refine: it depends on whether illumination is internal or external, wall transmittance and culture density, and a measured or light-model estimate of photons leaving the reactor replaces the assumed value. Then add the heat from pumps, blowers, and controls, and size the chiller or HVAC against the total.
Cost context from published work. The WUR techno-economic study calculated that artificial light increases production cost by $25.3 per kilogram of dry-weight biomass, and that 4% to 6% of electrical input is fixed as chemical energy in the biomass. The authors concluded that energy loss and increased cost may be acceptable for high-value products but should generally be avoided, and recommended that microalgae cultivation programmes focus on sunlight (Blanken et al., Algal Research 2(4):333–340, 2013). That is a literature-based calculation, not a benchmark for any particular facility.
The Padova pilot reports a different system-specific figure: 50.51 kWh of electrical energy per kilogram of dry biomass, including lighting, at 160 µmol m⁻² s⁻¹ with a one-day residence time and productivity of 0.31 ± 0.01 g L⁻¹ d⁻¹ (Tormena et al.). The same paper compares that with 265.75 kWh kg⁻¹ calculated for a similar LED-illuminated Chlorella vulgaris PBR, 99% of it lighting, and attributes the roughly five-fold difference to species, intensity, and previous-generation LEDs. The gap between these figures is the point: neither is a benchmark, and both depend on strain, intensity, reactor, and lamp generation.
What this means for the business case. Artificial lighting fits products whose value per kilogram supports the energy cost — pigments, high-grade live feed, premium biomass — and is harder to justify for bulk commodities where sunlight is available. Run the kWh per kg figure from your own trial alongside the product price before committing to a lighting specification.
Contamination, Fouling and Cleaning Around Lighting Hardware
Putting electrical hardware against or inside a wet reactor creates hygiene and service risks that belong in the lighting design, not the maintenance schedule alone.
Fouling erodes the light budget. Biofouling on reactor walls reduces light transmittance, and therefore the reaction the light is there to drive, and surface roughness influences how readily microorganisms adhere — the rougher the surface, the more likely larger numbers of cells attach (Achinas et al., Materials 13:3147). Glass can be polished to reduce roughness below that of stainless steel, which is one reason it is chosen for PBR construction.
The practical consequence for lighting: the design must allow wall cleaning without disturbing or unmounting fixtures, and lens and wall cleaning should appear in the maintenance schedule as a light-budget item, not an occasional chore.
Ingress protection is a risk decision. IP ratings follow IEC 60529, which defines the first digit as protection against dust and foreign objects and the second as protection against liquid ingress, from 0 to 9 (Glamox IP classification guide). A standard interior luminaire at IP20 offers no water protection at all. Choose the rating from the actual exposure — spray, washdown, condensation, occasional immersion — and match it to the cleaning method. A fixture cleaned by hose-down needs a different rating from one wiped with a cloth. Confirm the rating in the vendor documentation rather than inferring it from a marketing description.
Condensation and internal hardware. Internal light rods and light guides sit inside the culture volume, so sealing, photon coupling, and fouling all apply at once. Condensation on the inside of a lens or on a driver enclosure is a slow failure mode; specify sealed assemblies and confirm the thermal design keeps surfaces above the dew point of the local atmosphere.
Chemical compatibility. Housings, lenses, and seals must tolerate the cleaning agents actually used. Check compatibility for the specific chemistry rather than assuming that a fixture rated for water is rated for the disinfectant.
Service access. Design mounting so that lenses and reactor walls can be cleaned, and fixtures replaced, without opening the culture to contamination. Smooth, cleanable surfaces on the fixture side reduce the places where biofilm can establish.
Commissioning and Ongoing Performance Checks
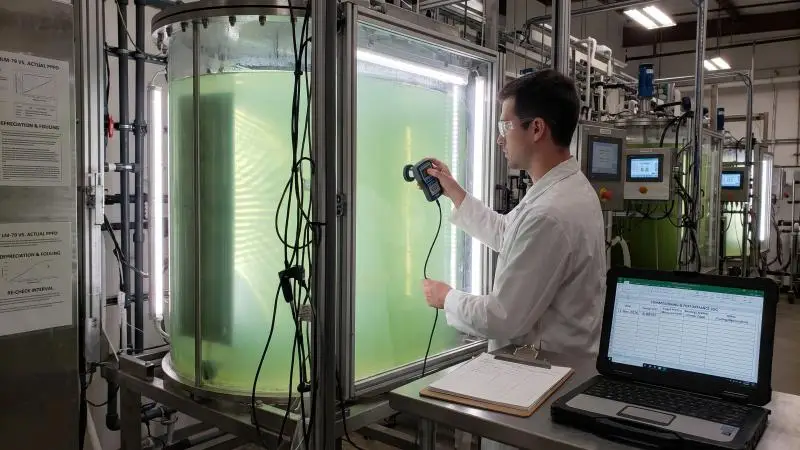
Commissioning is where the vendor’s LM-79 claims meet the actual reactor. After installation, measure delivered PPFD at the culture surface with a calibrated quantum sensor at several points across each illuminated face — centre, edges and the positions furthest from the fixture — and compare the readings with the design target. Log the results with the date, sensor serial number, and mounting configuration.
Repeat the measurement periodically. Three things erode the light budget over time: fouling on the reactor wall and on lenses, LED depreciation, and driver drift. The DLC V4.0 photon flux maintenance requirement of Q90 ≥ 36,000 hours sets an expectation for LED output over life, but it does not tell you how fast your walls foul or how far your drivers drift. Your own logged measurements do.
Tie the checks to the earlier sections. The commissioning measurement validates the fixture-count calculation; the periodic re-check tells you when cleaning or replacement is due; and the trial data tell you whether the delivered PPFD is still on the right part of the saturation curve. Set the re-check interval from your own fouling rate and operating hours rather than adopting a generic figure.
Conclusion
Microalgae LED grow lights should be specified by delivered surface PPFD, matched in form factor to the reactor geometry, and supported by documented efficacy — with heat and cleaning treated as design inputs rather than afterthoughts.
The chain runs from target PPFD at the culture surface, through illuminated area and delivered PPF at the actual standoff, to fixture count, connected load, cooling requirement, and operating cost per kilogram. A small steady-state trial fixes the intensity and spectrum for your strain and finds the knee of the saturation curve, and commissioning measurements confirm that the installed system delivers what the design promised.
Spectrum and efficiency choices remain species-specific and worth revisiting as strains and products change. Before committing to a fixture order, assemble the vendor documentation checklist and run the PPFD-to-load calculation on your own geometry.
FAQ
What is the difference between PPF and PPFD for microalgae lighting?
PPF is the fixture’s total photon output in µmol s⁻¹. PPFD is the photon flux density arriving at the culture surface in µmol m⁻² s⁻¹. PPF is a property of the fixture; PPFD depends on mounting distance, beam angle, and the area covered, so the same fixture yields different PPFD in different reactors.
How many LED fixtures do I need for a given photobioreactor?
Required photon flux (target PPFD × illuminated area) divided by delivered PPF per fixture at the actual standoff, plus a uniformity allowance, then converted to connected watts. Nameplate PPF must be adjusted for real mounting conditions; see the calculation section above.
Is red or blue light better for microalgae?
It depends on species and product target. The 450 nm blue plus 660 nm red recipe is common because it targets chlorophyll absorption, but pigment and stress products may benefit from blue-enriched or high-light regimes. Check species-specific primary studies for your strain.
How much does artificial lighting add to microalgae production cost?
The WUR techno-economic study calculated that artificial light added roughly $25.3 per kilogram of dry-weight biomass in its modelled scenarios, and its authors concluded that artificial lighting fits high-value products while bulk production should favour sunlight. That is a published model result, not a universal figure.
What IP rating do LED lights need inside a photobioreactor facility?
IP ratings follow IEC 60529 and should be chosen from the actual exposure — spray, washdown, condensation, and immersion — rather than a default. Match the rating to the cleaning and mounting method and confirm it in the vendor documentation.
Can LED waste heat be recovered or must it be removed?
Most electrical input not leaving as photons becomes heat in the culture or room and must be managed by the cooling system. Whether any of it is useful depends on the facility’s temperature targets; see the heat and cooling section for the estimation method.
How do I know a vendor’s performance claims are reliable?
Verifiable claims come with LM-79 reports from an accredited lab, PPE values, LM-80/TM-21 lifetime data, and safety certification. DLC listing is a useful but horticulture-specific qualification. Commissioning measurements confirm delivered PPFD against the design.