Introduction
A greenhouse in December is a light-poor environment, and citrus is a light-hungry crop. Grafted trees that were budded in autumn sit through short days and low irradiance, and the result is slow budbreak, uneven shoot development, and a propagation cycle that stretches into spring. Supplemental LED lighting addresses that deficit directly: it raises the daily light integral (DLI) the canopy actually receives, and it does so on a schedule that keeps the crop on a predictable timeline rather than waiting on weather.
The outcomes worth expecting from a DLI-based greenhouse citrus lighting setup are narrower and more defensible than “faster growth”. You should expect a measurable reduction in winter DLI deficit, tighter uniformity across benches, and a documented relationship between delivered photons and the growth responses you care about — budbreak percentage, shoot length, caliper, and leaf area.
You should not expect a spectrum setting to override temperature, rootstock genetics, or irrigation practice. In published citrus work, response surface models explained only modest shares of plant-to-plant variation even when light treatment effects were significant, which is a useful calibration: lighting shifts the expected mean, and biological noise remains.
This guide is organized around four constraints that have to be satisfied together. Agronomically, the crop needs a target DLI and a photoperiod strategy. From an engineering standpoint, sensors, drivers, and interlocks must deliver that target repeatably. Financially, the system has to survive an honest payback model that includes heating penalties and tariff structure. And for compliance, fixtures and installation have to satisfy the authority having jurisdiction (AHJ) and, where incentives are involved, qualified products list (QPL) requirements. A design that satisfies three of these and fails the fourth is not a design — it is a future retrofit.
Agronomic Targets and Seasons
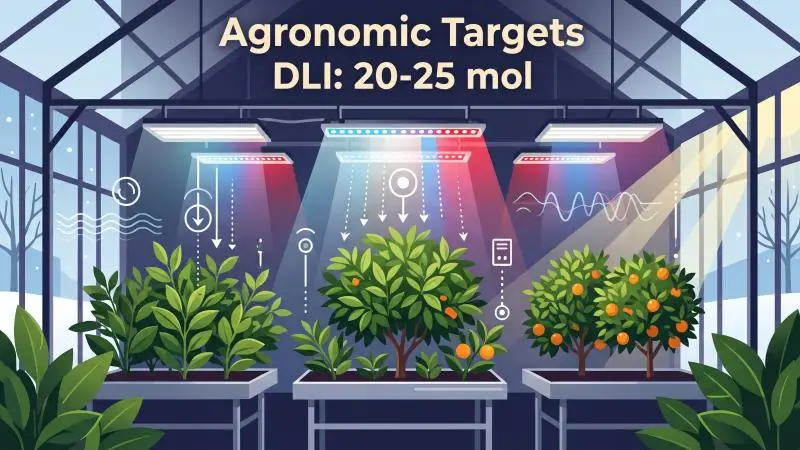
Calculated supplemental DLI from electric light only, using DLI = PPFD × hours × 0.0036. Natural greenhouse light is excluded; add your measured canopy DLI to each value to obtain the total. Cross-check: 200 µmol·m⁻²·s⁻¹ for 16 h gives 11.5, matching the 12 mol·m⁻²·d⁻¹ value in Virginia Cooperative Extension’s calculated DLI table (Table 4) for 16 hours at 200 µmol·m⁻²·s⁻¹.
DLI/PPFD Starting Points
DLI is the total photosynthetic photon flux density (PPFD, in µmol·m⁻²·s⁻¹) integrated over a day, expressed in mol·m⁻²·d⁻¹. It is the right control variable for a greenhouse because it accommodates both sunlight and electric light, and because plants respond to the daily total more than to instantaneous intensity within reasonable bounds.
For citrus nursery and container production, Bowman and Albrecht cite a DLI of 20 to 25 mol·m⁻²·d⁻¹ that Faust and Logan (2018) suggest is likely required for good growth, a figure the authors use when explaining why Florida winter greenhouse DLI falls short and why daylength extension is used rather than night interruption. Extension guidance places fruiting crops in the “very high light” band of 18 to 30 mol·m⁻²·d⁻¹, while noting that the correct DLI is partly economic rather than fixed.
Treat 20–25 as a starting reference for actively growing citrus, not a fixed target, and extend it to dwarf fruit trees only provisionally; adjust by stage: newly budded trees and rootstock liners have different marginal returns than trees being pushed toward fruit set.
The calculation that matters is the deficit, not the target. Virginia Cooperative Extension’s worked method subtracts the sunlight actually reaching the canopy from the desired DLI:
DLI deficit = desired DLI − (average outdoor DLI × greenhouse transmission)
Greenhouse glazing and structure typically transmit 50% to 70% of outdoor light, so a 40% loss assumption is a reasonable starting placeholder until you have site data. If December outdoor DLI is 10 mol·m⁻²·d⁻¹ and transmission is 60%, the canopy receives 6. A 22 mol target leaves a 16 mol deficit — which is a large electric load and a signal that the target may need to be staged rather than met in full.
Converting deficit to fixture runtime uses the standard relation: DLI = PPFD × hours × 0.0036, where PPFD is in µmol·m⁻²·s⁻¹. A system delivering 200 µmol·m⁻²·s⁻¹ at canopy level adds 0.72 mol·m⁻²·d⁻¹ per hour of operation, so a 16 mol deficit would require about 22 hours — not feasible. At 400 µmol·m⁻²·s⁻¹, the same deficit takes about 11 hours. This arithmetic is the first place a design either becomes realistic or reveals that the target DLI must be lowered, the photoperiod extended, or the installed PPFD increased. Run it monthly, not annually, because the deficit in October and the deficit in January differ substantially.
Photoperiod and Day-Extension
Citrus is not a short-day crop in the flowering sense that governs poinsettia scheduling, but winter vegetative growth responds strongly to daylength extension. The clearest published protocol extends the photoperiod to 16 hours using pre-dawn lighting, with the LED duration recalculated as the difference between 16 hours and the natural day length — six hours of supplemental light when the day is 10 hours, five when it reaches 11. Recalculating on a rolling basis as daylength changes by roughly 15 minutes keeps the total photoperiod stable while letting plants receive the full natural day.
Pre-dawn operation has practical advantages over evening extension in a greenhouse: it avoids running lights during the warmest part of the afternoon, it front-loads photons before canopy temperature peaks, and it leaves the evening free for cooling and humidity management. It also means the lighting schedule and the heating schedule can be coordinated rather than competing.
Two cautions. First, daylength extension and DLI supplementation are not the same intervention, and a 16-hour photoperiod delivered at very low PPFD will satisfy a photoperiodic response without closing a meaningful DLI gap. Decide which problem you are solving. Second, if you use night interruption instead of extension, Purdue Extension notes that both methods are generally similarly effective for creating long days and both require only about 2 µmol·m⁻²·s⁻¹ at plant level — but that is a photoperiodic dose, not a photosynthetic one. Do not size a DLI-closing system on night-interruption numbers.
Spectrum Starting Ranges
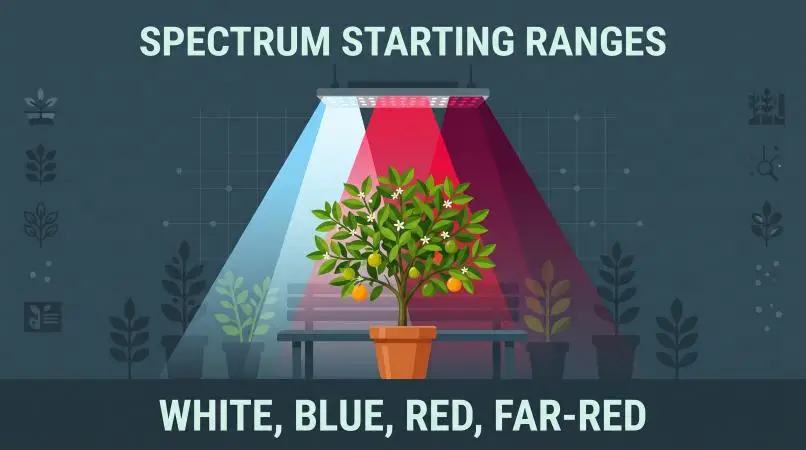
The citrus-specific spectral evidence is directional rather than prescriptive, and it comes largely from grafted nursery trees under winter supplementation. In a four-factor response surface study using independently controllable red (660 nm), blue (450 nm), white (5700 K), and far-red (735 nm) channels, blue and white light at higher intensities increased vegetative budbreak in both Carrizo and Rich 16-6 rootstocks, while red and far-red light reduced budbreak.
The greatest scion shoot growth occurred when red, blue, and white were combined at maximum intensity. Far-red alone did not enhance growth, but when added to red or white, it further increased shoot elongation and leaf area. Chlorophyll index was highest under blue and white and lowest under far-red.
A defensible starting spectrum follows from that: a broad white-plus-blue base to support budbreak and chlorophyll development, red included for dry weight and shoot growth, and far-red treated as a targeted additive rather than a base component. Because far-red reduced budbreak on its own while improving elongation in combination, the sequencing matters — a budbreak-phase recipe and a shoot-extension-phase recipe are legitimately different settings, and a tunable fixture is what makes that distinction operational.
Two scope limits belong with these findings. The study measured grafted nursery trees over 12 weeks after budding in a 21–27 °C greenhouse; it did not measure fruit yield, fruit quality, or mature tree performance, so spectral claims should not be extended to harvest outcomes. And the models were explicitly described as tools for identifying directional trends and optimal regions, not for precise numerical prediction of individual plants. Use the spectrum as a starting range, then verify against your own budbreak and caliper data.
Greenhouse Citrus Lighting Controls
Sensors and Placement
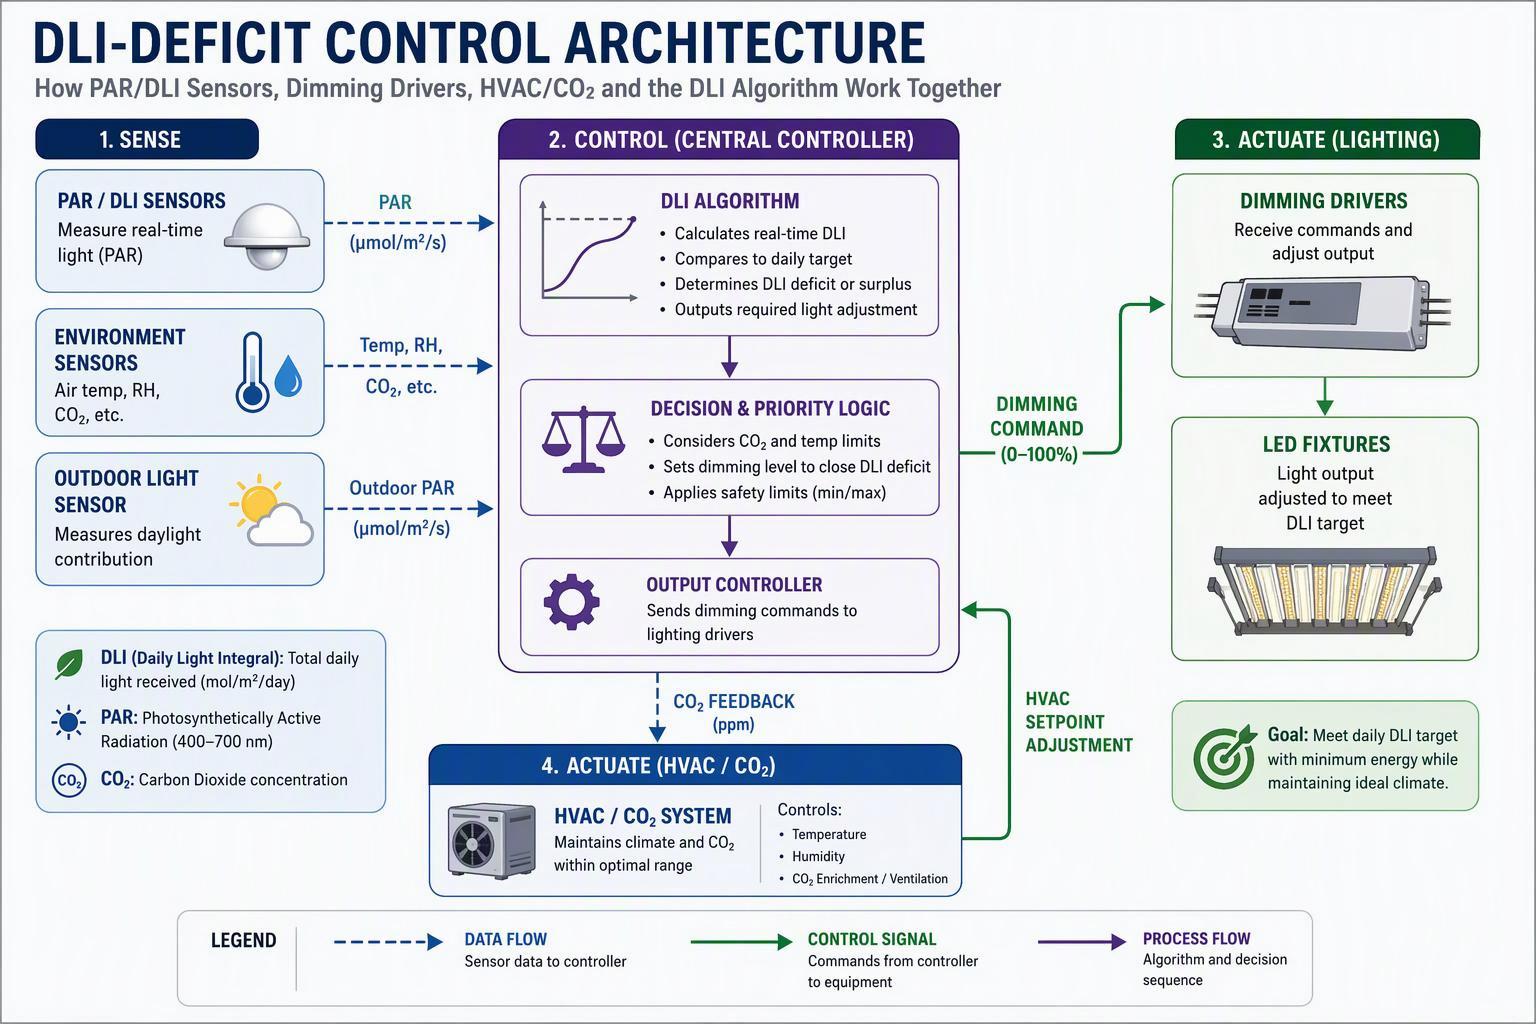
A DLI control loop is only as good as its input. The measurement chain has three parts: a quantum sensor sensitive to 400–700 nm, a data logger or controller sampling at intervals short enough to integrate a day, and a placement that represents the canopy rather than the room.
Placement is where most installations fail. Resource Innovation Institute guidance is direct on this point: sensors placed by the door or well above the canopy will not accurately reflect conditions at canopy level or within the canopy. A sensor at truss height in a greenhouse with a tall citrus canopy reads a substantially different PPFD than the leaves that are actually growing. Mount sensors at or just above the effective canopy top, in a location shielded from direct fixture output that does not represent the crop — a sensor sitting directly under a fixture at close range will overstate the average.
Use more than one sensor per control zone. A single point cannot distinguish a uniform zone from one with a hot center and dark edges, and the difference matters when you are trying to close a DLI deficit across a bench. Logging interval should be short enough that cloud transients do not dominate the daily integral; the citrus study cited above sampled every 150 seconds and averaged at 900 seconds, which is a reasonable reference for greenhouse logging.
Finally, plan for calibration drift. Quantum sensors drift slowly — on the order of less than about 0.5% per year for undamaged units — but they do drift, and a sensor that has been in a humid greenhouse for three seasons is not the sensor that was installed. Put recalibration on a schedule and record it.
DLI-Deficit Algorithms
The control logic most facilities actually need is a deficit tracker, not a fixed schedule. The algorithm accumulates measured sunlight DLI through the day, compares it against the target, and decides how much electric light to add and when.
A workable structure has four elements. First, a running sunlight integral from the canopy sensors, reset at the start of each photoperiod. Second, a target DLI for the current crop stage and month. Third, a projection of remaining natural light for the rest of the day, based on recent days or a clear-sky model, so the controller does not over-light on a morning that turns sunny at noon. Fourth, a decision rule that converts the projected deficit into a required supplemental PPFD and duration, subject to the photoperiod window.
The projection step is what separates a good algorithm from a reactive one. A controller that only responds to accumulated deficit will chase the sun and end up running at full power late in the day when it should have been dimmed earlier. A controller that projects forward can spread the required photons across the available window at lower intensity, which is generally better for uniformity and gentler on the electrical demand profile.
The Department of Energy’s horticultural lighting discussion materials make the complementary point: LED dimming and instantaneous switching enable systems that respond to fluctuating daily sunlight and to variable electricity pricing, and many plants tolerate light-level fluctuation as long as the target DLI is achieved. That tolerance is the license for a deficit algorithm. It is also a limit — tolerance to fluctuation is not tolerance to a missed target, so the daily integral is the number that has to close.
One design decision deserves explicit treatment: whether the controller is allowed to exceed the target on bright days. Resource Innovation Institute guidance suggests setting DLI setpoints slightly below target in seasons when sunlight is expected to exceed it, unless shading is integrated to prevent overshoot. In a winter citrus program, the overshoot risk is low, but in shoulder seasons it is real, and the setpoint should be seasonally scheduled rather than fixed.
Dimming, Interlocks, and Guardrails
Dimming is the actuator, and its compatibility determines whether the control strategy is achievable. Verify the dimming protocol and range before specifying: 0–10 V control is common and widely supported, but the fixture’s minimum dim level, its behavior at the bottom of the range, and its response curve all affect how precisely a deficit algorithm can hit its target. A fixture that will not dim below 20% cannot deliver a small top-up dose, and a fixture with a non-linear response will need a calibration table rather than a simple scaling factor.
Guardrails belong in the control layer, not in operator memory. At minimum:
- Photoperiod lockout. A hard limit on total hours of electric light per day, independent of the DLI calculation, so a sensor fault cannot run fixtures around the clock.
- Sunrise/sunset interlocks. Prevent supplemental operation outside the intended window, and prevent conflict with shade or thermal screens.
- Over-temperature cutoff. Fixture- or canopy-temperature-based shutdown, coordinated with the HVAC system rather than fighting it.
- Sensor fault detection. A stuck-high or stuck-low sensor should trigger a fallback schedule, not a full-power run. Compare redundant sensors and alarm on divergence.
- Maximum demand limiting. Cap total connected load ramping so lighting does not trip a demand charge threshold or a facility breaker.
- Manual override with timeout. Service access needs an override; it should expire automatically.
Interoperability deserves attention at specification time. The DOE materials note the value of interoperability among fixtures and controls from different manufacturers — a practical concern for multi-site operators who may not buy the same fixture twice. Ask for the control interface documentation, not just the dimming claim.
Commissioning and Uniformity
Mapping and Acceptance Criteria
Uniformity is the difference between a design that works on average and one that works everywhere. A bench that averages 300 µmol·m⁻²·s⁻¹ but ranges from 180 at the edges to 420 in the center will produce uneven budbreak and uneven caliper, and the average will hide it.
Map before you accept. Take grid measurements with a quantum meter across the canopy area at the intended mounting height, spaced closely enough that the grid resolves the pattern rather than sampling it. Resource Innovation Institute guidance is to measure in enough locations that the average is statistically significant and to compare the result against the target PPFD for the growth stage. Record the grid, not just the average.
For acceptance criteria, a minimum-to-average uniformity ratio (often written U₀, the minimum divided by the average) of 0.75 or higher is a practical starting benchmark, with more demanding operations targeting 0.85 or higher. Set the criterion in the specification before installation, because it determines fixture spacing, mounting height, and whether linear runs or point fixtures are appropriate. Continuous runs of linear fixtures generally improve uniformity relative to grids of point-source fixtures, and consistent spacing in both directions matters more than any single fixture’s output.
Also map the edges deliberately. Fixture layout and spacing determine light levels at bench edges, and edge benches are where uniformity claims most often fail. If the edge cannot meet the criterion, either move the crop, add a row, or accept a documented lower target for that zone — but decide it rather than discovering it.
Calibration and Verification
Commissioning has two halves: making the system read correctly, and proving it delivers what it reads.
Calibration starts with the sensors. Verify each quantum sensor against a reference or a clear-sky check, record the correction factor, and apply it in the controller. Confirm the logger’s integration interval and confirm that the DLI calculation in the controller matches a hand calculation from raw logged data. A controller that computes DLI with the wrong time base will be consistently wrong in a way that looks plausible.
Verification then moves to the light. With sensors calibrated, run the fixtures at defined output levels and measure PPFD at the canopy grid. Compare measured PPFD against the fixture’s published output at that dim level and mounting height. Discrepancies point to mounting height error, dimming curve mismatch, voltage drop on long runs, or dirty optics — all of which are correctable and all of which silently degrade a DLI program.
Verify the control logic itself with a scripted test. Simulate a cloudy day and confirm the controller adds light; simulate a bright day and confirm it does not overshoot; disconnect a sensor and confirm the fallback engages; drive the zone above the photoperiod limit and confirm the lockout holds. Document the results. This documentation is also what an efficiency program or a commissioning agent will ask for.
Operational Playbooks
A commissioned system still needs operating procedures, because the people running it change shifts and the seasons change the inputs.
Seasonal transition playbook. Recalculate the monthly DLI deficit at each season boundary, adjust the target DLI setpoint, and update the photoperiod window. Record the change and the reason.
Spectral phase playbook. If the fixture is tunable, define a budbreak-phase recipe and a shoot-extension-phase recipe, with the switch triggered by crop stage rather than calendar date. Verify each recipe with a PPFD and spectrum measurement at changeover.
Fault response playbook. Define what happens on sensor failure, driver failure, and communication loss, including the fallback schedule and who is called. A lighting system that fails to a safe default is an asset; one that fails to full power is a risk.
Verification playbook. Schedule sensor recalibration, PPFD re-mapping after any fixture or glazing change, and an annual review of the DLI targets against actual crop performance.
As a concrete illustration of what to look for in the hardware behind these playbooks, SLTMAKS publishes fixture specifications that map onto the criteria above: full-spectrum output across roughly 380–780 nm, 0–10 V dimming with daisy-chain capability for zone control, auto-sensing drivers covering 120 V, 277 V, 347 V, and 480 V commercial service, and a certification portfolio that includes ETL, DLC, CE, RoHS, FCC, and UKCA listings.
Those are the attributes to check against your own specification — not because any single brand is required, but because the checklist they represent (efficacy, dimming compatibility, voltage flexibility, third-party listing) is the same checklist every candidate fixture should be held to. For a multi-site operator, the practical question is whether a candidate fixture’s dimming interface and voltage range match the controls and service you already have, and whether its listings are accepted in each jurisdiction you operate in.
Energy, ROI, and Compliance
The DLC threshold is a program requirement for QPL listing. The LED and HPS figures are a manufacturer’s category statement from a retrofit guide, not measured head-to-head data, and far-red photons do not count toward PPE.
Efficacy Benchmarks and Tariffs
Photosynthetic photon efficacy (PPE) is the fixture’s photon output per unit of electrical input, in µmol·J⁻¹. It is the number that drives both energy cost and, increasingly, eligibility for incentives.
The current benchmark is set by the DesignLights Consortium’s Horticultural Technical Requirements V4.0, effective for applications from April 18, 2025, which raised the minimum PPE threshold to 2.5 µmol·J⁻¹ — an 8.7% increase over V3.0. The DLC states that this places the LED threshold more than 45% above the most efficacious non-LED option, the 1000 W double-ended high-pressure sodium luminaire, and that the increase delists roughly 11% of previously listed products.
V3.0 listings are scheduled for delisting on January 5, 2026. For a procurement team, that timeline matters: a fixture specified from an older QPL snapshot may not be listed by the time the project is commissioned.
Note also that far-red photons do not count toward PPE calculations, per Resource Innovation Institute guidance. A fixture marketed on a very broad spectrum that includes substantial far-red will have a lower effective PPE than its total photon output suggests. If far-red is part of your recipe, account for it as a separate line item rather than folding it into the efficacy comparison.
On the tariff side, the payback sensitivity is dominated by two variables: electricity rate and annual operating hours. Industry ROI guidance makes the point plainly — above roughly $0.15 per kWh, the payback of an efficient upgrade accelerates significantly, and a facility running lights 18 hours a day recoups investment far faster than a greenhouse using supplemental light four hours a day in winter. A citrus greenhouse in a winter-only supplementation regime sits at the low-hours end, which means the payback case rests more heavily on efficacy, on the value of the growth response, and on any incentive captured than on hours displaced.
That has a design consequence. If your operating hours are low, the marginal value of the highest-efficacy fixture is smaller in absolute dollars than in a high-hours facility, and the case for controls, uniformity, and verified spectrum may be stronger than the case for the last few percent of PPE. Model both.
HVAC Interactions and Seasonal Tuning
LEDs convert electricity to photosynthetic photons more efficiently than HPS, which means less waste heat per delivered photon. That is an energy benefit in summer and a heating penalty in winter, and the penalty has to be modeled explicitly rather than assumed away.
Industry retrofit guidance puts commercial LED efficacy at roughly 2.7–3.8 µmol·J⁻¹ against HPS at seldom more than 1.8 µmol·J⁻¹, an improvement of more than 50%, and reports that LEDs reduced lighting energy use by 40% and overall greenhouse energy use by 10–25% in the cases cited.
The same guidance is candid that some growers value HPS inefficiency because the infrared output contributes to heating, and that heat from electrical lighting is usually more expensive than combustive heat sources. The strategic move is to decouple lighting from heating: use efficient LEDs for photons and a dedicated heating system for heat, so each can be controlled on its own terms.
Seasonal tuning follows from that decoupling. In deep winter, the lighting schedule and the heating schedule should be coordinated so that pre-dawn lighting does not coincide with the coldest hours in a way that increases canopy-to-air temperature differential or triggers unnecessary ventilation. In shoulder seasons, the constraint flips: low-heat LEDs allow lighting to continue later into spring than HPS would permit, because the thermal load is lower. Industry guidance notes exactly this — that with low-heat LEDs, lighting can run into late spring for production gains that were not possible with HPS.
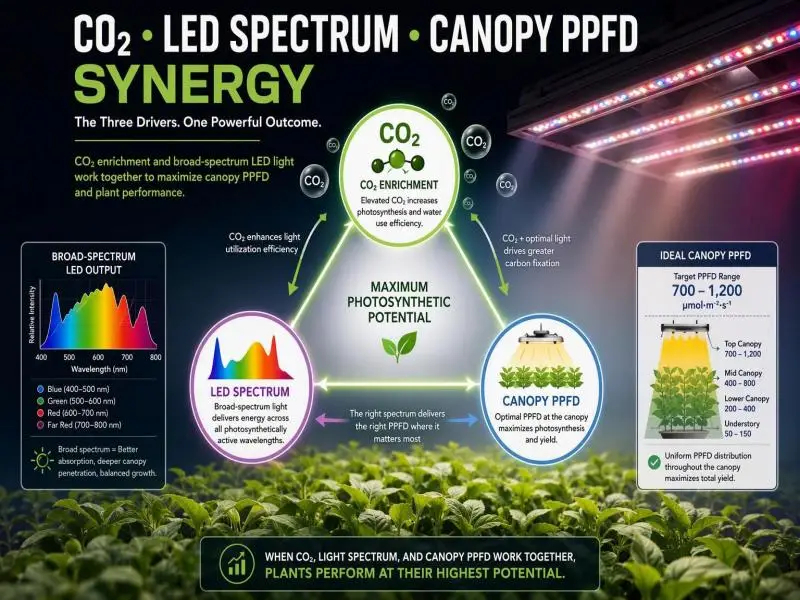
CO₂ is the third leg. If the facility enriches CO₂, lighting hours increase demand, and the enrichment strategy should be scheduled against the lighting schedule rather than independently. A DLI controller that knows the CO₂ setpoint can avoid running at full light during periods when CO₂ is depleted, which is a photosynthetic efficiency question as much as an energy one.
Safety Certifications and Inspections
The compliance question is not whether a fixture has certifications, but whether it has the right ones for the jurisdiction and the installation.
Start with the AHJ. Certification guides are consistent that the first step is confirming which nationally recognized testing laboratory (NRTL) mark your AHJ accepts — UL, ETL, CSA, and TUV marks are common, but acceptance varies. For horticultural fixtures, UL 8800 is the relevant safety standard, and Resource Innovation Institute guidance recommends requesting and reviewing the UL 8800 safety test reports produced by certified laboratories rather than relying on a mark alone. Code officials may impose special requirements on facilities operating equipment not rated by national testing labs.
Wet-location and humidity ratings matter in a greenhouse in a way they do not in a dry indoor room. Condensation on fixtures, irrigation overspray, and washdown practices all bear on whether the installed rating is adequate. Confirm the fixture’s environmental rating against the actual conditions at the mounting height, and confirm that drivers and connections are rated for the same environment as the fixture.
Incentive eligibility is a separate check from safety. A DLC listing does not automatically qualify a fixture for a utility rebate — Resource Innovation Institute guidance is explicit that you should not assume a DLC-listed fixture qualifies and should check with your efficiency program partner before purchasing. Confirm the program’s current QPL version, since the V4.0 transition changes which products are listed.
Finally, build the inspection file. An inspector or program reviewer will ask for test reports, listings, installation drawings, commissioning records, and the calibration log, and assembling them at commissioning is far cheaper than reconstructing them after a failed inspection.
Conclusion
The setpoints worth standardizing across sites are a small set, and standardizing them is what makes multi-site comparison possible. A target DLI band by crop stage (with 20–25 mol·m⁻²·d⁻¹ as the citrus planning reference), a 16-hour photoperiod with pre-dawn extension recalculated as daylength changes, a minimum-to-average uniformity criterion of at least 0.75 with 0.85 as the stretch target, a PPE floor at or above the current 2.5 µmol·J⁻¹ DLC threshold, and a fixed set of control guardrails — photoperiod lockout, over-temperature cutoff, sensor fault fallback, and demand limiting.
These numbers and rules should be identical in every facility, so any difference in outcome points to execution rather than specification.
Stage the rollout rather than committing a portfolio at once. A pilot zone should be large enough to contain a full control zone and a representative edge, instrumented well enough to produce a defensible DLI record, and run long enough to cover a meaningful part of the winter deficit period. Compare the pilot against a matched control zone on budbreak percentage, shoot length, caliper, and leaf area — the responses the citrus literature actually measures — and record the delivered DLI alongside them.
Predictable ROI comes from that pairing: measured photons against measured growth, with the energy and heating penalty modeled on the same interval. Scale when the pilot’s delivered DLI matches design, and the growth response is distinguishable from biological noise; do not scale on a single harvest’s impression.
The integration step is where most of the remaining value sits. A lighting system that runs on its own schedule will fight the climate controls; one that shares DLI, temperature, CO₂, and tariff signals with them can spread photons across the available window, avoid peak-demand periods, and coordinate pre-dawn lighting with heating. That integration is a controls project as much as a lighting project, and it is worth specifying the interfaces — dimming protocol, sensor inputs, communication standards — at the same time as the fixtures, so the two systems can be commissioned together rather than reconciled later.
FAQ
How much supplemental light does a greenhouse citrus tree need in winter?
Plan around a daily light integral of roughly 20–25 mol·m⁻²·d⁻¹, then size the fixtures to close the gap between that target and the sunlight your canopy actually gets. In mid-winter that gap is often large, so most programs stage the target rather than trying to meet it in full. Run the numbers monthly — the October and January deficits are not the same problem.
Is 16 hours the right photoperiod for citrus under LED lights?
Sixteen hours is a well-documented starting point, usually delivered as a pre-dawn extension so the natural day is not cut short. The LED runtime is simply 16 hours minus your natural daylength, recalculated as the season shifts. Keep in mind that a long photoperiod at low intensity satisfies a daylength response but won’t close a DLI deficit — decide which one you’re solving.
What spectrum should I use for citrus budbreak and shoot growth?
Start with a broad white-plus-blue base, which has been associated with stronger budbreak and chlorophyll development, and add red for shoot growth and dry weight. Treat far-red as a targeted additive rather than a base component, since it can reduce budbreak on its own while improving elongation in combination. A tunable fixture lets you switch between a budbreak-phase recipe and a shoot-extension recipe.