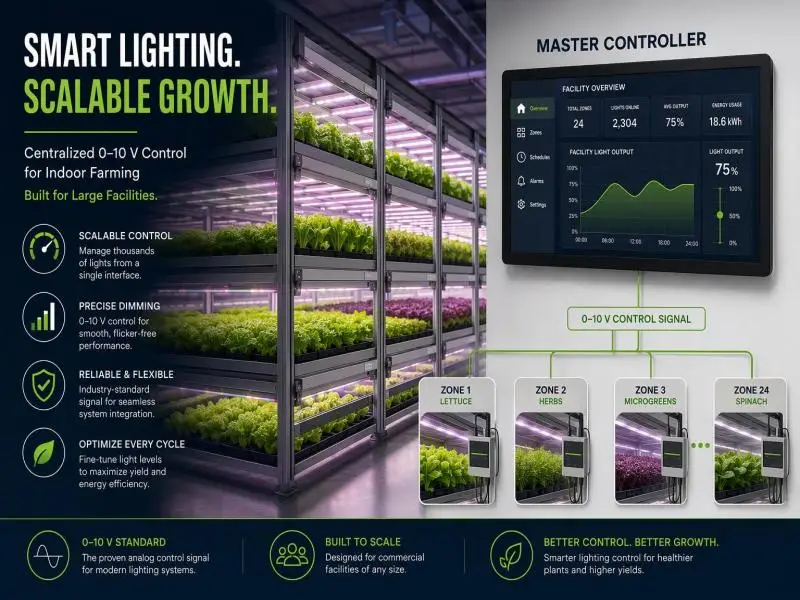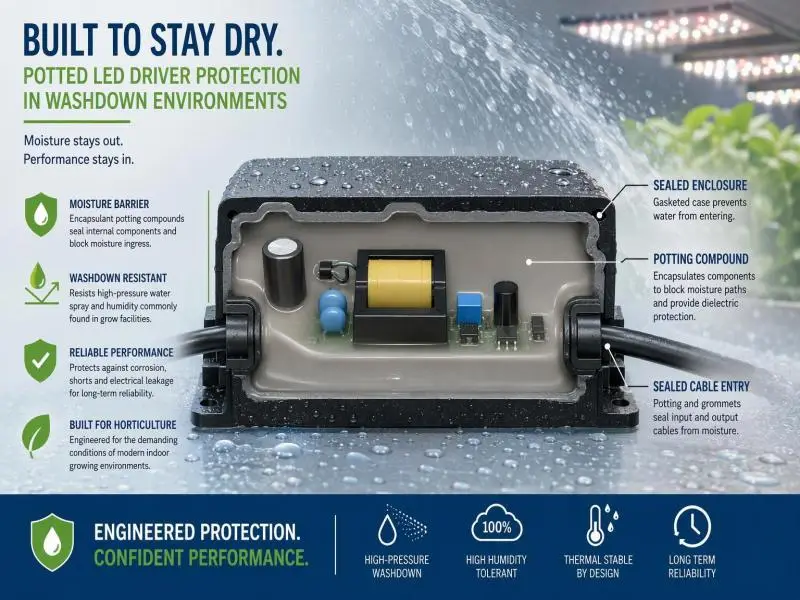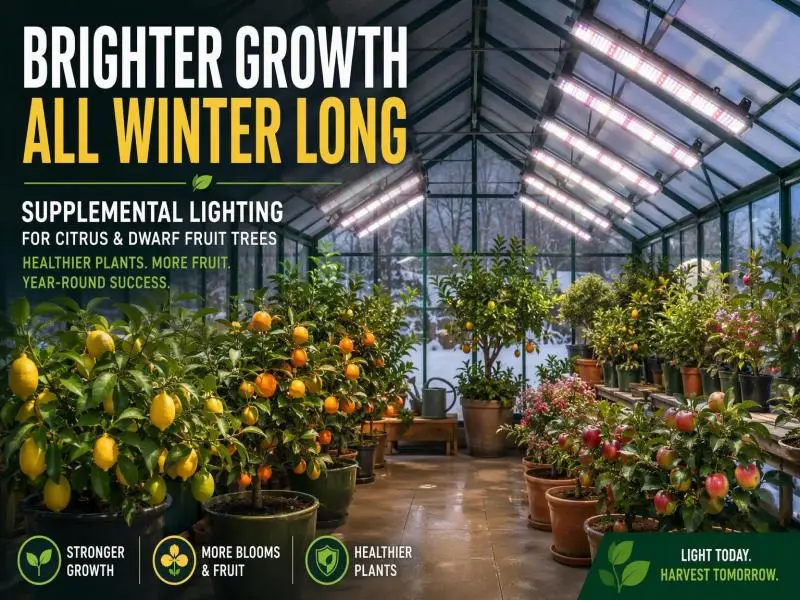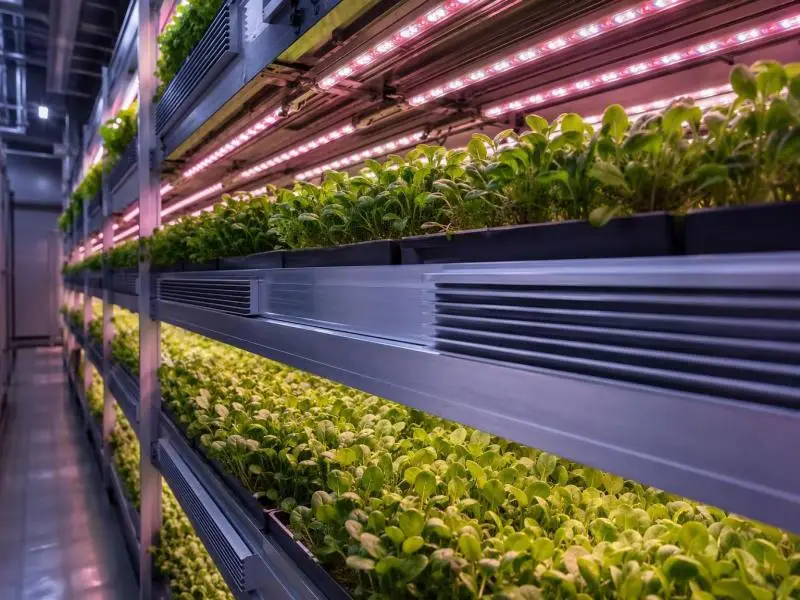
Introduction
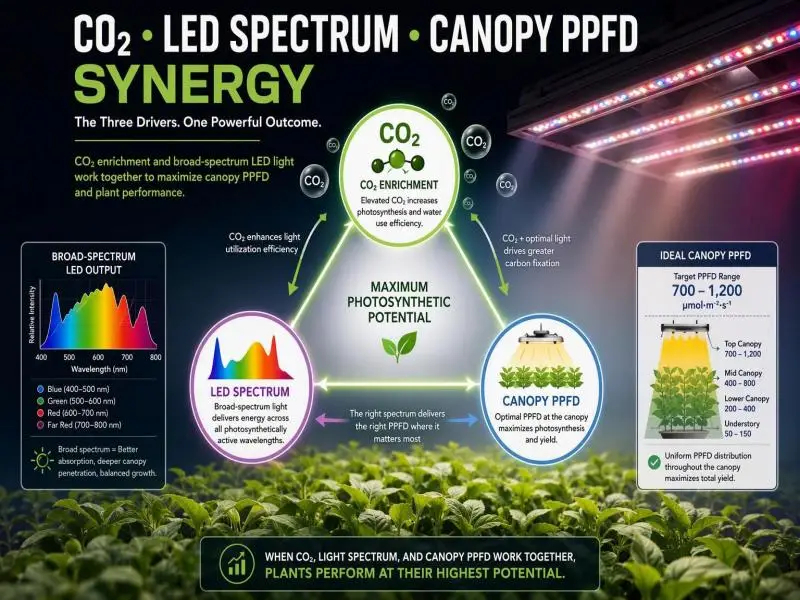
Elevated CO2 and high photosynthetic photon flux density (PPFD) are not independent upgrades; they are a matched pair. Adding light raises the ceiling on photosynthesis only if the leaf has sufficient CO2 to keep Rubisco working and suppress photorespiration. Running one without the other yields only a fraction of the potential benefit, as adding CO2 delivers its return only when light is no longer the limiting factor.
For a commercial indoor operation, a retrofit that raises canopy PPFD from 500 to 900 µmol m⁻² s⁻¹ without touching CO2 leaves the crop partly light-saturated at ambient concentrations. Conversely, an enrichment system sized for 1,000–1,200 ppm without the light to match wastes gas on a canopy unable to utilize it. This pairing is where the yield, energy efficiency, and return on investment (ROI) actually live.
Your objectives for this evaluation are threefold. First, yield: a defensible, measured gain per square metre per cycle, not a vendor figure. Second, efficiency: joules of electricity and kilograms of CO2 per unit of harvested dry matter, including the HVAC load that both interventions shift. Third, compliance: a CO2 system that passes inspection by the authority having jurisdiction (AHJ) and protects the people who work in the room.
Treat ROI validation and safety as parallel workstreams, not sequential ones. Safety design determines the hardware, the interlocks, and the documentation you will need anyway; ROI design determines the trial you run after commissioning. Both should be scoped before the first fixture or cylinder is ordered, because retrofitting gas detection into a finished room is far more expensive than designing it in.
Table of Contents
Shifting Light-Response Curves with a CO2 Enrichment Broad-Spectrum LED System
CO2 Shifts Light-Response Curves
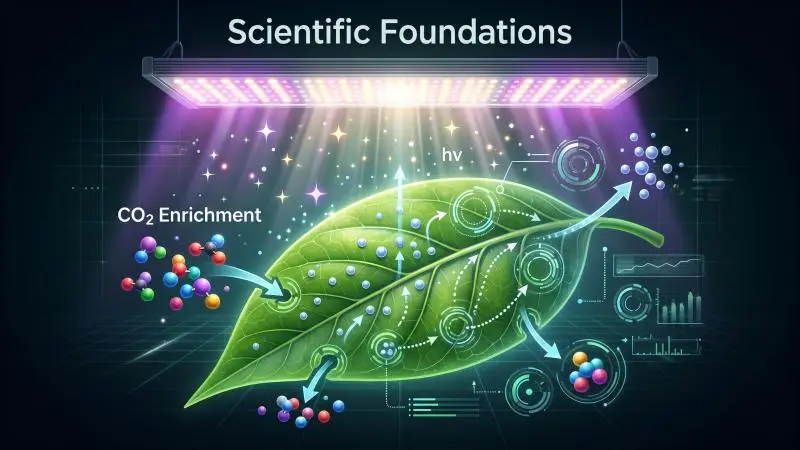
The light-response curve of a C3 leaf describes net photosynthesis against irradiance. At low light, the curve rises steeply; at higher light it bends and eventually flattens as the capacity to regenerate ribulose-1,5-bisphosphate (RuBP) and process the products of carbon fixation becomes limiting. Raising CO2 concentration changes the shape of that curve, not just its height.
The mechanism is well established. Rubisco catalyses both carboxylation and oxygenation of RuBP; the oxygenation pathway leads to photorespiration, which loses recently fixed carbon. Higher CO2 concentration favours carboxylation over oxygenation, so less of the light energy captured is wasted. Long et al. (2006) note that Rubisco is already the most abundant soluble protein in crop leaves, at roughly half of leaf soluble protein, and that its catalytic rate is slow compared with most enzymes — which is why so much of it is needed and why its kinetic limits matter so much to canopy productivity (Long et al. 2006).
The practical consequence for a grower is that the light level at which additional PPFD stops paying back is not fixed. It moves upward as CO2 rises. A canopy that is near saturation at ambient concentration can still respond to more light at enrichment concentration. That is the physiological basis of the synergy, and it is why the two investments should be sized together.
PPFD Thresholds and DLI Ranges
Photosynthetic photon flux density (PPFD) is the instantaneous photon flux reaching the canopy, in µmol m⁻² s⁻¹. Daily light integral (DLI) is the accumulated total over a photoperiod, in mol m⁻² d⁻¹. DLI is the more useful planning variable because it integrates intensity and duration, and because the same DLI can be delivered by different intensity–duration combinations with different consequences for leaf temperature and morphology.
There is no universal target. The appropriate DLI depends on species, cultivar, growth stage, temperature, VPD, and — critically for this article — CO2 concentration. What the literature does support is a pattern: CO2 enrichment raises photosynthetic rate to at least about 1,200 ppm, but the response is non-linear, and gains shrink as concentration rises (AHDB CO2 best practice guide). The same diminishing-returns logic applies to light. The two curves interact, so the economic optimum sits where the marginal cost of another mol of DLI equals the marginal cost of another 100 ppm of CO2 — and that point is specific to your facility.
Two cautions belong here. First, the AHDB guidance that raising CO2 to 1,000 ppm increases photosynthesis by about 50% over ambient is explicitly described as a rule of thumb for most crops at a given PAR level, and the underlying data are for tomato; it is a planning heuristic, not a guarantee for your cultivar. Second, published saturation ranges (roughly 1,000–1,300 ppm for many crops under ideal conditions, lower for seedlings and lettuce) are recommendations from extension and industry guidance, not regulatory limits. Confirm targets against your own crop trials.
CO2 Enrichment with Broad-Spectrum LED
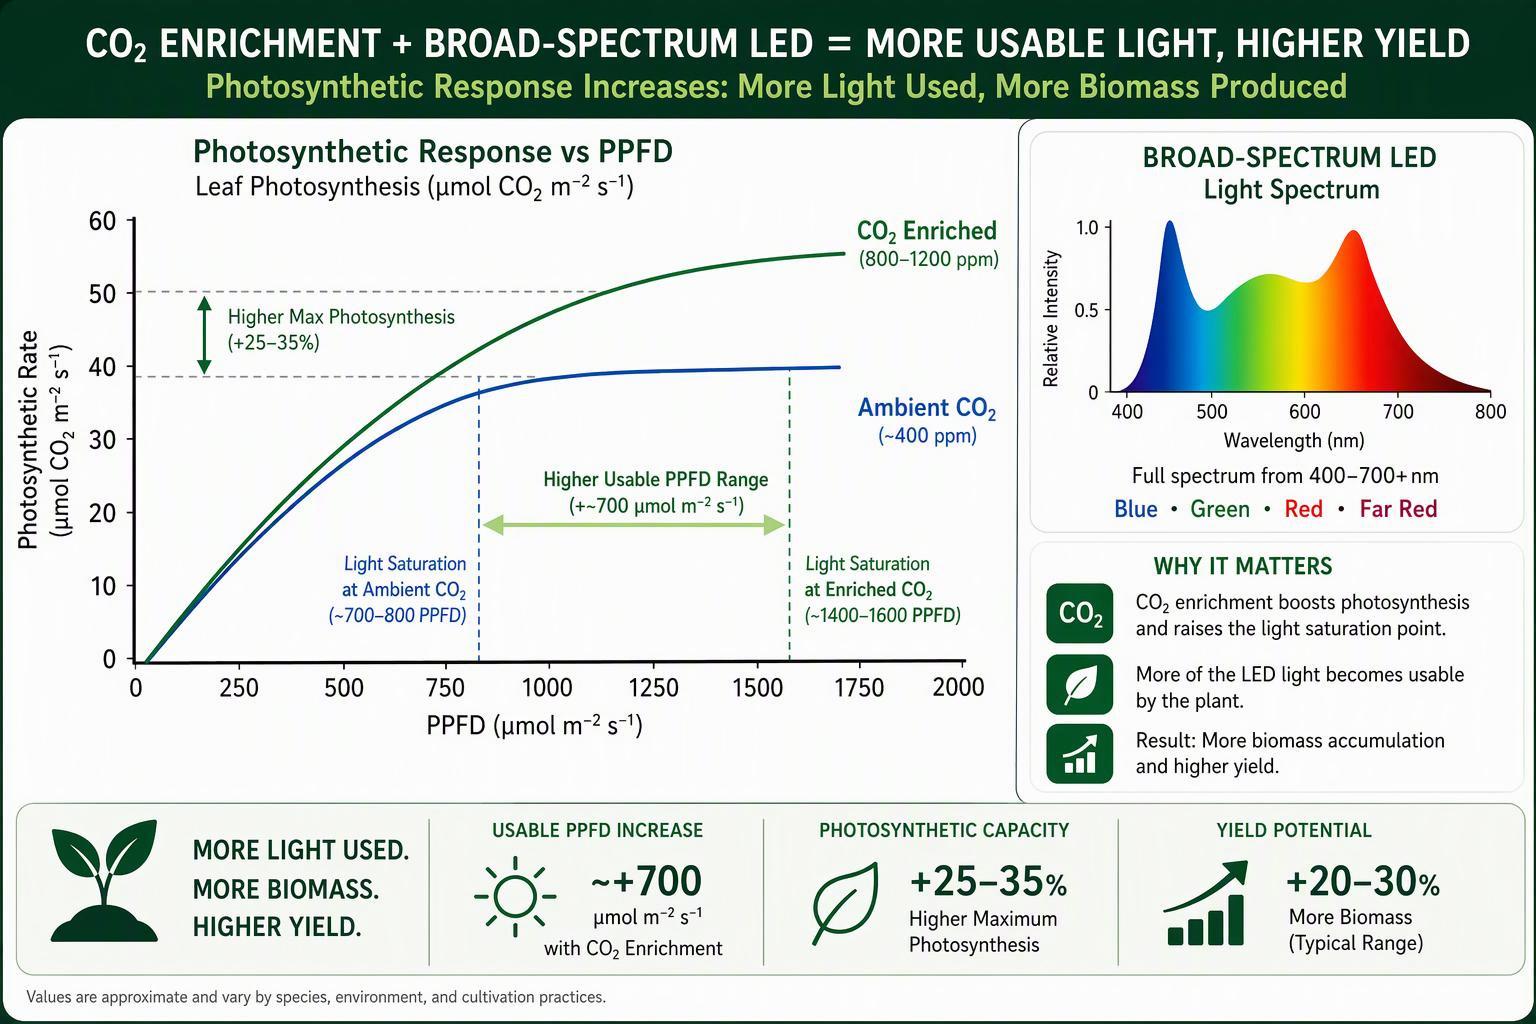
Broad-spectrum LEDs matter to this pairing because they deliver photons across the wavebands that drive photosynthesis and the photomorphogenic responses that shape canopy architecture. A narrow-band fixture can produce high PPFD numbers while leaving gaps in the spectrum that affect leaf expansion, internode length, and the red-to-far-red balance the phytochrome system reads.
When you combine enrichment with high PPFD from LEDs, three interactions deserve attention in the design.
- Canopy demand rises. Higher PPFD and higher CO2 both increase assimilation, so the crop draws down CO2 faster during the photoperiod. In a tightly sealed room, depletion below ambient is a real risk; USDA-ARS measurements cited in extension guidance found winter levels of 300–330 ppm in sealed greenhouses, and as low as 175–200 ppm in extreme cases (OptimIA CO2 Toolkit).
- Stomatal conductance falls. Elevated CO2 reduces stomatal conductance, which tends to reduce transpiration per unit leaf area. This interacts with VPD management and irrigation scheduling, discussed below.
- Acclimation is possible. Prolonged enrichment can reduce Rubisco content in some crops, lowering photosynthetic efficiency over time even though long-term yield remains higher than unenriched controls. The AHDB guide notes acclimation is likely to occur faster at higher concentrations and that interrupting application for a few days would be expected to improve the response — an area it flags as still of research interest rather than settled practice.
The design implication is that enrichment capacity, sensor response time and control logic must be sized for the drawdown that high PPFD creates, not for a low-light baseline.
Practical Deployment
Dosing Schedules and Interlocks
Photosynthesis happens in the light, so enrichment belongs in the photoperiod. Extension guidance recommends starting enrichment about one hour after sunrise and ending two to three hours before sunset in greenhouse settings, and enriching during night-time supplemental lighting when that is used (OptimIA CO2 Toolkit). In a sealed indoor room, the equivalent logic is: enrich when the lights are on and the space is closed, and stop when ventilation or cooling requires outside air exchange.
Capacity sizing should follow the same source’s planning figures. Nederhoff’s estimate, cited in the AHDB guide, is a dosing capacity of 70–130 kg/ha/hr to reach 900 ppm with vents closed, rising to 190–580+ kg/ha/hr once vents begin to open. Those numbers are for greenhouse conditions and should be treated as a starting point for calculation, not a specification.
The interlock architecture is where safety and compliance converge. A workable sequence for a commercial room:
- CO2 sensor reads above setpoint (commonly 5,000 ppm, matching the OSHA permissible exposure limit) → close the supply solenoid at the source.
- Solenoid fails closed on power loss — this is a design requirement, not an option.
- Audible and visual alarm activates locally, with the strobe tinted so it cannot be confused with the fire alarm.
- Mechanical exhaust activates and runs until concentration falls below the setpoint.
- Enrichment cannot restart until the alarm is reset by an authorised person.
Clark County, Nevada publishes a permit guide that codifies much of this for cultivation facilities, including sensor density (one per room or one per 10,000 sq ft, whichever is less), mounting height, signage wording, exhaust intake placement within 12 inches of the floor, and the requirement that the system activate as intended (Clark County permit guide).
It is one jurisdiction’s interpretation of the International Fire Code and NFPA 55, not a national standard, but it is a useful checklist for what an AHJ may ask for. Note also that the guide states unvented CO2 generators are not allowed there because they lack a UL listing for the purpose — a reminder to confirm local acceptance of any combustion-based source before specifying it.
Sensors and Stratification
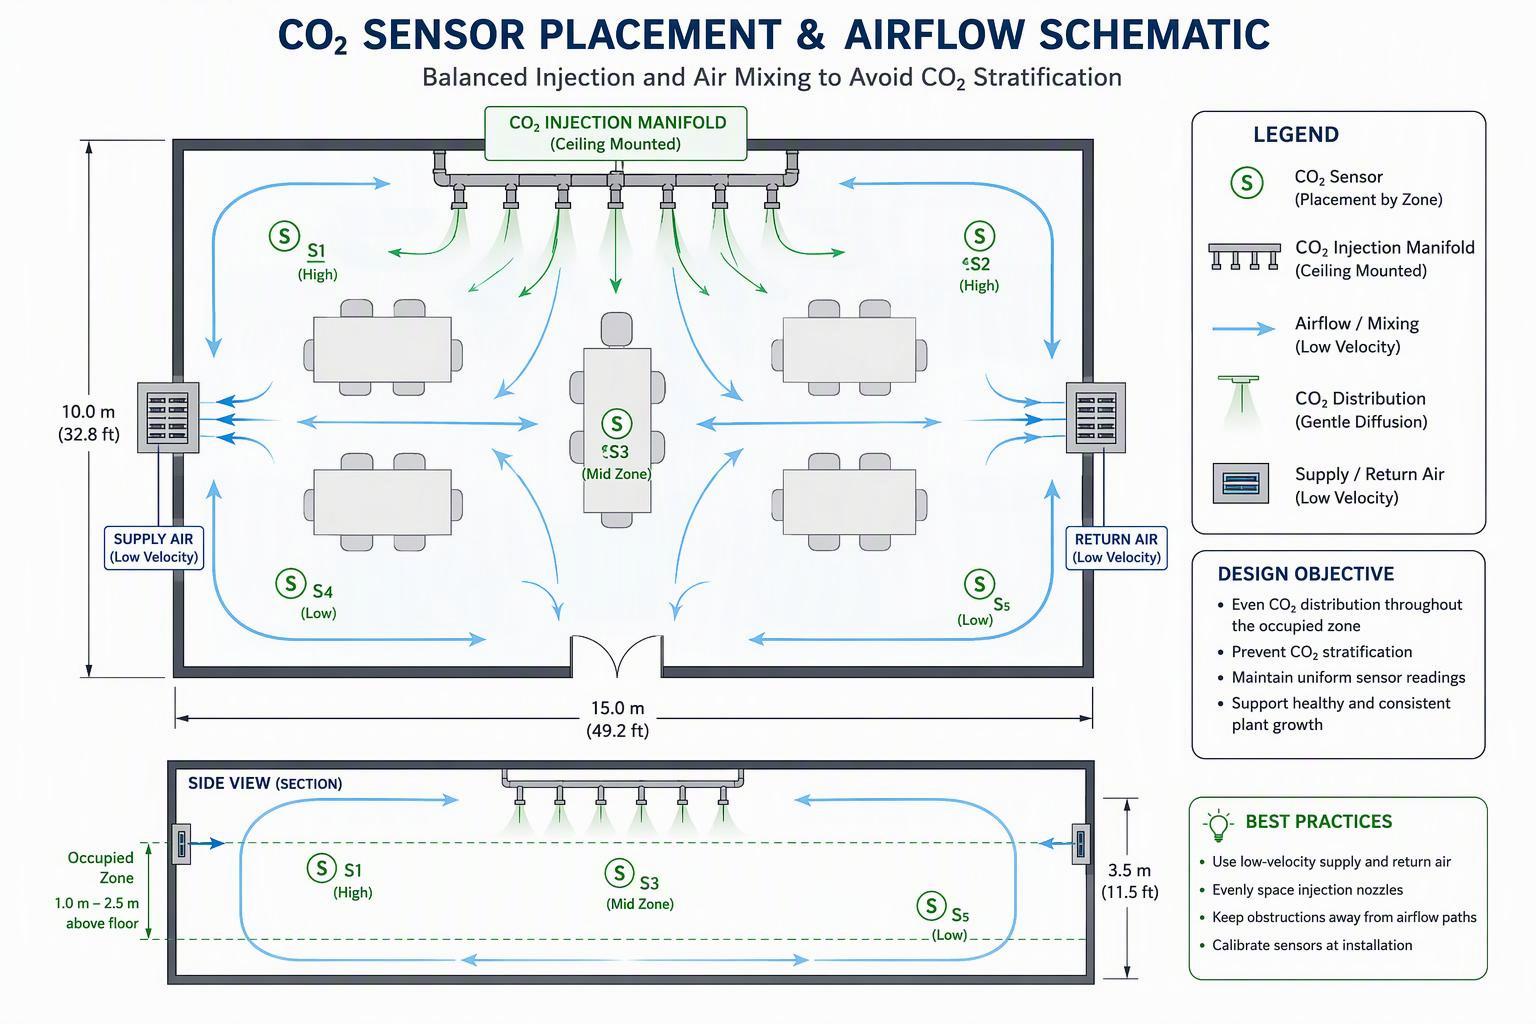
CO2 is about 1.5 times as dense as air (vapor density 1.53 per OSHA’s chemical database), so it tends to accumulate low in a still room. Plants also create localised depletion zones at the canopy during peak assimilation. A single sensor at one height will misrepresent both conditions.
Industry gas-detection guidance for enrichment applications describes a two-sensor approach per zone: one at 72–84 inches (plant-health control) and one at 12–18 inches (life-safety monitoring), covering roughly 3,000 sq ft per pair, with networked architectures for larger facilities (Critical Environment Technologies). That is vendor application guidance, not a code requirement, but it reflects the physical problem: the concentration the crop experiences and the concentration a worker at floor level could encounter are different measurements with different purposes.
Sensor selection and maintenance matter as much as placement. Non-dispersive infrared (NDIR) sensors cover the 0–50,000 ppm range needed for both control and safety, and require regular calibration because the high humidity and temperature swings of a grow room affect accuracy. ASHRAE’s position document is a useful corrective to over-reading any single CO2 number: indoor CO2 is not an overall indicator of air quality, and its relationship to ventilation depends on assumptions that must hold for the measurement to mean anything (ASHRAE). In a cultivation room, CO2 is a control variable and a hazard, not a proxy for general air quality.
Stratification is managed with air movement, not with more sensors. Horizontal airflow fans that keep canopy air mixed, supply air introduced at the right height, and exhaust intakes placed low all reduce the vertical gradient. Verify the gradient empirically after commissioning: log the low and high sensors simultaneously across a full photoperiod and at night, and compare the spread against your control tolerance.
HVAC, VPD, Irrigation Coordination
Enrichment and climate control compete for the same air. Every cubic metre of outside air brought in for cooling or dehumidification dilutes the CO2 you paid for. The control sequence should therefore decide, in a defined order, whether the room is in enrichment mode or ventilation mode, and it should never run both against each other.
Vapour pressure deficit (VPD) is the second coupling. Elevated CO2 reduces stomatal conductance, which tends to lower transpiration; higher PPFD raises leaf temperature and can raise transpiration. The net effect on crop water use depends on which dominates under your conditions, and the AHDB guide is explicit that the overall effect of CO2 supply on crop transpiration is a relatively small decrease whose extent depends on conditions. Do not assume a fixed reduction in irrigation demand — measure it.
Irrigation scheduling should be reviewed whenever light or CO2 setpoints change. Substrate moisture, EC, and drainage fraction are the practical feedback signals; a crop under higher DLI and enrichment can move more water and nutrients per day even with lower conductance per unit leaf area. Dehumidification load also rises with higher transpiration, which feeds back into the ventilation-versus-enrichment conflict. Model the HVAC capacity against the new light and CO2 envelope before committing, because cooling and dehumidification are where retrofit budgets most often overrun.
Spectrum and Uniformity
Fixture Selection and Spectrum Stability
For a commercial operator, fixture selection is a documentation exercise as much as a photometric one. The questions that decide a procurement are: what does the photometric file show at canopy height, what does the electrical certification cover, what happens to the spectrum and output over the warranty period, and what is the support path if a driver fails in year two.
On certification, the relevant North American mark is ETL or another nationally recognised testing laboratory (NRTL) listing; CE and RoHS address the European market and hazardous-substance compliance, respectively. Confirm that the listing covers the specific model and voltage configuration you are installing, because inspectors check the nameplate against the listing. SLTMAKS states that its product line carries ETL, CE, and RoHS certification, along with a 3-year comprehensive warranty, and builds its fixtures around Samsung diodes with full-spectrum output across 380–780 nm (SLTMAKS). Those are the kinds of first-party claims you should verify against the certificate and the photometric report supplied with the quote, not accept from a web page.
Spectrum stability over time and across dimming levels is the under-examined criterion. Ask for spectral data at more than one drive current, and for a statement of how the manufacturer maintains spectrum as diodes age and as the fixture dims. A fixture whose red-to-blue ratio shifts materially at 40% dimming is a different light from the one in the specification sheet, and your CO2 and DLI setpoints were built around the specified spectrum.
Canopy Mapping and PPFD Uniformity
A single PPFD number for a fixture is close to meaningless for a commercial room. What determines consistency of growth is the distribution across the canopy, including edges, aisles, and the shadow patterns cast by structural members, irrigation lines, HVAC equipment, and the plants themselves.
Build the layout from a fixture count derived from your target DLI, then verify it with a model-specific simulation and, after commissioning, with a measured grid. The layout planning guidance is explicit that every number should be treated as an input with a source rather than a universal recipe, and that the canopy must be rechecked after any commissioning change (layout planning guidance).
Measure on a grid fine enough to catch the pattern, not just the average: a 0.6 m grid across a representative bay is a reasonable starting density for a commercial room. Record the minimum as well as the mean, because the lowest-lit plants set the batch. Then compare the measured map against the simulated one; a material discrepancy usually points to a mounting height, tilt, or obstruction issue that no amount of dimming will fix.
Uniformity interacts with enrichment. If part of the canopy receives 30% less light, that zone draws less CO2 and grows differently, and the room-average CO2 reading hides it. Zoned control, or at minimum zoned measurement, keeps the enrichment decision tied to what the crop is actually experiencing.
Far-Red and Morphology Control
Far-red (roughly 700–780 nm) is not a major driver of photosynthesis in the way red and blue are, but it is a powerful morphogenic signal. The phytochrome system reads the balance of red to far-red light, and that balance shapes stem extension, leaf angle, and canopy architecture — Long et al. (2006) describe shading being sensed through exactly this red/far-red balance. In a dense canopy, adding far-red can trigger shade-avoidance responses: longer internodes, more upright leaves, a canopy that intercepts light differently.
Whether that is desirable depends on your crop and trellis system. In a vertical farm with tight tier spacing, stem extension is a cost. In a vining crop where light penetration to lower leaves matters, a modest morphological adjustment may improve the distribution of light through the canopy. The practical approach is to treat far-red as a separate control variable with its own trial, not as a fixed component of a “full spectrum” claim. Ask for the far-red content of the spectrum at canopy level, and test one or two far-red levels against a control before committing a whole room.
One further caution: the interaction between far-red, high PPFD and elevated CO2 is not well characterised for most commercial cultivars. The three variables together can produce morphological responses that none produce alone. That is an argument for measuring, not for assuming.
Conclusion
Operating Envelopes and Next Steps
The deliverable from this evaluation is not a single setpoint but an operating envelope: a defined range of PPFD, DLI, CO2 concentration, temperature and VPD within which the crop performs predictably and the safety systems remain in control. Define the envelope from your own trial data, then write the control logic to keep the room inside it.
A workable sequence for the next 90 days:
- Baseline audit. Measure current PPFD uniformity, DLI, CO2 concentration at canopy and floor level across a full photoperiod, and record HVAC runtime and energy consumption.
- Design review. Size enrichment capacity against the drawdown your target PPFD will create; confirm the interlock architecture and sensor placement against the AHJ’s requirements.
- Commissioning verification. Prove each interlock by test, not by inspection: trip the sensor, confirm the solenoid closes, the alarm sounds, the exhaust runs and the system does not restart without a reset.
- Controlled trial. Run the ROI trial described below before scaling to the full facility.
Safety and Documentation Checklist
- CO2 supply permit or registration confirmed with the local AHJ; permit duration and renewal date recorded.
- Sensor locations on as-built drawings, with mounting heights and coverage per zone.
- Solenoid location(s) shown, with fail-closed behaviour verified under power loss.
- Alarm setpoint documented and matched to the applicable exposure limit; note that OSHA’s permissible exposure limit (PEL) for CO2 is 5,000 ppm as an 8-hour time-weighted average, while NIOSH’s short-term exposure limit is 30,000 ppm and the immediately dangerous to life or health (IDLH) value is 40,000 ppm (OSHA annotated PELs). Different limits serve different purposes; the alarm setpoint should be set with the AHJ, not assumed.
- Signage at room entry and at cylinder or dewar storage, meeting local size and wording requirements.
- Exhaust capacity and intake locations documented; make-up air confirmed by mechanical permit where required.
- Manufacturer data sheets on file for cylinders, restraints, piping, vaporisers, sensors, solenoids, exhaust fans and signage.
- Calibration schedule for every CO2 sensor, with records.
- Emergency procedure posted, covering alarm response, evacuation, and re-entry only after ventilation.
- Worker training records for anyone who enters the enriched space.
ROI Trial Design and Metrics
Design the trial to answer one question: does the paired intervention pay back at this facility, at this crop, within a defined period? That requires a control, a treatment, and enough replication to separate the effect from noise.
Design. Use paired zones within the same room where possible, so that temperature, VPD and outside conditions are shared. If the room cannot be split, run a before-and-after design with a full crop cycle of baseline data on each side of the change. Randomise which zone gets the treatment if you can; at minimum, document why you could not.
Treatments. At least three arms are worth the effort: ambient CO2 with existing light; enriched CO2 with existing light; enriched CO2 with the new LED PPFD. That design isolates the interaction, which is the whole point of the article. A two-arm design (old room versus new room) confounds light, CO2, and season.
Metrics to record, per zone, per cycle:
- Yield: harvested fresh and dry weight per square metre, graded by quality class.
- Inputs: kWh consumed by lighting and by HVAC separately; kg of CO2 delivered (from cylinder weights or flow totaliser).
- Environment: logged PPFD, DLI, CO2 at canopy and floor, temperature, VPD, and the proportion of photoperiod hours inside the target envelope.
- Crop response: time to harvest, node count, internode length, leaf area index at defined intervals.
- Cost: energy, gas, labour, and any incremental maintenance, converted to cost per unit of harvested dry matter.
Duration. One cycle gives a direction; two to three cycles across different seasons give a defensible payback estimate. Record the outside conditions for each cycle, because a summer cycle and a winter cycle will not produce the same HVAC load.
Decision rule. Set the threshold before the trial starts. A common formulation is that the incremental annual margin from yield and quality must exceed the annualised capex plus incremental energy and gas cost within a defined payback period. Write the number down first; it is much harder to argue with a threshold chosen before the data arrive.
Finally, keep the safety documentation and the trial data in the same file. When the AHJ inspects, or when the finance committee reviews the next facility, both will be asked for — and the credibility of the yield claim depends on the rigour of the room it was measured in.
FAQ
What CO2 level should I run with high-PPFD LEDs?
Target 1,000–1,200 ppm during the photoperiod, then confirm against your own crop trial. Above roughly 1,200 ppm, the photosynthetic gain flattens out, so you spend more gas for less return. Seedlings and lettuce usually need less.
Can I add CO2 without upgrading my lights?
You can, but expect a smaller gain. Extra CO2 only pays back when light is no longer the limiting factor — at low PPFD the canopy is already near light saturation, so the gas gets underused. Pair enrichment with roughly 700–900 µmol m⁻² s⁻¹ or more, depending on species.
What safety equipment is required for CO2 enrichment?
At minimum: NDIR sensors at canopy and floor level, a fail-closed solenoid, an alarm at the 5,000 ppm OSHA PEL, mechanical exhaust with a low intake, and a manual reset so enrichment can’t restart on its own. Check your local fire authority’s permit requirements — some jurisdictions also restrict unvented CO2 generators.