Introduction
For an orchid grown at temperate latitudes, the light environment is, from the crop’s point of view, permanently wrong. The genera that dominate commercial production — Phalaenopsis, Cattleya, Dendrobium, Oncidium, Cymbidium, Vanda — evolved under equatorial or near-equatorial light regimes where day length barely moves across the year, and daily photon dose is comparatively stable.
A greenhouse at 45°N delivers the opposite: a photoperiod that swings from roughly 9½ hours to just over 16 hours, and a winter photon budget that can fall to a fraction of the summer figure. No glazing specification closes that gap on its own. The lighting system must restore both the daily photon dose and the seasonal stability the crop was selected for.
That makes commercial orchid lighting a specification and commissioning discipline rather than a fixture purchase. The order of work matters: establish what the target environment actually is in measurable terms, convert any legacy foot-candle guidance into units a control system can use, zone genera by light demand, size supplemental output against the real transmission losses of the structure, account for CAM physiology where it applies, specify spectrum, efficacy and dimming, integrate the added heat load with HVAC and vapor pressure deficit (VPD) control, and then verify the installed system against the design.
This guide works through that sequence. It draws on American Orchid Society (AOS) cultural guidance, university extension and horticultural-engineering publications, the Resource Innovation Institute’s CEA lighting best-practices guide, DesignLights Consortium (DLC) technical requirements, and published research on Phalaenopsis photosynthesis. Where a source describes practice rather than a verified outcome, the text says so.
What “Tropical Light” Actually Means for an Orchid Crop
Before any fixture is specified, the design target needs a definition that survives an audit. “Tropical light” is not a brightness level; it is a pattern of daylength and accumulated photon dose.
Daylength. The AOS notes that in equatorial regions the photoperiod changes less than 30 or 40 minutes from winter to summer. At 30°N the natural photoperiod runs from about 11 hours in late December to 14.5 hours in late June; at 45°N it varies from 9½ hours to just over 16 hours. Those figures are measured from when plants first perceive light before sunrise to when they stop perceiving it after sunset, roughly 30 to 40 minutes longer than sunrise-to-sunset. A commercial range in the northern United States therefore experiences a seasonal daylength swing of six and a half hours that its crop never evolved under.
Waveband. Photosynthesis uses light between 400 and 700 nm — blue (400–500 nm), green (500–600 nm) and red (600–700 nm). The AOS notes that approximately half of the energy arriving from the sun falls within this photosynthetic waveband; the remainder is shorter (ultraviolet) or longer (infrared).
Intensity versus dose. Instantaneous intensity is measured as photosynthetic photon flux density (PPFD) in µmol·m⁻²·s⁻¹. Accumulated dose is the daily light integral (DLI) in mol·m⁻²·d⁻¹. The bucket analogy used in extension literature is the clearest way to hold the distinction: PPFD is how hard the rain is falling right now; DLI is how much water is in the bucket at the end of the day. A short, heavy storm and a long drizzle can fill the same bucket.
Mimicking the tropics, therefore, means stabilizing daily photon dose and daylength across the calendar year — not replicating noon equatorial intensity. A greenhouse that hits a tropical PPFD at midday in June and delivers a third of the dose in December has not reproduced a tropical environment; it has reproduced a temperate one with a bright summer.
Converting Foot-Candle Guidance into PPFD and DLI Targets
Much of the orchid literature a grower inherits is written in foot-candles, a photometric unit describing light as the human eye sees it. It is not a plant unit, and it cannot be converted to PPFD without knowing which lamp produced the light.
Apogee Instruments publishes the calibration factors for the common sources. Multiply foot-candles by the factor to obtain PPFD in µmol·m⁻²·s⁻¹:
| Light source | Foot-candles → PPFD factor |
|---|---|
| Sunlight | 0.200 |
| Cool white fluorescent | 0.146 |
| Mogul-base high pressure sodium (HPS) | 0.131 |
| Metal halide | 0.152 |
| Ceramic metal halide (CMH, 4200 K) | 0.167 |
The spread between 0.131 and 0.200 is large enough to change a design. A reading of 1,500 foot-candles becomes 300 µmol·m⁻²·s⁻¹ under sunlight but only about 197 µmol·m⁻²·s⁻¹ under HPS. A foot-candle figure quoted without its source is not a specification.
Worked conversion. Take the AOS-suggested maximum of 1,500 foot-candles for Phalaenopsis and Paphiopedilum, and assume the figure was recorded under sunlight: 1,500 × 0.200 = 300 µmol·m⁻²·s⁻¹. Convert that to a daily dose by multiplying by the number of seconds the level is held and dividing by 10⁶. Held for 12 hours (43,200 seconds): 300 × 43,200 ÷ 1,000,000 = 12.96 mol·m⁻²·d⁻¹.
That result should immediately look wrong for a low-light orchid, and it is — not because the arithmetic fails but because the premise does. First Rays makes the point directly: the foot-candle values in the AOS culture guides were the peak, noontime intensities the plants should receive, not a constant value, and treating them as a continuous setpoint overstates the dose. A plant that sees 300 µmol·m⁻²·s⁻¹ at noon and a small fraction of that for the rest of the day accumulates far less than 13 mol.
The practical rule follows: build targets from genus DLI ranges first, then convert foot-candle notes only to sanity-check legacy guidance against the new numbers. If a converted figure implies a dose several times the genus range, the conversion has been applied to a peak value as though it were a constant.
Zoning Orchid Genera by Light Demand
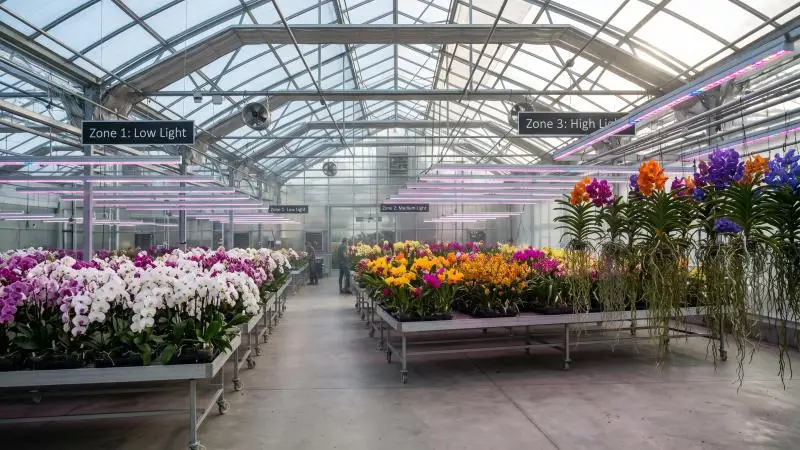
A commercial range lit uniformly will over-light the low-demand genera and under-light the high-demand ones. The fix is compartmentalization, and the first input is a defensible grouping.
Typical daily light integral (DLI) ranges by genus, as published by First Rays. Bars show the full published range for each genus, not a single recommended setpoint; ranges overlap between adjacent light categories, so zone boundaries should be set from the crop plan rather than from category labels alone.
Two published sources are useful here, and they measure different things. The AOS lists suggested maximum light intensities in foot-candles: 1,500 for Phalaenopsis and Paphiopedilum; 2,500 for Miltoniopsis and Zygopetalum; 3,000 for Cattleya; and 5,000 for Brassia, Cymbidium, Degarmoara, Dendrobium and Oncidium. First Rays publishes typical DLI ranges by genus. These are not competing figures — one is a peak intensity ceiling, the other an accumulated daily dose — and they should not be read as contradictory.
| Genus | Typical DLI (mol·m⁻²·d⁻¹) | Light category |
|---|---|---|
| Phalaenopsis | 4–8 | Low |
| Paphiopedilum | 4–8 | Low |
| Masdevallia | 4–7 | Low |
| Miltoniopsis | 6–9 | Low–medium |
| Oncidium (most) | 8–14 | Medium |
| Zygopetalum | 8–12 | Medium |
| Cattleya | 12–18 | Medium–high |
| Dendrobium (nobile types) | 14–20 | Medium–high |
| Cymbidium | 16–24 | High |
| Vanda | 18–30 | Very high |
| Ascocenda | 20–30 | Very high |
A workable four-zone layout for a mixed range:
- Low-light compartment: Phalaenopsis, Paphiopedilum, Masdevallia. Target the lower half of the 4–8 mol band and treat 8 mol as a ceiling rather than a goal.
- Medium compartment: Miltoniopsis, Oncidium, Zygopetalum. Roughly 8–12 mol, with Miltoniopsis held toward the bottom of the band.
- High compartment: Cattleya, Dendrobium. Roughly 12–20 mol, depending on type.
- Very-high compartment: Vanda, Ascocenda, Cymbidium. 16–30 mol.
Light demand is not the only separator. Temperature and humidity requirements can force further subdivision even where two genera share a light band — Masdevallia and Phalaenopsis sit in the same low-light range but do not share a temperature regime, and a cool-house genus placed in a warm compartment to simplify lighting will lose more than the lighting design gains. Zone on light first, then check whether the resulting groups are climatically compatible.
The AOS also advises lower light intensities soon after transplanting and where root systems are poor. Build that into the operating schedule as a dimmed post-transplant setting rather than asking staff to remember it.
Sizing Supplemental PPFD Against Glazing and Screen Losses
The gap between outdoor sunlight and the canopy is larger than most operators assume, and it is the number that determines supplemental capacity.
University of Wisconsin extension figures put greenhouse light transmission typically in the range of 35 to 75%. Covering type alone accounts for a wide spread — around 90% transmission for single glass versus 76% for double poly, before structural losses. Dusty glazing can reduce light by up to 20%, and the structure itself can easily reduce light by 15%. The Resource Innovation Institute (RII) guide adds that transmission through poly and glass coverings can decline by 30–50% over time as coverings age, and offers a reasonable rule of thumb: assume 50% overall light loss averaged over a typical year.
The RII worked example. A facility receives 30 mol·m⁻²·d⁻¹ of sunlight in March; the covering has 66% visible light transmittance, so 20 mol reach the crop. If the target is 35 mol, supplemental lighting must supply 16 mol·m⁻²·d⁻¹.
Converting a supplemental DLI into fixture output. Divide the required supplemental dose by the lighting hours, then convert to a per-second rate. For 16 mol over 16 lighting hours: 16 ÷ (16 × 3,600) × 1,000,000 = 278 µmol·m⁻²·s⁻¹ average over the lit period. Spread the same 16 mol over 12 hours and the required average rises to about 370 µmol·m⁻²·s⁻¹. Lighting hours and required intensity trade directly against each other; neither can be specified alone.
For context, the Wisconsin source describes conventional HPS and metal halide supplemental lighting for greenhouse crops at 40–80 µmol·m⁻²·s⁻¹ for 6–12 hours. That is a historical benchmark for high-light floriculture crops, not a prescription for orchids, and it is an order of magnitude below what a winter orchid deficit can require.
Compute month by month. The Wisconsin source shows Ohio’s greenhouse-bench DLI, at 50% transmission, averaging around 6 mol·d⁻¹ from November to January and above 26 mol·d⁻¹ in mid-summer. The same source notes that supplemental HPS would add only about 10% more light during June to August, while the potential impact on growth is greatest from November through January. A single annual average conceals the only month that matters. Run the deficit calculation for each month at the design latitude, size the system to the worst month the crop plan requires, and let dimming handle the rest of the year.
Why DLI Alone Misleads for Phalaenopsis
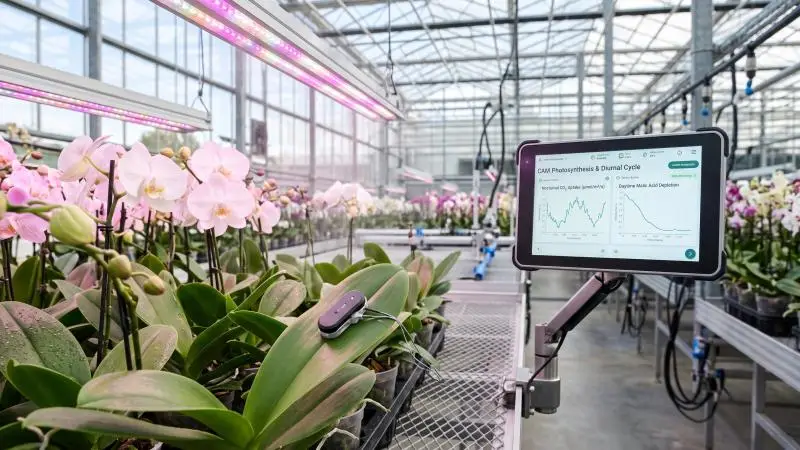
For Phalaenopsis — the highest-volume commercial orchid in most markets — a DLI target is necessary but not sufficient. The genus uses crassulacean acid metabolism (CAM): it takes up CO₂ mainly at night and stores it as malic acid for use during the following day. As those reserves deplete, the crop becomes less able to use additional light productively. Light delivered after the usable window is energy spent for no photosynthetic return.
A 2025 study in Scientific Reports on Phalaenopsis “Mantefon” quantified several of these effects. Short-term exposure to 200 µmol·m⁻²·s⁻¹ raised electron transport rate (ETR) directly, but a midday reduction in ETR followed, likely from malic acid depletion. Nocturnal CO₂ uptake under 200 µmol·m⁻²·s⁻¹ was not significantly increased compared with the 100 µmol·m⁻²·s⁻¹ treatment. In the longer acclimation trials, plants grown at 50 µmol·m⁻²·s⁻¹ showed photosynthetic performance comparable to those at 100 µmol·m⁻²·s⁻¹, including similar vegetative growth rates. The study’s light treatments used a blue:green:red:far-red LED ratio of 1:1.8:1.8:0.3.
Those findings do not mean Phalaenopsis should be grown at 50 µmol·m⁻²·s⁻¹. They mean the relationship between added light and added photosynthesis is not linear, and that a design which assumes every additional photon is converted into growth will overbuild.
Grower practice is moving in the same direction. In a case study published by Gardin, JMP Flowers reports using plant-response sensors alongside PPFD, temperature, LED, CO₂ and screen data to judge when the crop is using available light efficiently. On 27 and 28 September, photosynthetic efficiency held relatively high toward the end of the day and supplemental lighting was extended beyond sunset; on 29 September, efficiency declined sharply at 16:30, consistent with malate depletion, and no additional supplemental lighting was provided that evening.
The grower attributes improvements in growth rate and plant quality to decisions informed by that data. These are grower-reported observations from a commercial site, not independently verified yield results, and they should be read as a description of a control strategy rather than proof of an outcome.
The control implication is concrete: for CAM orchids, the variable to manage is the timing and duration of light relative to the plant’s usable window, not a single daily total. A zone controller that extends the photoperiod to close a DLI deficit may be adding light the crop cannot use.
Specifying Spectrum and Dimming for a New LED Installation
Spectrum. Longer-term whole-plant studies summarized by Nelson and Bugbee indicate that light quality has a much smaller effect on plant growth rate than light quantity. The fraction of blue light does matter, but mainly for morphology — cell expansion rate, leaf expansion rate, plant height and plant shape — with only a small direct effect on photosynthesis. For flowering orchids, the AOS advises striving for a spectrum that mimics sunlight’s color for optimal blooming results. A broad, sunlight-like spectrum is therefore a defensible default; highly tuned narrow-band recipes are a refinement to test, not a prerequisite.
Fixture photon efficacy as measured by Nelson and Bugbee (2014) across 22 fixtures. These are 2014 test values, not current market performance: commercial LED efficacy has risen since, so current products should be compared on separately sourced, dated LM-79 reports rather than plotted against this axis.
Efficacy. The DLC Horticultural Lighting Technical Requirements V4.0 set a minimum photosynthetic photon efficacy (PPE) of 2.5 µmol·J⁻¹ for listing on the Horticultural Qualified Products List (QPL), with an absolute tolerance of −5% in testing — meaning a report showing 2.38 µmol·J⁻¹ or higher is accepted, and anything below is disqualified.
Testing of flux, luminous intensity, and electrical characteristics must be conducted at laboratories accredited to ISO 17025, and applicants must submit ANSI/IES TM-33 XML documents representing the fixture’s spatial and spectral distribution, with spectral power distribution at 5 nm resolution or finer across 400–800 nm. For a procurement specification, the practical requirement is simple: performance claims should rest on third-party LM-79 reports from an accredited lab, not on a catalog headline.
Dimming. DLC V4.0 includes controllability requirements covering dimming capability, dimming range, and control methods, and the QPL records the control type per product. Zone-level dimming is worth specifying for three reasons: it allows light levels to be tailored as plants grow or as crops rotate between compartments, it smooths spikes in HVAC operation, and it enables a dim-and-trim approach in which output is adjusted incrementally to find the point of adequate productivity at minimum energy.
The RII guide notes that breaking rooms into zones and dimming with LEDs is relatively inexpensive as a share of total system cost, and that dimming controls should be wired at installation — retrofitting them later is substantially more expensive.
Shadow. Every fixture blocks some sunlight, and the shadow is proportional to the size of the fixture. Nelson and Bugbee note that for the same photon output, 400 W HPS, CMH, fluorescent and LED fixtures block significantly more sunlight than 1000 W HPS fixtures, and that longer, narrower LED fixtures may be preferable to rectangular ones because the duration of the shadow is shorter. Mounting along greenhouse support structures is a design option that can provide light without extra shading. In a greenhouse where winter transmission is already the binding constraint, fixture geometry deserves as much attention as fixture efficacy.
Where a project involves deployment logistics — delivery lead times, warehouse proximity, certification documentation for an authority having jurisdiction (AHJ) — those are legitimate evaluation criteria alongside the photometric ones. SLTMAKS, for example, stocks finished fixtures in New York, California, Oklahoma, Canada, and Germany, and publishes ETL, CE, and RoHS certification for its product line; that kind of supply and documentation profile belongs in the vendor comparison, not in the lighting calculation.
Integrating LED Load with HVAC and VPD Management
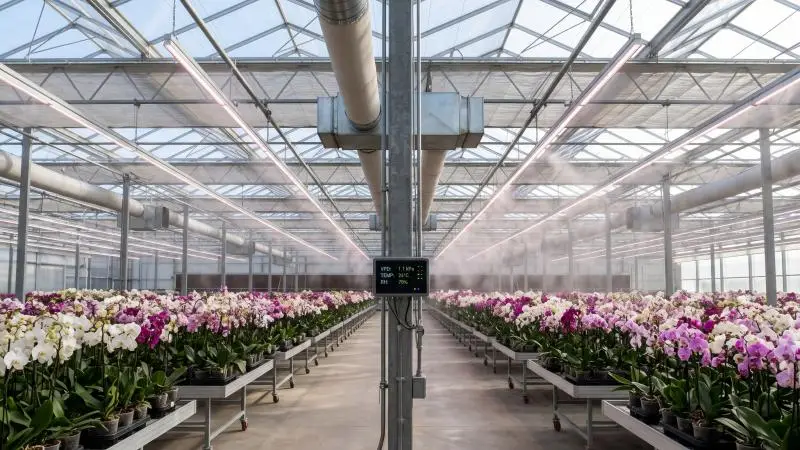
Adding lighting adds heat. LED fixtures convert most of their input power to heat that must be removed from the growing environment, and the control problem is not confined to the fixtures.
The RII guide reports that, to maintain leaf temperature and VPD, growers should increase temperature setpoints by 7–8 °F when switching from HID to LED, to make up for the difference in fixture heat output. That figure is a recommended starting adjustment, not a universal requirement; the correct setpoint change depends on the installed wattage, the house’s heat loss and the crop’s VPD target.
A countervailing point comes from Nelson and Bugbee: the best HPS and LED fixtures have nearly identical efficiency, so cooling loads are similar for both fixture categories at comparable photon output. The heat does not disappear when the fixture type changes; it moves. They also note that LED fixtures can be rapidly cycled — an operation that prematurely ages other fixture types — and that this could be used to stabilize heating and cooling loads during partly cloudy days, improving temperature control and extending the life of cooling equipment.
Lighting also interacts with the other climate variables. The Wisconsin source reports that supplemental CO₂ increased the effectiveness of lighting in cutting production, and that temperature is usually raised a few degrees Fahrenheit to maximize the photosynthesis rate when supplemental lighting is added. Screens cut both sunlight and supplemental light, and their position changes the heat balance; a screen schedule set for summer shading will suppress winter supplemental light unless it is re-sequenced seasonally.
The practical recommendation is to treat lighting, VPD, and CO₂ as one control problem rather than three. A lighting schedule that ignores VPD will produce a crop transpiring outside its target range; a CO₂ strategy that ignores lighting will enrich an atmosphere over a crop that cannot use it. Commission the controls together and test them together, as the RII guide’s integrated commissioning advice suggests.
Commissioning: PPFD Mapping, Uniformity, Sensor Calibration, DLI Verification
A lighting design that is not measured after installation is a claim, not a system. Commissioning converts the specification into a verifiable handover.
Before installation: the lighting plan and PPFD map. Request a manufacturer or independent lighting plan that includes a PPFD map. The RII guide reproduces an example layout reporting average room PPFD, median plant-area PPFD, the percentage of cells within 10% and within 5% intensity bands, and power density in W/ft². Review light levels at all areas of the benches, including edges, and check spill light on walkways. Decide explicitly whether higher uniformity — which can require more fixtures — is worth the capital and operating cost for your crop, or whether a lower-uniformity layout that still meets the canopy target is acceptable.
Functional tests. The RII guide lists tests recommended by its Lighting Working Group members: fixtures provide expected light levels at full power, shut off completely, dim all the way up and down, and hold output stable without flickering. Commissioning agents should test equipment only when all systems are on site, powered, started up, and configured, with site visits on several days at different points in construction, and tests performed both before and after plants are in the room. Final reports should include average PPE and PPFD for each cultivation space, and should confirm fixtures are running at the temperature forecast in design. Expect measurement uncertainty in the range of ±5–10%.
Ongoing verification. The RII guide recommends taking handheld PPFD readings every 3–6 months to recalibrate control responses to the equipment’s latest field performance, and cleaning the faces of LED fixtures on the same schedule as HID reflectors. Readings should be taken in an evenly spaced grid at canopy height, not directly beneath a single fixture, and should be repeated at the time of year when DLI is lowest.
DLI verification. The final step closes the loop on the design. Log PPFD at canopy height across a representative day in each zone, integrate the readings to obtain the delivered daily dose, and compare against the design target for that zone and month. If the delivered dose falls short, the cause is usually one of four things: transmission lower than assumed, fixture output below rated, a dimming or control setting that is not doing what the schedule says, or a photoperiod shorter than the design assumed. Each is diagnosable from the same log.
FAQ
Can I use my existing foot-candle meter to set orchid lighting?
Not directly. A foot-candle meter measures photometric illuminance — light as the human eye responds to it — not photosynthetically active radiation. Converting a reading to PPFD requires a source-specific factor: 0.200 for sunlight, 0.146 for cool white fluorescent, 0.131 for mogul-base HPS, 0.152 for metal halide, 0.167 for CMH. Because the factor varies by roughly 50% across those sources, a reading taken under an unknown or mixed source cannot be converted reliably. Use a calibrated quantum sensor for any setpoint that will be programmed into a controller.
Which orchids can share one lighting zone?
Using the DLI ranges above, Phalaenopsis and Paphiopedilum share the low-light band at 4–8 mol·m⁻²·d⁻¹, and Masdevallia sits close behind at 4–7. Miltoniopsis, Oncidium and Zygopetalum group in the medium band around 8–12. Cattleya and Dendrobium share a medium–high band, and Vanda, Ascocenda and Cymbidium form the very-high group. Light compatibility is necessary but not sufficient: genera that match on light may still need separation for temperature or humidity, so confirm the climate regime before merging compartments.
How much supplemental light does a winter orchid crop need?
It depends on latitude, glazing, screen use, and the genus target, and it should be computed month by month rather than annually. The method: take outdoor DLI for the month, multiply by the covering’s transmittance, subtract the result from the genus target, and the remainder is the supplemental dose. The RII guide’s 50% overall loss rule is a reasonable starting assumption until measured transmission is available. As an illustration of scale, a 35 mol target against 20 mol delivered leaves 16 mol·m⁻²·d⁻¹ to supply — about 278 µmol·m⁻²·s⁻¹ averaged over 16 lighting hours.
Is a higher DLI always better for Phalaenopsis?
No. CAM reserve depletion limits how much additional light the crop can use. The 2025 Scientific Reports study found that nocturnal CO₂ uptake at 200 µmol·m⁻²·s⁻¹ was not significantly increased compared with 100 µmol·m⁻²·s⁻¹, and that plants acclimated to 50 µmol·m⁻²·s⁻¹ performed comparably to those at 100. A DLI target remains a useful design anchor, but the timing and duration of light relative to the plant’s usable window matter as much as the total.
What PPE should I require in a fixture specification?
At minimum, 2.5 µmol·J⁻¹ for DLC Horticultural QPL eligibility under V4.0, verified by LM-79 testing at an ISO 17025-accredited laboratory, with TM-33 spatial and spectral reporting. The DLC applies a −5% tolerance in testing, so a report showing 2.38 µmol·J⁻¹ or above is accepted. Specify the verified figure rather than a nominal one, and require the test report as a submittal.
Do LED fixtures remove the need to adjust greenhouse temperature?
No. The RII guide, citing its Lighting Working Group, recommends raising temperature setpoints by 7–8 °F to maintain leaf temperature and VPD when replacing HID with LED, and the Wisconsin source notes temperature is usually raised a few degrees when supplemental lighting is added. Lighting should be managed jointly with CO₂, screens, and VPD control, not as an independent system.
Conclusion
Commercial orchid lighting succeeds when the design starts from genus DLI targets and seasonal deficit arithmetic rather than from a fixture catalog. The chain runs in one direction: convert legacy foot-candle guidance carefully, and only to check it; zone genera by light demand and then by climate compatibility; size supplemental output against measured or realistically assumed transmission losses, month by month; control CAM crops by their usable window rather than by a daily total alone; specify verified efficacy, accredited test reports and zone-level dimming; integrate the added heat load with VPD, CO₂ and screen management; and commission the installed system with a PPFD map, functional tests and periodic recalibration.
Each step produces a number that the next step depends on. Skipping the transmission calculation overbuilds or underbuilds the fixtures. Skipping the CAM consideration extends the photoperiod into hours the crop cannot use. Skipping commissioning leaves the whole chain unverified.
The direction of practice is toward plant-response sensing layered on top of fixed DLI targets — the JMP Flowers case study describes exactly that shift, using photosynthetic efficiency data to decide whether to extend lighting on a given evening. That approach supplements the design arithmetic; it does not replace it. A grower cannot interpret a plant-response signal without a target to compare it against.
Before specifying fixtures for an orchid range, commission a lighting plan and PPFD map for each zone. The map is the document that turns a lighting strategy into something an installer can build and an operator can verify.