Introduction
Commercial indoor cultivation runs on numbers: setpoints, uniformity targets, energy budgets, and commissioning reports. For lighting, the operational workhorse is PPFD (photosynthetic photon flux density): the photon density (µmol/m²/s) reaching a surface within the traditional PAR band. In practice, you’ll also see broader-band terms such as PBAR/ePAR (extended definitions that include wavelengths beyond 400–700 nm) and Yield Photon Flux, a spectrum-weighted metric derived from the classic McCree photosynthetic action spectrum.
These metrics matter because large facilities don’t choose “LED” in the abstract—they choose a spectrum and a deployment (layout, dimming policy, control integration) that has to survive procurement scrutiny and produce repeatable outcomes.
The decision goal in this article is straightforward: keep using PPFD for operational control and verification, but use YPF to complement PPFD when you’re comparing spectra and building a more honest ROI model.
Scope-wise, we’ll stay practical: a snapshot of standards and guidance, what the biology supports (and what it doesn’t), how to measure and commission in a way that stands up to audit, and how to think about ROI sensitivity—especially when spectra differ.
Table of Contents
Core Definitions
PPFD and PPF
PPF (photosynthetic photon flux) is the total photon output from a fixture in the PAR band (traditionally 400–700 nm), measured in µmol/s. PPFD is the density of those photons arriving at a plane (typically the canopy), measured in µmol/m²/s.
The critical distinction is that PPF is a fixture property (how much PAR it emits), while PPFD is an installation property (how that output lands on your crop after optics, mounting height, spacing, reflections, and obstructions). A quick refresher on PAR terms is available in Photosynthetically active radiation.
PBAR/ePAR and Far-Red
PBAR and “ePAR” are industry terms used to describe extended wavelength accounting beyond classic PAR. The exact ranges vary by document and vendor, which is why you should treat them as “ask for the definition” terms rather than assuming everyone means the same thing.
Far-red is typically discussed separately because it sits just beyond the classic PAR band, yet can meaningfully affect plant morphology and interactions with red light. Standards and programs often handle far-red as its own band (commonly 700–800 nm) rather than quietly blending it into a single number.
YPF and YPFD (McCree-Weighted)
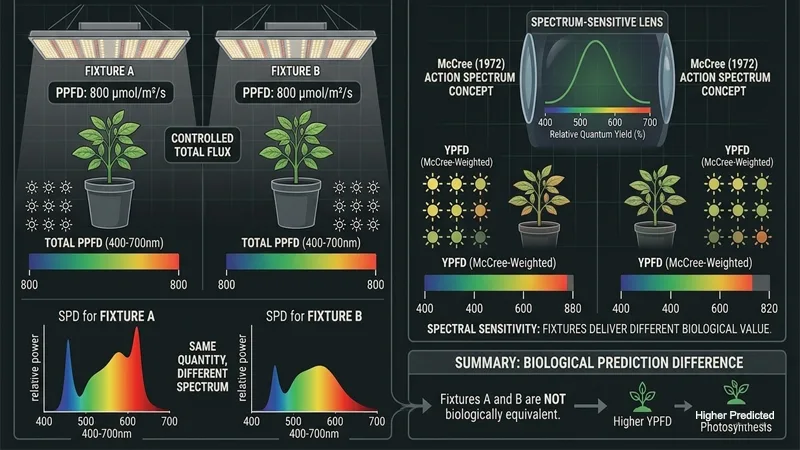
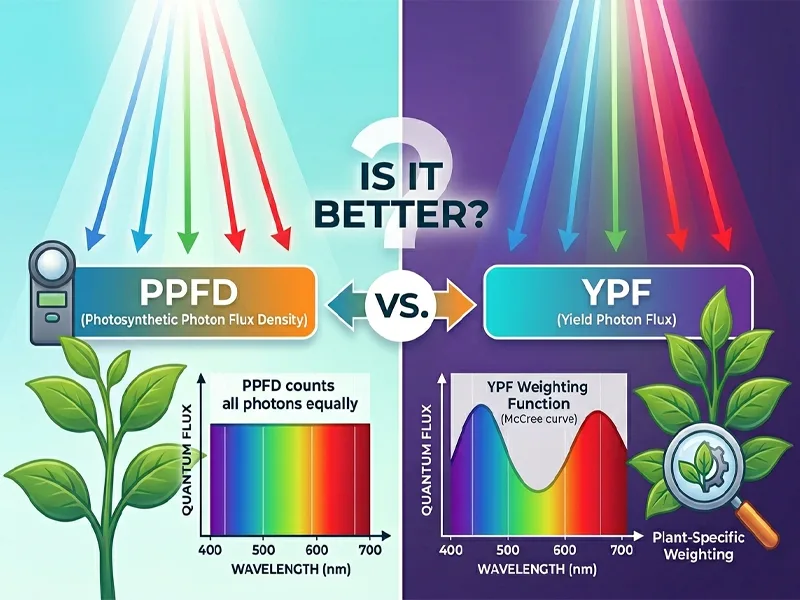
YPF (yield photon flux) is a photon-flux metric that weights photons by their relative photosynthetic usefulness rather than counting every photon equally. YPFD is the area density form (analogous to PPFD): weighted photons arriving per unit area.
The weighting is typically tied to the McCree (1972) action spectrum concept—often described as “McCree-weighted.” Practically, this means two fixtures can deliver the same PPFD at the canopy, but their predicted photosynthetic effectiveness may differ if their SPDs are different.
Key Takeaway: PPFD is your control dial. YPF/YPFD is a spectrum-sensitive lens for comparing “equal PPFD” setups that may not be biologically equivalent.
Standards and Guidance
ASABE and CIE Positions
In the U.S., industry vocabulary and units are commonly aligned to ASABE-style definitions for photon-based plant metrics (PPF/PPFD), with separate accounting for bands outside 400–700 nm. Internationally, the CIE has worked to harmonize horticultural lighting terminology; the most durable value for operators is consistency in definitions, units, and what is—and isn’t—being counted.
If you need a reference point for terminology harmonization, see ILV Supplement 2: Terms and definitions for horticultural lighting (CIE).
The practical implication: PPFD remains the shared operational language, while “extended” terms (PBAR/ePAR) and spectrum-weighted metrics (YPF/YPFD) require explicit definitions and traceable spectral data.
DLC Requirements and Listings
If you’re buying at scale, DLC listings matter because they force a baseline of test reporting. DLC’s horticultural requirements are PPF-centric and emphasize documented spectral and intensity distribution data rather than installation-specific PPFD claims.
Two key documents operators and procurement teams cite are:
At a high level, DLC listings commonly include fixture-level photon output (e.g., PPF), efficacy (e.g., PPE, in µmol/J), and spectral reporting artifacts. They generally do not solve your room-specific PPFD or uniformity by themselves—that comes from photometric distribution plus layout modeling and commissioning.
Implications for Labeling and Compliance
For commercial facilities, “metric debates” become real when they hit labeling, submittals, and commissioning packets. A few practical rules reduce risk:
- Demand explicit ranges and units. If a datasheet says “ePAR,” confirm the wavelength range and whether it’s photons (µmol/s) or energy (W).
- Keep PPFD in the commissioning scope. Inspectors and internal QA want a canopy-level map tied to sensor calibration and methodology.
- Treat spectrum-weighted metrics as derived values. If a vendor claims YPF/YPFD, require the underlying SPD so your team (or third-party) can reproduce the computation.
Evidence and Biology
McCree Curve and Relative Quantum Yield
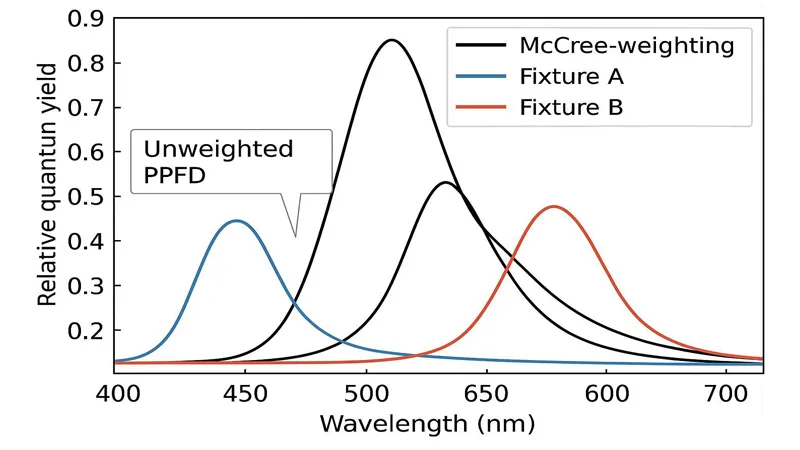
The intuition behind YPF is simple: plants don’t respond equally to every wavelength in the visible band. The McCree action spectrum captures relative photosynthetic effectiveness versus wavelength, which is why “McCree-weighted” metrics exist in the first place.
This does not mean you can ignore everything else (canopy structure, cultivar response, photomorphology, temperature). It means that when you compare two different SPDs at the same PPFD, you should expect different biological outcomes often enough that “PPFD alone” can be an incomplete decision input.
YPF Correlation to Biomass vs PPFD
In practice, YPF/YPFD tends to be most helpful as a comparison tool:
- If two fixtures have similar SPDs, PPFD comparisons are usually directionally reliable.
- If spectra differ materially (blue-heavy vs red-heavy, different phosphor blends, different red peaks), YPF provides a more biologically informed weighting than a flat 400–700 photon count.
Importantly, correlation is not a guarantee. Your crop, your morphology targets, and your climate strategy can all shift what “best” means. Use YPF to improve the first-pass model, then validate with a pilot and controlled measurement.
Far-Red Synergy and Canopy Effects
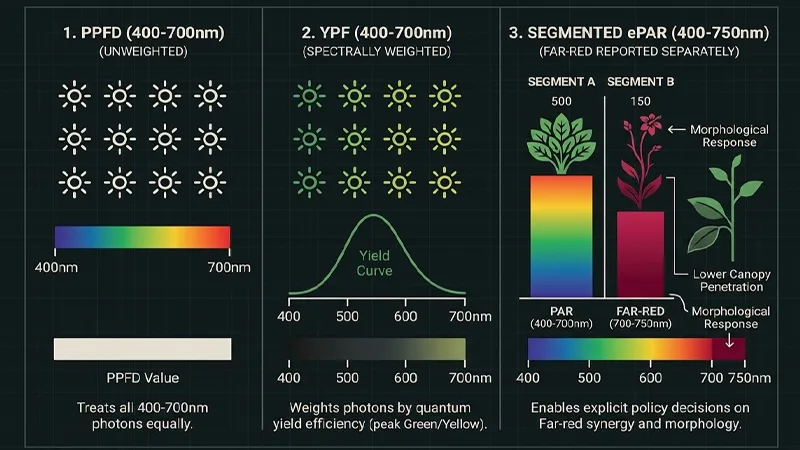
Far-red complicates any single-number comparison because it can drive effects that look like yield changes but originate in morphology and canopy light penetration rather than leaf-level quantum efficiency.
This is why many programs treat far-red as a separately reported band: you can decide policy (include, limit, schedule) explicitly instead of hiding it inside a headline metric.
Measurement and Commissioning
Instruments and Data (Quantum Sensors, Spectroradiometers)
To use PPFD and YPF responsibly, separate what you measure from what you compute.
- Quantum sensors are the workhorse for PPFD mapping. They’re fast and practical, but can have spectral mismatch error when spectra differ.
- Spectroradiometers capture the SPD (spectral power distribution) needed to compute spectrum-weighted metrics (like YPF/YPFD) and to document spectral content (including far-red).
For large grows, this is less about buying fancy instruments and more about having a repeatable procedure with calibration traceability.
Workflow: Map PPFD, Compute YPF from SPD
A practical workflow that survives audit looks like this:
- Map PPFD across the target plane(s) at the relevant dimming level(s).
- Capture SPD at representative points and operating conditions.
- Compute YPF/YPFD from the SPD using the chosen weighting definition (and record that definition in the report).
- Interpret results in context: equal-PPFD comparisons, spectrum deltas, and any far-red policy assumptions.
When teams skip the “record the definition” step, YPF becomes a marketing number instead of an engineering number.
QA: Calibration, Spectral Mismatch, Documentation
If you’re standardizing across rooms or sites, QA is the differentiator.
- Calibration: Record sensor calibration dates and the calibration standard.
- Spectral mismatch: When you change the spectrum, assume quantum-sensor error changes too; document how you handled it.
- Documentation: Archive raw files (SPD exports, grid maps), not just summary PDFs.
A brief vendor example (non-promotional): a supplier like SLTMAKS can support a commissioning packet that includes a PPFD grid map, the fixture SPD used for calculations, the derived YPF/YPFD method statement, and a report archive format your facilities team can reuse across sites.
⚠️ Warning: If a vendor can’t provide SPD data (or can’t explain the weighting used), treat any YPF claim as non-verifiable until you can reproduce it.
ROI and Decision Framework
Modeling YPF per Joule to Grams per kWh
ROI modeling is where YPF can be useful—but only if you keep the chain of assumptions visible.
A common path is:
- Start with electrical input power (W) and operating hours (h).
- Convert to photon output per watt (e.g., PPF per J, often expressed as µmol/J for PAR).
- Use SPD-based weighting to estimate effective photons (YPF/YPFD concept).
- Translate “effective photons” to expected biomass using your own facility’s conversion factors (grams per kWh), ideally from a pilot under controlled conditions.
The key is not pretending YPF directly equals grams. It’s using YPF to reduce error when two candidate spectra produce the same PPFD but not the same photosynthetic effectiveness.
Comparing Spectra at equal PPFD vs Equal Power
Two comparison modes show up in procurement:
- Equal PPFD comparison: You hold canopy PPFD constant and compare spectra. This is where YPF can reveal that “same PPFD” doesn’t necessarily mean “same effective photosynthesis.”
- Equal power comparison: You hold watts constant and compare delivered PPFD and spectrum. This tends to be closer to how facilities teams think about load, HVAC interplay, and electrical infrastructure.
Your best decision work usually requires both views:
- Equal PPFD answers, “If I run the crop at the same setpoint, what changes?”
- Equal power answers, “If my infrastructure is capped, what can I actually deliver?”
Deployment Playbook: Setpoints, Dimming, Far-Red Policy
A deployment playbook that’s easy to standardize across sites typically includes:
- Setpoints: Define PPFD targets by zone and growth stage, then define allowed variance (uniformity expectation).
- Dimming policy: Specify how you handle ramping, setpoint adherence, and sensor placement (especially in vertical racks).
- Far-red policy: Decide whether far-red is (a) not used, (b) used on a schedule, or (c) used continuously—and document the band definition (often 700–800 nm) and measurement method.
This is where YPF fits cleanly: it informs spectrum selection and ROI sensitivity, while PPFD remains the operational control metric your team can map, verify, and enforce.
Conclusion
PPFD remains the operational standard because it’s practical, measurable, and universally understood in commissioning. But PPFD alone can flatten important spectral differences that matter when you’re comparing fixtures, recipes, or retrofit options.
Treat YPF/YPFD as a refinement tool: use it to compare spectra more honestly, to pressure-test ROI assumptions, and to separate “same PPFD” from “same biological effectiveness.”
Far-red deserves deliberate policy rather than a hidden number. Align to standards where possible, define wavelength bands explicitly, and verify any derived metric with traceable spectral data.
If you’re standardizing across rooms or sites, the most useful next step is procedural: create (or update) a commissioning template that requires PPFD maps, SPD exports, the exact YPF weighting definition used, and an archive of raw measurement files.
FAQ
What is the YPF metric, and how does it differ from traditional PPFD?
PPFD (Photosynthetic Photon Flux Density) measures the total density of photons arriving at a surface within the traditional PAR band (400–700 nm), counting every photon equally regardless of its wavelength.
YPF (Yield Photon Flux), along with its area-density form YPFD, is a spectrum-weighted metric. It applies a weighting factor (typically based on the 1972 McCree action spectrum) to photons based on their actual relative photosynthetic usefulness to the plant.
Key Difference: PPFD tells you the raw quantity of light hitting the canopy, while YPF gives you a lens into the biological effectiveness of that light based on its specific spectrum.
In commercial cultivation, should I use PPFD or YPF for daily operations?
You should keep using PPFD as your primary operational control dial and use YPF as a complementary tool. PPFD remains the industry’s shared operational language because it is practical, universally understood, and easily mapped with standard quantum sensors during commissioning. However, because PPFD flattens spectral differences, you should use YPF when comparing different spectra or building more honest ROI models for fixture procurement.
Why shouldn’t buyers accept YPF or ePAR claims blindly from lighting vendors?
Because without explicit definitions and raw data, these metrics can easily become “marketing numbers” rather than engineering numbers. For example, far-red light (700–800 nm) can heavily influence crop biomass through morphology and canopy penetration, and some metrics might quietly blend it into a single headline number. To mitigate risk, you should always demand explicit wavelength ranges and require the underlying SPD (Spectral Power Distribution) data, so your team or a third party can verify and reproduce the YPF computations.
What is the recommended measurement and commissioning workflow that can survive an audit?
A reliable, repeatable commercial workflow consists of three steps:
Map PPFD: Measure and map PPFD across the target canopy planes at relevant dimming levels using quantum sensors.
Capture SPD: Use a calibrated spectroradiometer to capture the spectral power distribution at representative points.
Compute YPF/YPFD: Derive the YPF/YPFD values mathematically from the captured SPD using your chosen weighting definition, and archive the raw files alongside sensor calibration dates.
How can YPF be utilized to improve ROI modeling during procurement?
YPF helps reduce errors when comparing different fixture candidates by looking at two scenarios:
Equal PPFD Comparison: If you hold the canopy PPFD constant, YPF helps you evaluate which spectrum delivers better photosynthetic effectiveness, preventing the assumption that “same PPFD equals same biological outcome.”
Equal Power Comparison: If your electrical infrastructure is capped, you hold watts constant and use YPF to analyze which fixture provides the highest estimated biomass conversion (grams per kWh) under those infrastructure limits.