Introduction
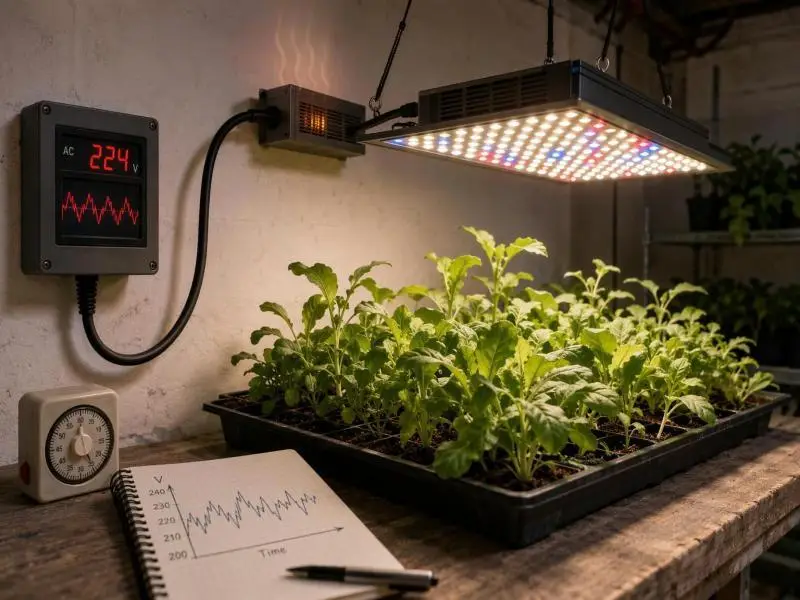
When a grow light misbehaves during a power event, the instinct is to blame the diodes. The evidence points elsewhere. The LED array is a current-driven device with no moving parts and no direct connection to the mains; between the grid and the diodes sits the driver, a switched-mode power supply that rectifies, filters, corrects power factor, and regulates current. Whenever an input voltage fluctuation LED disturbance occurs, the facility experiences it at that driver first, and what the driver does with it determines whether the array sees a ripple, a flicker, a reset, or nothing at all.
That reframing matters commercially. A fixture can carry a wide input range on its datasheet, pass a safety listing, and still lose output or age prematurely in a building where fast sags and transients are routine — because a nominal range describes compatibility with grid voltages, not immunity to disturbances.
The sections below work through the mechanism, the effect on photon output and on driver life, a measurement workflow for characterizing your own site, a decision framework for conditioning versus replacement, and the specification items worth checking before the next purchase. Where the available evidence is thin — notably on spectral shifts — this article says so rather than filling the gap.
Table of Contents
The Driver: Managing Input Voltage Fluctuation LED Impacts
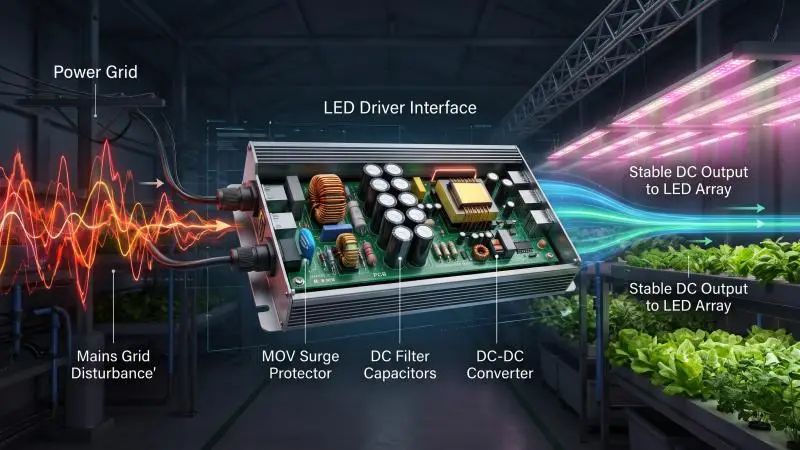
A useful mental model is the driver as a shock absorber and translator. The road (mains) is noisy; the instrument (the LED array) is precise and unforgiving. The shock absorber’s job is to absorb the noise and deliver a clean, stable current. When the noise exceeds what the absorber can handle, the instrument feels it.
The NIH Office of Research Facilities technical bulletin on electrical disturbances and LED drivers lays out the stages inside a programmable driver:
AC input and line fuse, a metal oxide varistor (MOV) for surge clamping, an electromagnetic interference (EMI) filter, a bridge rectifier converting AC to DC, a DC filter stage using capacitors to smooth ripple, a power factor correction (PFC) stage that aligns input current with input voltage and reduces current harmonic distortion, and a programmable DC-to-DC converter that regulates voltage and current to the array. Feedback from the array returns to that converter, and user controls such as dimming and spectral tuning feed into it as well.
The bulletin’s central premise is the one to carry forward: LED brightness is primarily determined by the current flowing through the driver, and a slight variation in voltage can cause a larger change in current, producing a noticeable difference in brightness. The driver’s regulation loop — not the diode’s tolerance for voltage — decides whether a mains event becomes a visible output change.
Why Current, Not Voltage, Governs the LED
An LED’s light output is a function of forward current, and its forward voltage changes only modestly across a wide current range. That is why practical LED systems are driven by constant-current supplies rather than constant-voltage ones: the driver sets the current, and the array’s voltage follows.
Within its operating window, the DC-to-DC stage holds that current steady even as the incoming AC voltage moves. Outside the window — a deep sag, an extended undervoltage, a fast transient that gets past the input filter — regulation degrades and the array sees a current excursion. How far outside the window a given event falls, and how quickly the loop recovers, are properties of the specific driver design. The sources describe the mechanism; they do not publish regulation thresholds or response times that could be applied across products, so treat any specific number as something to obtain from the driver manufacturer.
Where the Disturbance Enters: Sag, Swell, Transient, and Chronic Deviation
Operators encounter four broad families of disturbances, and they behave differently at the driver.
Sags and swells. A sag is a decrease and a swell an increase in RMS voltage lasting milliseconds to a few seconds; longer events are classified as undervoltages or overvoltages. PG&E’s guide to commercial power disturbances lists major equipment start-up or shutdown, short circuits, and undersized electrical circuits among the causes, with effects on sensitive equipment ranging from dim or bright lights to equipment shutdown. The National Power Laboratory study summary referenced below notes that a sag longer than three cycles is often visible in a reduction of light output.
Transients. These are sub-cycle events — the DOE motor systems sourcebook glossary describes transients as changes in the steady-state condition of voltage or current, and notes voltages as high as 10 kV observed in the 0.3–3.0 MHz range where little or no protection was provided. They can be caused by lightning, faults, or switching operations such as opening a disconnect.
Chronic deviation. A sustained low or high voltage is a steady-state condition rather than an event, and it is judged against a different reference. ANSI C84.1 establishes Range A and Range B for service and utilization voltage; as PG&E’s voltage tolerance summary explains, utilization equipment is expected to perform satisfactorily throughout Range A, while Range B covers voltages outside those limits that result from practical design and operating conditions and should be limited in extent, frequency, and duration.
How routine sags can be is illustrated by the National Power Laboratory study summarized in this power quality reference: across 1,057 site-months of monitoring at 112 North American locations, sags averaged 27.9 per month with an average amplitude of 99.3 Vrms and a median duration of 0.26 s. That is a dataset from one monitoring program, not a universal site profile — but it makes the point that a fixture can meet a nominal-voltage specification and still live in a facility where sags are ordinary events.
What Voltage Fluctuation Actually Does to Efficacy
Efficacy is not one number, and treating it as one is where most voltage arguments go wrong. Fixture-level photosynthetic photon efficacy (PPE, in µmol/J) is a ratio: photosynthetic photon flux divided by input power. A disturbance can move the numerator, the denominator, or both — and they can move in ways that partly cancel, which is why a single efficiency figure taken during an event can mislead.
The DLC Horticultural Lighting Technical Requirements V4.0 is the clearest public anchor for how efficacy is defined and tested. It sets a PPE threshold of at least 2.5 µmol/J, with an absolute tolerance of −5%, meaning test reports showing 2.38 µmol/J or higher are accepted, and anything below is disqualified — evaluated at any point in the product’s specified operating voltage range.
That last clause is the useful part for this discussion: it establishes that qualifying products are characterized across their reported input voltage range. It does not tell an operator how a specific fast sag or transient will affect output at their site, because the requirement is a characterization and listing threshold, not a disturbance-immunity test.
PPF, PPFD, and PPE: What Each Metric Can and Cannot Tell You
Define the three on first use, because they answer different questions.
- Photosynthetic photon flux (PPF), in µmol/s, is the total photon flux the fixture emits in the 400–700 nm range. It is the fixture’s output.
- Photosynthetic photon flux density (PPFD), in µmol/m²/s, is that flux delivered per unit area at the canopy. It depends on PPF, mounting height, coverage pattern, and uniformity.
- Photosynthetic photon efficacy (PPE), in µmol/J, is PPF divided by input power. It is the conversion efficiency of the fixture.
A voltage event that reduces driver output lowers PPF, and therefore lowers PPFD at fixed geometry. Whether PPE falls depends on whether input power falls proportionally. If output drops 10% and input power drops 10%, PPE is unchanged, and the fixture is simply delivering less light at proportionally less power. If output drops while input power holds or rises — plausible when a driver is operating outside its efficient regulation window — PPE falls. And because PPFD also moves with mounting height and coverage, a PPFD reading alone cannot isolate a voltage cause. The discipline is to ask which number moved before blaming the grid.
The Spectral Question: What Is Known and What Is Assumed
The available sources do not establish whether spectral output shifts under voltage fluctuation. That should be stated plainly rather than resolved by assertion in either direction.
The reasoning that makes a shift plausible is straightforward: if the driver’s current regulation degrades and the array is driven at a different current, diode behavior can change.
But the magnitude, the direction, and even the presence of any spectral effect under realistic disturbances are not documented in the material reviewed here. For crops where spectrum matters to quality outcomes, the honest recommendation is to treat spectral stability under disturbance as something to verify with your own measurements — a spectroradiometer reading taken during a logged event, compared against a baseline — rather than to assume stability or instability. This is a limit of the evidence, not a finding.
How Voltage Fluctuation Shortens Lifespan
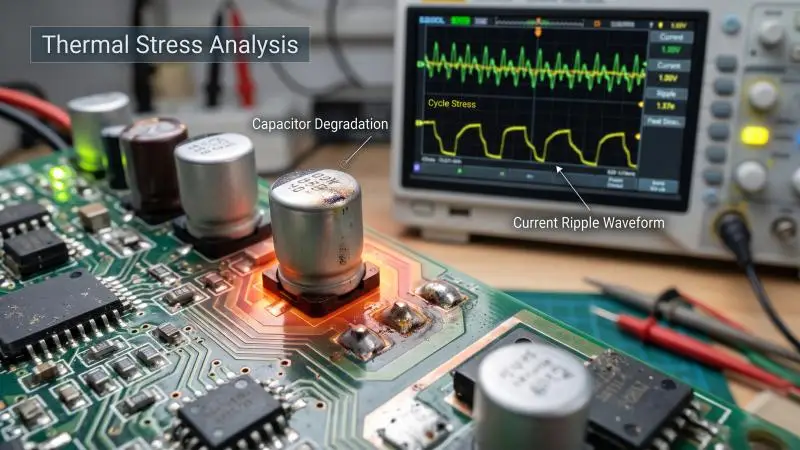
The Rensselaer Polytechnic Institute Lighting Research Center study on output capacitor aging states that LED system life is mostly determined by failures in solder joints and driver components, and that past studies have reported the electrolytic capacitor as one of the main failure components in LED outdoor light fixtures.
The degradation mechanism is well characterized. Electrolytic capacitors degrade through evaporation of electrolyte; capacitance falls and equivalent series resistance (ESR) rises. In a driver, that shows up as growing output current ripple — a parametric failure that precedes catastrophic failure. The driver does not stop working; it starts delivering dirtier current, which is why flicker and instability are early warning signs rather than cosmetic annoyances.
The RPI experiments provide scoped evidence on what cycling does. In one experiment, capacitors held at a 150°C time-average temperature failed (defined as a 200% change in output current ripple) at 1300 ± 52 h under thermal cycling, versus 2866 ± 66 h under continuous operation. In a second experiment at a 170°C average ON temperature, the comparison ran 603 ± 39 h continuous versus 859 h cycled.
These are accelerated-test results at elevated temperatures on 330 µF aluminum electrolytic capacitors, not field lifetime predictions for a grow light. What they establish is that cycling conditions change time to parametric failure, and that the peak temperature and ON duration within the cycle — not just the average — drive the outcome.
Thermal Stress, Ripple, and the Capacitor As the Weak Link
The RPI work notes that capacitor time to failure falls exponentially at higher temperatures, and that under thermal cycling the degradation above the average temperature is much greater than the benefit below it, because of the logarithmic relationship between temperature and lifetime. That is why both the maximum temperature of the cycling profile and the ON time determine overall time to failure.
Connecting this to voltage fluctuation requires care. A disturbance that causes the driver to work harder, or that interrupts and restarts it, adds cycling stress. The sources support the cycling-and-temperature mechanism directly, and they support the disturbance-to-driver-stress link at the level of the NIH bulletin’s statement that long periods of voltage variation can negatively affect the functionality and reliability of LED drivers.
They do not quantify a specific ripple increase per sag. The defensible position is that repeated disturbance-driven stress cycles are a plausible accelerant of a documented failure mode, not that each event costs a calculable number of hours.
What the NIH Bulletin and DOE Material Actually Claim About Failure
Attribution matters here, because the general statements are easy to over-read.
The NIH bulletin states that electrical disturbances such as voltage variations can significantly impact LED drivers and lighting systems, leading to flickering, premature failure, and reduced lifespan, with effects ranging from minor annoyance to costly operational disruption. It also notes that excessive voltage fluctuations can generate heat and potentially damage a component’s insulation, and that frequent voltage issues accelerate wear and tear, leading to more frequent repairs and replacements.
The PG&E guide describes effects on sensitive equipment generally — memory loss, data errors, dim or bright lights, shrinking display screens, equipment shutdown — and recommends voltage regulators, power conditioners, uninterruptible power supplies, and motor generators as possible solutions.
Neither source provides fixture-specific failure rates, and neither should be read as doing so. The evidence supports “disturbances stress drivers and can shorten life.” It does not support “each sag costs X hours.”
Diagnosing Your Site: A Measurement Workflow
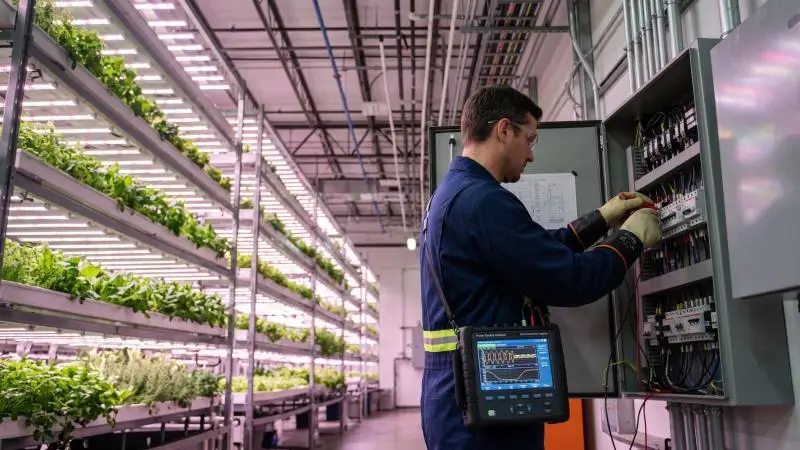
Before buying conditioning equipment, characterize the disturbance at the point of utilization rather than at the service entrance. PG&E’s guidance is explicit that a power quality survey should be initiated before any major electrical changes or power conditioning equipment purchases, and that many common problems can be resolved from the basic investigation.
Step 1 — Log At the Panel and at the Fixture
Two measurement points answer two different questions.
At the panel, a power disturbance analyzer captures sags, swells, transients, undervoltage and overvoltage, and harmonic distortion, with event timestamps and waveforms. PG&E describes analyzers that monitor voltage and current continuously and provide a detailed record when measurements fall outside pre-set limits, with some reports showing tabular summaries and others displaying the voltage waveform at the time of the disturbance. The devices can be rented, leased, or purchased.
At the fixture, measure input voltage and — where the driver or a monitoring port allows — output current or a proxy for light output. The comparison is what locates the cause: a disturbance visible at both points originates upstream, while one visible only at the fixture points to something in the branch circuit or the fixture itself.
Step 2 — Choose Instruments and Logging Duration
The instrument tier determines what you can conclude. Event indicators sit at the low end: they show that a sag or swell occurred, sometimes storing worst-case amplitudes or event counts, but most do not record time of occurrence or duration.
Textual monitors add duration and time of occurrence, and some allow correlation of environmental parameters and system status levels to help determine the cause. Graphical monitors provide the most information, typically a cycle-by-cycle picture plus minimum and maximum values, duration, and time of occurrence; three-phase voltage graphs alongside neutral-to-ground voltage and phase, neutral, and ground currents usually give enough to determine whether a fault was upstream or downstream.
Duration matters as much as instrument choice. In the NPL dataset, the median sag lasted 0.26 s against a 2.1 s average — a gap produced by a small number of long events. A short logging window will miss exactly the long-duration events that are most likely to disturb a driver. Log long enough to capture recurrence, and correlate the log with facility activity: large load switching, generator transfer, irrigation pump starts. PG&E’s disturbance log prompts ask precisely these questions — whether equipment was added or changed, whether the problem occurs regularly, what else was happening at the time.
One caution from the same source: the monitor itself must be able to ride through the sag and survive extended swells, and its functionality should be evaluated before field deployment. As the reference puts it, just because it didn’t record it does not mean it didn’t happen.
Step 3 — Read the Results Against a Reference
Two references apply to two different questions.
For steady-state voltage, use ANSI C84.1 Range A and Range B. Range A is the band within which utilization equipment is expected to perform satisfactorily; Range B covers excursions outside those limits that practical operation produces, limited in extent, frequency, and duration, with corrective measures expected within a reasonable time.
For short-duration events, use the ITIC (Information Technology Industry Council) curve, successor to the original CBEMA curve. PG&E’s summary explains that the curve shows an envelope of voltage tolerances representative of power-conscious equipment manufacturers, and that some power quality monitors now overlay the CBEMA/ITIC mask as a frame of reference when reviewing recorded events. It also notes a limitation worth remembering: there are no general equipment susceptibility standards for momentary voltage variations. The curve is a reference envelope, not a certification of any particular fixture.
A fixture operating inside Range A steady-state can still be exposed to sags that fall outside its ride-through capability. That combination — compliant steady-state voltage, non-compliant transient behavior — is the common failure pattern.
Finally, suspect the building. The NPL study found that 50% or more of recorded low/high RMS events were caused by load equipment in the same building. A problem is indicated when events recur, when they coincide with visible output changes or driver resets, or when measured severity exceeds the fixture’s declared immunity.
Deciding What to Do: Conditioning, UPS, Regulator, or Driver Replacement
Match the intervention to the disturbance type, severity, and recurrence — not to the loudest vendor recommendation. The options differ substantially in what they actually address.
Match the Remedy to the Disturbance
Fast transients and surges. Surge protective devices (SPDs) are the relevant category. IEC 61643-11:2025 specifies requirements and test methods for SPDs connected to AC low-voltage power systems rated up to 1,000 V RMS at 50/60 Hz, covering devices intended to limit surge voltages and divert surge currents. Note the scope: the standard covers the device, not the fixture’s survival. An SPD at the panel reduces what reaches the driver; it does not make the driver immune.
Sustained sags and swells. PG&E recommends voltage regulators, power conditioners, and UPS. The power quality reference lists in-facility options with their response characteristics: ferroresonant transformers, magnetically controlled voltage regulators (3–10 cycle response), electronic tap-switching transformers (1–3 cycles), shielded isolation transformers, static transfer switches (within 4 milliseconds), static UPS, and rotary UPS.
Each has trade-offs. PG&E notes that voltage regulators respond best to slow changes in voltage and may provide limited or no protection from fast voltage changes depending on response time — which is why a regulator sized for chronic undervoltage is not automatically the right answer for fast sags.
Chronic undervoltage from long feeder runs or shared large loads. The fix may be wiring and load distribution rather than conditioning. PG&E’s practical-solutions sequence puts preventive maintenance, equipment application, and electrical rewiring ahead of power conditioning, and specifically flags switching high-current loads or loads on very lengthy building circuits as causes of voltage sags.
A driver without adequate ride-through. Replacement with a driver specified for the site’s measured envelope is the direct fix, and often the cheapest one when the disturbance is confined to the fixture’s own circuit.
Driver Replacement Versus Added Conditioning
A defensible rule splits on where the disturbance lives and what it affects.
Condition when the disturbance is external, intermittent, and affects multiple loads. In that case, the conditioning protects more than the lights — it protects controls, sensors, and irrigation equipment on the same supply — and the capital cost is amortized across several systems.
Replace the driver or fixture when the disturbance is within the fixture’s own circuit, when the existing driver’s declared input range and protection features are inadequate for the measured envelope, or when the driver is already showing parametric degradation: rising output ripple, flicker, resets. A driver in that condition is aging, not merely reacting, and conditioning will not restore it.
The NIH bulletin’s best-practice framing supports the specification side of this: select the correct LED driver for the voltage and wattage requirements, and keep a short distance between the driver and the lighting fixture.
The cost trade-off is real and should be stated plainly. Conditioning adds capital, floor space, and conversion losses. Replacement adds downtime and disposal. Apply the framework per circuit rather than facility-wide by default — a facility with one problematic motor circuit and clean power everywhere else does not need plant-wide conditioning.
Procurement: What to Check on the Datasheet
A wide input range on a datasheet is a statement about nominal compatibility across grids, not a guarantee of ride-through or disturbance immunity. Read it as the first item on a longer list, not the answer.
Input Range, Protection Features, and Power Quality
Four items are worth checking on any commercial fixture.
Declared input voltage range. Confirm it covers the site’s nominal voltage and the measured extremes from your log, not just the nameplate. A range that brackets the nominal but not the observed sag depth tells you the fixture is compatible, not resilient.
Built-in protection against fluctuations. The NIH bulletin names this as a selection criterion — high-quality drivers with built-in protection against fluctuations. Ask what protection, against what, and to what level.
Power factor. DLC V4.0 requires a measured power factor of at least 0.90 at any reported input voltage at full output or a non-dimmed state.
Total harmonic current distortion (THDi). DLC V4.0 requires THDi no greater than 20% under the same conditions — any reported input voltage, full output.
Those last two are more informative than they first appear, because of how DLC requires them to be demonstrated. For products with driver variations, including input voltage variations, electrical testing of each product must be performed to sufficiently characterize the power quality of each driver at its applicable nominal input voltages and maximum designed output power. In other words, a qualifying product has been characterized across its range rather than labeled at one point. That is a useful signal — the product was tested, not just specified.
Safety Certification and What It Does Not Cover
UL 8800 is the horticultural-specific safety standard, published in August 2019 and covering equipment for both the United States and Canada. UL’s summary of the standard describes what it addresses:
wiring and connection methods for luminaires that are frequently raised, lowered, or repositioned; a requirement that horticultural luminaires carry either a damp or wet environmental rating, with provisions for testing at increased ambient temperatures; ingress protection (IP) testing against solid objects and water; photobiological safety consistent with IEC 62471, with detailed precautions regarding eye and skin exposure; UV exposure of polymeric materials; and a Part 2 set of requirements for prefabricated horticultural systems. The 2020 edition of the National Electrical Code added Part XVI to Article 410, requiring horticultural lighting equipment to be listed.
State plainly what this does not establish. UL 8800 certification is a safety listing, not a performance or disturbance-immunity rating. It does not tell the operator how the fixture will behave during a sag, and a UL 8800 mark should not be read as evidence of ride-through capability.
For disturbance immunity, the relevant reference is IEC 61000-4-11, which defines immunity test methods and preferred test levels for voltage dips, short interruptions, and voltage variations for equipment with rated input current not exceeding 16 A per phase on 50 Hz or 60 Hz networks. The standard specifies test levels of 0%, 40%, 70%, and 80% of the rated test voltage, with preferred durations by class.
Two practical notes: the standard’s scope is limited to equipment at or below 16 A per phase, so large commercial fixtures may fall outside it; and it notes that voltage fluctuation immunity tests are covered separately by IEC 61000-4-14. Ask whether the driver was tested to IEC 61000-4-11, at which class and levels, and get the answer in writing.
Facility-Side Versus Grid-Side Causes
Locate the source before spending money. The NPL finding that 50% or more of recorded low/high RMS events originated with load equipment in the same building is the single most commercially useful fact in this discussion, because in-facility causes are within the operator’s control.
Inside the Fence: Shared Loads, Generator Transfer, Long Feeders
Three mechanisms dominate.
Large inductive loads. Motors draw inrush current at startup, producing sags that last until the current demand falls or a protective device clears the fault. The power quality reference notes that in-plant sags from large motor starting are typically longer than 30 cycles and not as deep as utility-fault sags. In a cultivation facility, the relevant loads are irrigation pumps, chillers, compressors, dehumidifiers, and any large motor-driven HVAC.
Generator transfer. Transfer between utility and standby generation introduces its own interruption and re-close sequence. If the facility tests generators under load, the test schedule is a predictable source of events that will appear in any log.
Long feeder runs. Conductor impedance adds voltage drop, so the same upstream event produces a deeper sag at a distant fixture than at the panel. Undersized circuits compound this; PG&E lists undersized electrical circuits among the causes of sags and swells.
The deployment measures follow directly: redistribute large loads away from lighting circuits, separate lighting circuits from motor circuits, size feeders for voltage drop rather than ampacity alone, and consider a dedicated circuit or conditioner for critical lighting zones such as propagation rooms or mother-stock areas where an outage has disproportionate cost.
Beyond the Meter: What the Utility Contributes and What You Can Do
Utility-side causes are real and largely outside the operator’s control. Faults on transmission and distribution systems cause sags that propagate widely — the power quality reference cites sags to 90% experienced up to 700 miles from the fault and sags to 75% up to 300 miles. Momentary interruptions occur when utility protective equipment recloses to clear a fault; the reference notes that reclosers may reclose into the fault after roughly 1–10 seconds depending on the scheme, and that parallel feeders can experience as many as four voltage sags in succession.
The operator cannot fix these. What the operator can do is specify ride-through capability at procurement, add conditioning at the point of use for critical circuits, and document events for the utility. That last item has practical value: a timestamped log with waveforms is what a utility commercial representative needs to investigate a service-quality complaint.
The split is clean. In-facility causes are usually addressable by the operator through load separation, feeder sizing, and circuit design. Grid-side causes are usually addressable only by specification and conditioning.
Caveats and Open Questions
The strongest evidence in the material reviewed here concerns temperature and power cycling of driver capacitors under accelerated test conditions. It does not include field-measured voltage-fluctuation-to-lifespan curves. The RPI results are accelerated tests at 150°C and 170°C on individual capacitors; they establish a mechanism and a direction, not a service-life formula for a fixture in a grow room.
The effect is context-dependent. Facilities with clean power and well-specified drivers may see no measurable effect from voltage fluctuation, and the conventional view that a wide input range is sufficient may hold in those sites. The framework in this article is a way to find out which kind of site you operate, not a claim that every site has a problem.
The weakest part is the spectral question. The available sources do not establish whether spectral output shifts under voltage fluctuation, and any claim of spectral stability or instability under disturbance should be treated as unverified until measured on the specific fixture.
The mechanism is well supported, the magnitude is site-specific, and the diagnostic workflow is how an operator replaces assumption with their own data.
Conclusion
Input voltage fluctuation reaches the LED through the driver, so its effects on efficacy and lifespan are driver effects. That single reframing changes what to measure, what to buy, and what to ask a supplier.
The practical consequences are manageable. Characterize the disturbance at the panel and at the fixture before purchasing anything. Match the remedy to the disturbance — surge protection for transients, conditioning for external multi-load sags, wiring and load distribution for chronic undervoltage, driver replacement for inadequate ride-through or a driver already showing parametric degradation. And apply the fix per circuit rather than facility-wide by default.
The procurement implication is a shift in how fixtures get evaluated. Efficacy figures and safety listings answer questions about performance and safety; they do not answer questions about disturbance immunity. Ask for the third category of evidence alongside the other two: whether the driver was tested to IEC 61000-4-11 and at what levels, what protection is built in, and how the product was characterized across its input range.
Start with a two-week log at the panel and at a representative fixture. That data determines every subsequent decision — whether to condition, replace, rewire, or do nothing.
FAQ
But doesn’t a wide input range (e.g., 100–480 V) mean the fixture is immune to voltage fluctuation?
No. A wide input range describes nominal compatibility across different grid voltages — it tells you the fixture will operate on 120 V, 277 V, 347 V, or 480 V service. It says nothing about how the driver behaves during a fast sag, a transient, or an extended undervoltage. Those behaviors are set by the driver’s regulation loop and protection features. Read the datasheet range alongside any declared immunity testing, such as IEC 61000-4-11, and alongside the protection features the manufacturer lists.
What if I’ve already invested in fixtures that flicker or reset during disturbances?
Diagnose before replacing. Log at the panel and at the fixture to establish whether the cause is upstream or in-facility, then apply the decision framework: conditioning for external, multi-load disturbances; driver or fixture replacement for inadequate ride-through or already-degraded drivers. Note that flicker and resets can be parametric degradation signals — the driver aging, not just reacting — in which case conditioning will not restore performance and replacement is the direct fix.
How do you respond to the view that power quality is the utility’s problem, not the grower’s?
The data does not support that view as a general rule. In the NPL study, 50% or more of recorded low/high RMS events were caused by load equipment in the same building. In-facility causes are within the operator’s control through load separation, feeder sizing, and circuit design — and they are often the cheaper fixes. Utility-side events are real, but they are addressed by specification and point-of-use conditioning rather than by waiting for the utility to act.
Does voltage fluctuation change the spectrum my plants receive?
The available sources do not establish this either way. A spectral shift is plausible if driver current regulation degrades and the array is driven at a different current, but the magnitude, direction, and even presence of any effect under realistic disturbances are undocumented in the material reviewed here. If spectrum stability matters for your crop, verify it with your own spectral measurements taken during logged events rather than assuming stability or instability.
Is PPF or PPE the right metric for judging a disturbance’s effect?
Neither alone. PPF captures the change in total output; PPE captures the output-to-input-power ratio; PPFD at the canopy adds geometry. A disturbance can move PPF and input power together, leaving PPE unchanged while the crop receives less light. Track PPF (or a light-output proxy) and input power together during logging, and treat PPE as a specification and procurement metric rather than a real-time diagnostic.