Introduction
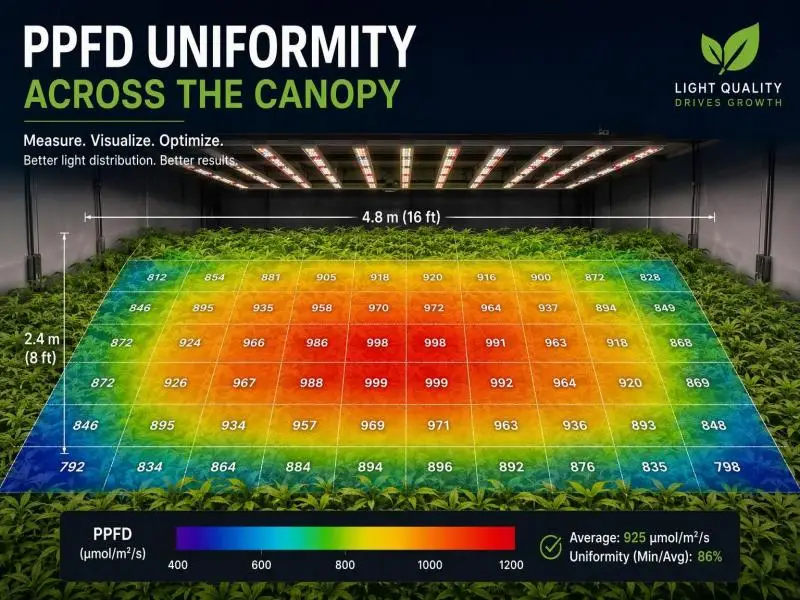
A grow room can hit its average PPFD target on paper and still produce an uneven crop. The average describes the whole canopy; it does not describe what any single plant receives. When the brightest zone runs 25% above the dimmest, the plants under each are living in different light environments, and they will finish at different times, at different weights, and with different quality grades. For a commercial operation, that variation shows up as harvest spread, sorting labor, and energy spent lighting positions that cannot use the photons.
Achieving precise grow light uniformity is the metric that closes this gap. In practice, commercial teams express it two ways: as a coefficient of variation (CV%) of the PPFD readings across the canopy, and as a ratio of the minimum reading to the average (Min/Avg). Both describe the same physical condition from different angles, and both belong in a lighting specification next to the average PPFD and DLI targets.
This guide covers the definitions, the measurement method, the acceptance targets worth writing into a contract, and the design and commissioning steps that hold uniformity over time. It is written for operators specifying or retrofitting commercial lighting, where the cost of an uneven canopy is measured in scheduling and labor, not just electricity.
Grow Light Uniformity and PPFD Fundamentals
Defining PPFD, DLI, and CV%
Photosynthetic photon flux density (PPFD) is the photon flux in the 400–700 nm photosynthetically active radiation (PAR) band arriving per unit area per second, expressed in µmol·m⁻²·s⁻¹. It is an instantaneous reading at a point on a plane. Daily light integral (DLI) is the accumulated photon dose over a photoperiod, in mol·m⁻²·d⁻¹, and it is calculated from PPFD: DLI = PPFD × 3,600 × hours ÷ 1,000,000. At 18 hours, the multiplier is 0.0648, so a steady 600 µmol·m⁻²·s⁻¹ delivers about 38.9 mol·m⁻²·d⁻¹. The Virginia Cooperative Extension guide to DLI sets out the same conversion and warns that timing a crop cycle to average DLI matters, because a cycle planned around a seasonal average will run short in the low-light weeks.
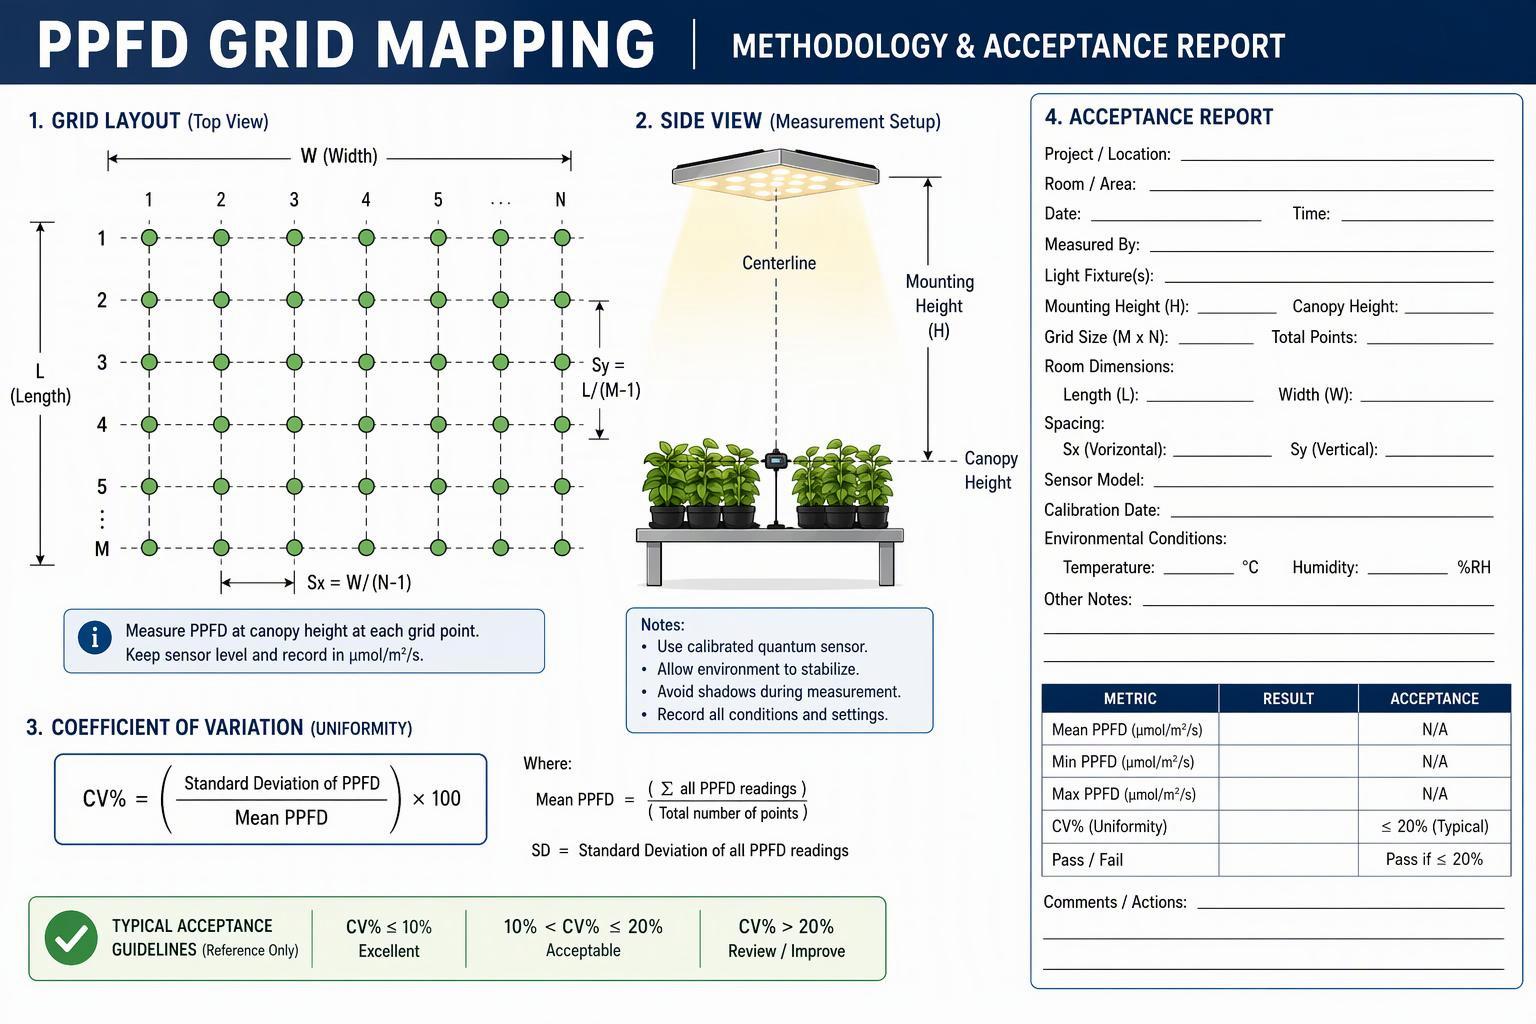
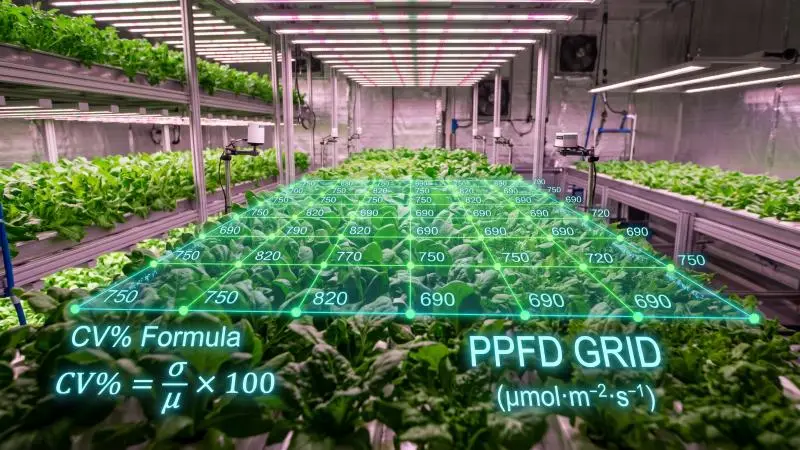
The coefficient of variation is the standard deviation of the PPFD readings divided by their mean, expressed as a percentage: CV% = (standard deviation ÷ mean) × 100. A CV of 10% means roughly two-thirds of measured positions fall within ±10% of the average if the readings are approximately normally distributed. It is a single number that captures spread across the whole mapped area, which is why it is convenient in a specification and in a commissioning report.
CV% vs Min/Avg and Min/Max
CV% and the ratio metrics answer different questions, and a specification that uses only one can be satisfied by a layout the other would reject.
CV% is a global measure. It is sensitive to every reading, including a single hot spot under a fixture or a dark corner behind a door. That makes it a good summary of overall evenness, but it can look acceptable while a meaningful share of the canopy sits well below target.
Min/Avg (sometimes written Uo) is a floor measure: the dimmest measured position divided by the mean. It tells you how bad the worst spot is relative to the average, which is the number that matters for the plants that will lag. Min/Max (sometimes written Ud) is the same idea taken to the extreme, and it is the most punishing of the three because it compares the best position to the worst.
A worked example shows why the choice matters. Suppose a bay averages 600 µmol·m⁻²·s⁻¹ with a standard deviation of 60. CV% is 10%, which reads as tight. But if the minimum is 420, Min/Avg is 0.70 — a 30% shortfall at the weakest positions. A layout can pass a CV target and still leave a strip of canopy chronically under-lit. For that reason, commercial specifications increasingly pair a CV ceiling with a Min/Avg floor, so the average cannot be met by over-lighting one zone to compensate for another.
Terminology Aligned to ANSI/ASABE and DLC
The vocabulary above is not free-floating. The DLC Horticultural Lighting Technical Requirements V4.0 states that its nomenclature references ANSI/ASABE S640, Quantities and Units of Electromagnetic Radiation for Plants (Photosynthetic Organisms), and, where applicable, ANSI/IES RP-45-21 and ANSI/IES LS-1-22, with deviations noted. That matters when you write a specification: use the standard terms and units, and state the standard you are referencing, so a supplier’s submittal and your acceptance test use the same definitions.
One boundary is worth stating plainly. The DLC program qualifies fixtures on reported and tested performance — PPF, spectral quantum distribution, photosynthetic photon efficacy (PPE, with a 2.5 µmol·J⁻¹ threshold), controllability — measured under ANSI/IES LM-79. It does not publish a canopy uniformity target. Uniformity is a property of an installed layout in a room, not of a fixture on a test report, so a CV or Min/Avg figure in a specification is a project requirement, not a certification claim. Treat any vendor number presented as a standard as a design claim that needs its measurement conditions attached.
Measurement and Acceptance Criteria
Manufacturer-stated error sources for one quantum sensor family (Apogee SQ-100/300 series). These are specifications, not a combined error budget — the individual errors are not simply additive and depend on angle, spectrum and temperature.
Canopy Plane and Grid Design
Uniformity is only meaningful relative to a defined plane. Measure at the canopy surface the crop will actually occupy, or at the grow media for short crops, and record the height. A reading taken at the fixture or at bench height describes a different surface and will not predict what the plants receive. The Resource Innovation Institute lighting guide makes the point directly: a reading taken directly below a light source is not representative of the grow room, and PPFD should be measured at multiple places at a consistent elevation aligned with canopy height.
Grid density drives what the CV can detect. A sparse grid of a handful of points can miss a hot spot between fixtures or a dark edge row entirely. A practical approach is to map on a regular grid fine enough to resolve the fixture spacing — for example, sample points at intervals no wider than half the distance between fixture rows, plus dedicated points at the room edges, walkways, and under the first and last fixture in each row. Record the grid coordinates, the plane height, and the number of points with the results, because a CV without its grid density is not reproducible.
Line quantum sensors, which average PPFD over their length, are useful for this work: the Apogee SQ-300 series manual describes them as providing spatially averaged PPFD measurements, which reduces point-to-point noise from a single diode and speeds up a large grid.
Sensor Calibration and Operating Conditions
A uniformity map is only as good as the instrument behind it. Quantum sensors drift, and the same manual recommends recalibration roughly every two years, sooner if your tolerances are tight. Calibration uncertainty for that sensor family is stated at ±5%, which is large relative to a 10% CV target — so the sensor’s own error must be understood before small differences between positions are treated as real. Keep a calibration record for every sensor used in acceptance testing and note the calibration date in the report.
Operating conditions change the reading. Measure with the room at its normal operating temperature and with fixtures at their normal dimming level and warm-up state, because output shifts as drivers and diodes reach thermal equilibrium. Clean the sensor diffuser before each session; dust and salt deposits are a common cause of low readings, per the same manual. Hold the sensor level, since a tilted sensor under-reads. And for greenhouse maps, record the time of day and sky condition, because daylight and electric light combine and the uniformity of the combined field changes through the day.
Targets: CV≤10–15%, Min/Avg≥0.80
The targets in common commercial use are a CV of 10–15% or better and a Min/Avg of at least 0.80. These are working figures, not a published standard, and they should be written as project requirements with their measurement method attached.
The basis for the range is practical. Horticultural literature summarized by All Things Lighting notes that a 10–20% variation in intensity is often treated as acceptable, while tighter targets of about ±5% have been proposed for greenhouses and plant factories. The same source describes the U90 and U80 metrics — the percentage of measured points above 90% or 80% of the maximum — as an alternative way to express how much of the canopy sits within a band of the peak. A specification can use CV%, Min/Avg, or a band-coverage metric, but it should name one and define it.
A defensible acceptance clause states: the metric, the formula, the plane height, the grid density and coordinates, the sensor model and calibration date, the operating conditions, and the pass threshold. It also states what happens on a fail — typically a remap after adjustment, not a waiver. That structure lets an independent commissioning agent reproduce the result and lets a supplier know exactly what will be measured.
Impacts on Yield, Scheduling, and Energy
Tomato yield reduction in a southern Spain greenhouse trial (2023–2024 season) where opaque roof sheets mimicked PV modules at 30% and 50% cover, compared with an unshaded control. This measures total light reduction, not canopy uniformity.
Yield and Quality Consistency
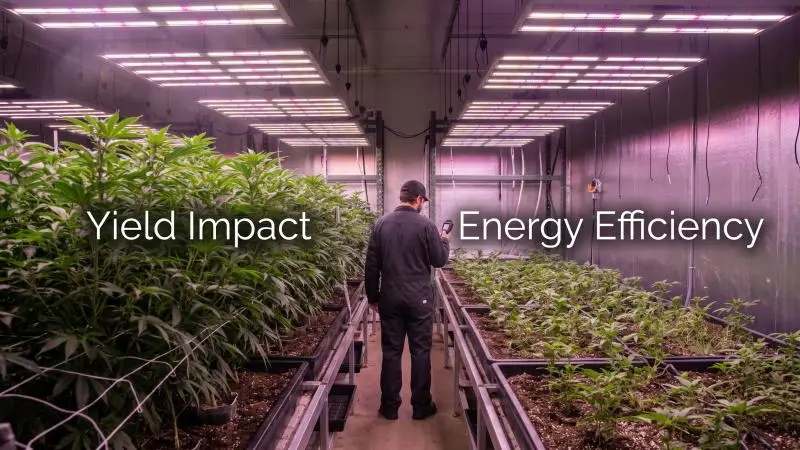
Uniformity does not raise the average; it narrows the spread around it. That distinction matters when you model the return on a lighting investment. A 2023 study on pea microgreens in a vertical farm, summarized in the MDPI horticultural light collection, found no statistically significant difference in tray yield between zones with the same average PPFD but different uniformity. However, analysis of individual plants showed that local PPFD differences explained about 31% of the variation in fresh weight, with the rest attributed to germination and growth noise. In other words, uniformity is a lever on consistency at the plant level even when the tray average is unchanged — and consistency is what grading, packaging, and repeat orders depend on.
The same logic runs through the greenhouse literature. In a 2023–2024 tomato trial in southern Spain, shading that reduced light also reduced yield: 30% roof shading cut crop yield by 15% and 50% shading cut it by 26%, as reported in Kujawa et al., AgriEngineering 7(6):178. That study is about total light reduction, not uniformity, and it should not be read as a uniformity result. Its relevance is directional: where light is short, yield follows. A canopy zone running 20–30% below the average is, for the plants under it, a permanently shaded zone.
Harvest Timing and Labor Planning
Uneven PPFD turns one harvest into several. Plants that received less light mature later, so a bay that should clear in a single pass needs a second and sometimes a third cut. Each additional pass costs labor hours, disrupts the bench schedule, and pushes the next crop’s start date. It also complicates the quality story: a mixed harvest delivers a wider weight and grade distribution, which affects pack-out and contract fulfillment.
A tighter uniformity target compresses the maturity window. That does not guarantee a single-pass harvest — genetics, irrigation, and temperature still vary — but it removes light as a major source of spread. For scheduling, the practical benefit is a harvest date you can plan labor against with more confidence, and a bench turnover that runs closer to the design cycle.
Energy and HVAC Implications
An uneven layout is an inefficient layout. If the dimmest positions must reach a DLI target, the average has to be pushed up to lift the floor, which means the brightest positions are over-lit relative to what the crop can use. At high PPFD, photosynthesis saturates, so the extra photons above saturation are paid for in electricity and rejected as heat rather than converted to biomass. The MDPI collection notes that raising intensity, for example from 250 to 700 µmol·m⁻²·s⁻¹, dramatically increases energy consumption, which is why optimizing intensity to the crop’s demand matters.
Heat load follows the same curve. Every watt delivered to the canopy that is not used photosynthetically becomes sensible and latent load the HVAC must remove. The RII guide notes that energy represents 30–60% of operating expense for indoor and greenhouse facilities, and that LED drivers are 92–95% efficient, so a 630 W fixture’s power supply may emit about 40 W of heat. Over-lighting to compensate for a weak zone adds both lighting energy and cooling energy, and the second is often the larger surprise in a retrofit model.
Design and Commissioning Tactics
Layout Overlap and Optics Selection
Uniformity starts in the layout. Fixture spacing, beam angle, and the overlap between adjacent fixtures determine the shape of the light field before any measurement is taken. Wider beam angles and closer spacing produce more overlap and a flatter field at a given mounting height; narrow beams concentrate light and create peaks and valleys unless the spacing is tightened. The RII guide advises understanding the layout of cultivation spaces and walkways, because they affect fixture spacing, uniformity, and spill light.
Optics selection should follow the layout, not the other way around. Ask for the fixture’s intensity distribution data and model the field at your actual mounting height and spacing before committing. A layout that looks even on a spacing chart can develop hot spots where rows converge and dark strips at the aisle edges.
Mounting Height, Edge Compensation, Zoning
Mounting height is the most direct uniformity control. Raising fixtures flattens the field by increasing overlap, at the cost of lower PPFD at the canopy for the same output — so the trade is height against drive current. The RII guide notes that LED fixtures in vertical racks can be mounted within about 12 inches of the canopy, while greenhouse supplemental fixtures typically sit 3–10 feet above the canopy near gutter height. Closer mounting saves energy but narrows the overlap, so the spacing must tighten to compensate.
Edge compensation addresses the boundary. The outermost rows receive light from one side only, so they run dim unless the layout accounts for it: a dedicated edge row, a slightly higher drive level on the perimeter fixtures, or a reflective wall treatment. Zoning lets you control this independently. Splitting a bay into zones with separate dimming means the perimeter zone can be trimmed or boosted without changing the interior, and it gives you a control point for later remapping.
This is where deployment support matters in practice. SLTMAKS supplies commercial LED fixtures with documented layouts and dimming controls, and its North American warehouses support retrofit scheduling. (Brand context, not a performance claim.)
Indoor Multi-Tier and Greenhouse Specifics
The two environments fail in different ways. In indoor multi-tier racks, the short distance between fixture and canopy is the dominant constraint: a low tray height narrows the overlap and produces a strong center-to-edge gradient. The All Things Lighting summary describes a case where an unusually low 11-inch tray height was chosen specifically to show how canopy height changes uniformity, and notes that greater tray heights improve uniformity — but that reducing luminaire rows to save fixtures shrinks the consistently usable growing area. In multi-tier design, the usable area and the uniformity target have to be optimized together.
Greenhouses add daylight. The electric field and the solar field combine, and the combined uniformity shifts with sun angle, season, and cloud cover. Map the electric-only field at night for commissioning, then map the combined field at the times of year when DLI is lowest, as the RII guide recommends, because that is when supplemental light is doing the most work and when a weak zone hurts most. Record the time and sky condition with every greenhouse map.
Conclusion
Uniformity is a yield and ROI lever because it converts an average into a predictable outcome. A bay with a tight CV and a high Min/Avg matures on a schedule you can staff, grades within a narrower band, and stops paying for photons the crop cannot use. The return shows up as fewer harvest passes, less over-lighting, and a lower cooling load — not as a higher average on the design sheet.
Write the rigor into the specification. Name the metric and its formula, fix the canopy plane and grid density, require calibrated sensors and stated operating conditions, and set both a CV ceiling and a Min/Avg floor. State what a failed map triggers: adjustment and remap, not a waiver. That clause is what makes the target enforceable at commissioning.
Then keep measuring. Fixtures depreciate, optics collect dust, and layouts drift when racks move or crops change height. A remap after every canopy change, paired with dimming zones and a documented trend log, is how a uniform installation stays uniform across its service life.
FAQ
What is light uniformity (CV%) and why is it crucial for commercial growing?
The coefficient of variation (CV%) is a global metric calculated by dividing the standard deviation of photosynthetic photon flux density (PPFD) readings by their mean and expressing it as a percentage. It is crucial because uneven light causes plants in the same batch to mature at different times with varying quality, increasing labor costs for multiple harvests and wasting energy on photons the plants cannot use.
What is the fundamental difference between the CV% and Min/Avg metrics?
CV% is a global measure summarizing the overall evenness across the entire canopy, but it can mask significant local light deficiencies. Min/Avg is a floor measure specifically used to reveal how far the dimmest position lags behind the average, which is critical for avoiding zones of chronically under-lit plants.
How should light uniformity be properly measured and recorded in commercial specifications?
Measurements must be taken at the canopy surface actually occupied by the crop, using recently calibrated quantum sensors under normal room operating temperatures. Testing requires a sufficiently dense regular grid to capture hot spots and dark edges, and conditions like grid coordinates, plane height, and sensor model must be recorded in the report.
Why does uneven lighting significantly increase a facility’s energy and HVAC costs?
If the overall average is pushed up to ensure the dimmest positions reach target lighting, plants in the brightest zones will be over-lit, absorbing photons beyond their photosynthetic saturation point. This excess energy cannot be converted into biomass and is instead rejected as heat, dramatically increasing the cooling load the HVAC system must remove.