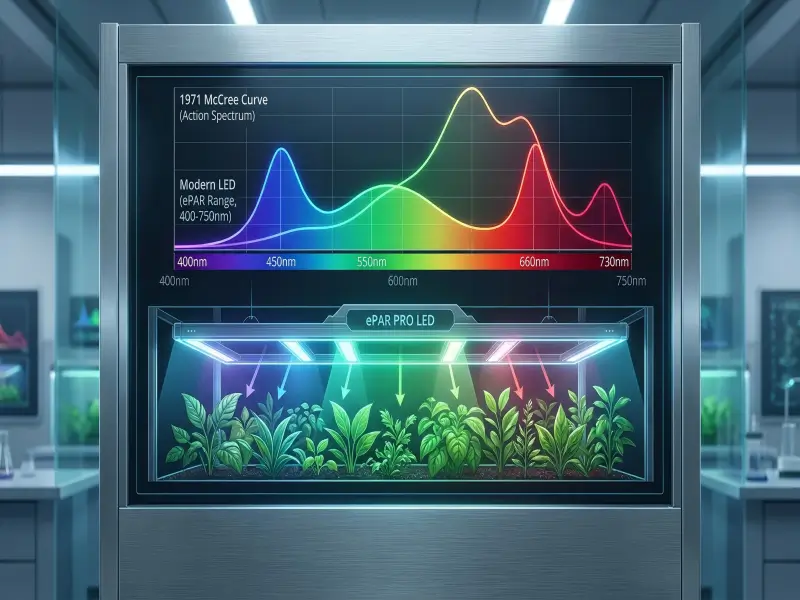
Commercial indoor cultivation has undergone a profound transformation over the past decade. As facility operators transition from legacy high-pressure sodium (HPS) fixtures to advanced solid-state lighting, spectroradiometric quality has become as critical as total power output. At the center of almost every discussion regarding horticultural spectrum design lies a foundational photobiological benchmark: The McCree Curve.
Formulated over fifty years ago, the McCree Curve defined how plant leaves absorb and process light across different wavelengths. However, as LED technology evolved, early fixture manufacturers frequently misapplied this single-leaf action spectrum, creating narrow “blurple” (blue-red) lights that underperformed in commercial multi-tier environments.
Understanding the historical origin of the McCree Curve—and recognizing its physical limitations when applied to whole-crop canopies—is essential for facility directors, master growers, and agricultural engineers evaluating modern lighting investments.
Table of Contents
What Is the McCree Curve? (Keith McCree’s 1971 Breakthrough)
To evaluate the relevance of the McCree Curve today, one must first examine how it was originally established in the laboratory.
In the late 1960s and early 1970s, Dr. Keith J. McCree, a physicist and professor of soil and crop sciences at Texas A&M University, sought to quantify how different colors of light drive photosynthesis in higher plants. At the time, photobiologists lacked a unified, standardized metric for measuring plant-active light, often relying on human visual lumens or lux—units that weigh green light heavily based on human eye sensitivity (the photopic response) while ignoring wavelengths critical to plant physiology.
Monochromatic Light Chambers and Single-leaf Quantum Yield
According to GLASE’s historical review of plant action spectra, Dr. Keith McCree published his seminal research in 1971 in the journal Agricultural Meteorology under the title “The action spectrum, absorptance and quantum yield of photosynthesis in crop plants”.
McCree tested 22 crop species—including tomato, cucumber, lettuce, oat, wheat, and bean plants—grown across both field environments and controlled growth chambers. His methodology relied on a specialized laboratory setup:
- Monochromatic exposure: Individual, detached leaf samples were placed inside an enclosed assimilation chamber.
- Sub-Saturating Light Levels: Leaves were exposed to narrow, isolated wavelengths of light (from 350 nm to 750 nm) at low photon flux densities (sub-saturating light levels, typically under 100 µmol/m²/s).
- Quantum yield measurement: McCree measured the rate of net carbon dioxide (CO2) uptake per incident photon, establishing the quantum yield of photosynthesis (mol CO₂ / mol photons).
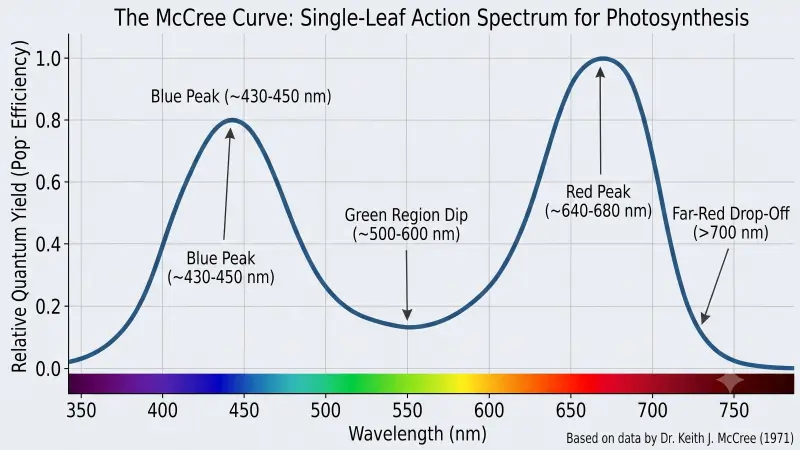
McCree’s data revealed two primary photosynthetic efficiency peaks:
- Red wavelength peak (640–680 nm): The highest photosynthetic efficiency per absorbed quantum, where chlorophyll excitation efficiently fuels Photosystem II and Photosystem I.
- Blue wavelength peak (430–450 nm): A secondary efficiency peak driven by strong chlorophyll a and b absorption, alongside carotenoid light harvesting.
- Green region dip (500–580 nm): A modest decrease in single-leaf quantum yield (approximately 20% to 30% lower than red light) due to lower initial absorptance in thin leaf tissue.
Key takeaway: The McCree Curve measures single-leaf carbon fixation under low-intensity monochromatic light. It proves that plants use all visible wavelengths between 400 nm and 700 nm for photosynthesis, rather than relying exclusively on red or blue light.
Establishing the 400–700 nm PAR Spectrum
Before McCree’s work, lighting engineers evaluated fixtures using illuminance meters calibrated to human vision. McCree’s findings demonstrated that plants respond to photon count (quantum flux) rather than visual brightness or radiometric energy alone.
Because McCree observed that photosynthetic CO2 fixation dropped sharply below 400 nm (ultraviolet boundary) and above 700 nm (far-red boundary), his research provided the empirical basis for defining Photosynthetically active radiation (PAR) as the waveband from 400 nm to 700 nm. This 400–700 nm standard became the baseline for measuring Photosynthetic Photon Flux Density (PPFD) across horticulture for over four decades.
Single-Leaf Quantum Yield vs. Whole-Canopy Photosynthesis
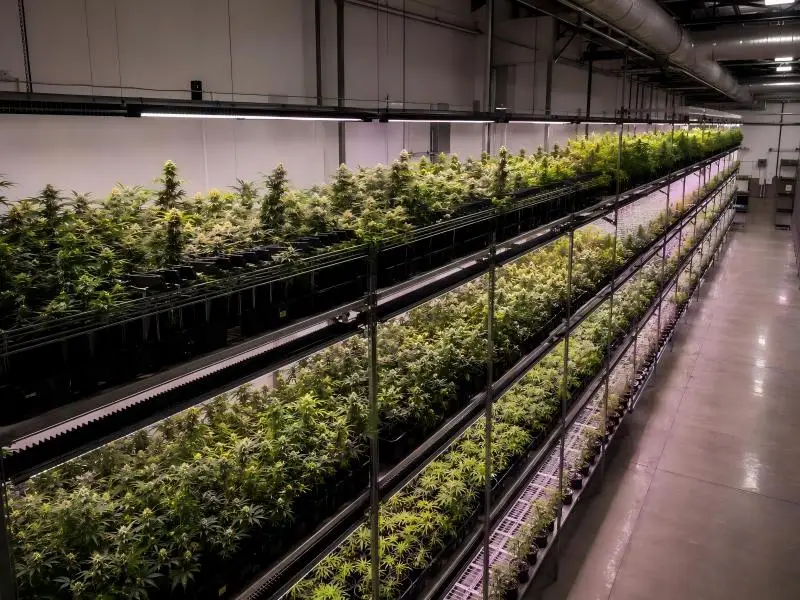
While the McCree Curve remains a vital historical milestone in plant physiology, modern commercial cultivators must navigate a fundamental physical distinction: a single leaf in a laboratory chamber does not behave like a dense crop canopy under high-intensity commercial LED arrays.
The Upper-canopy Chlorophyll Saturation Problem
In a commercial indoor cultivation facility operating at high light intensities (800 to 1,500+ μmol·m⁻²·s⁻¹ PPFD), top canopy leaves receive an abundance of photons.
Chlorophyll a and b molecules located in the uppermost cell layers of top leaves absorb red (660 nm) and blue (450 nm) photons with extreme efficiency—absorbing over 90% of incident red and blue light within the top 100 micrometers of leaf tissue.
However, under high photon flux, the photosynthetic electron transport chain in these upper leaves quickly reaches a light-saturation threshold. Once top leaves become saturated, additional red and blue photons cannot be processed efficiently and are dissipated as waste heat through non-photochemical quenching (NPQ).
The Canopy Penetration Paradox: How Green Light Drives Sub-canopy Yields
In contrast to red and blue light, green photons (500–600 nm) are absorbed less strongly by individual upper chloroplasts. Rather than being wasted, green light reflects and scatters internally through the leaf mesophyll structure.
This optical scattering allows green photons to pass through upper foliage and penetrate deep into the middle and lower canopy layers. Peer-reviewed research published in Frontiers in Plant Science (2021) confirms that when top leaves are light-saturated under high PPFD, transmitted green photons drive lower-canopy photosynthesis far more effectively than additional red or blue light that top leaves cannot process.
| Wavelength Band | Single-Leaf Absorptance | Canopy Penetration Depth | Role in High-PPFD Commercial Indoor Rooms |
|---|---|---|---|
| Blue (400–500 nm) | Very High (>90%) | Shallow (Top 5–10% of canopy) | Controls stomatal opening, suppresses internodal elongation, regulates morphology. |
| Green (500–600 nm) | Moderate (70–80%) | Deep (Penetrates mid and lower foliage) | Drives sub-canopy carbon fixation, improves light distribution, enables natural crop inspection. |
| Red (600–700 nm) | Highest (>92%) | Shallow to Moderate | Drives primary photosynthetic electron transport; highly efficient at sub-saturating PPFD. |
| Far-red (700–750 nm) | Low (<30%) | Extreme (Passes through entire canopy) | Accelerates Photosystem I, drives Emerson Effect, triggers shade avoidance and leaf expansion. |
How 1st-Generation “Blurple” LEDs Misapplied McCree’s Findings
When light-emitting diodes first entered the horticultural market in the late 2000s, fixture designers sought to maximize electrical efficiency by targeting the highest peaks of the McCree Curve.
The Narrow-band Trap: 450 nm Blue and 660 nm Deep Red
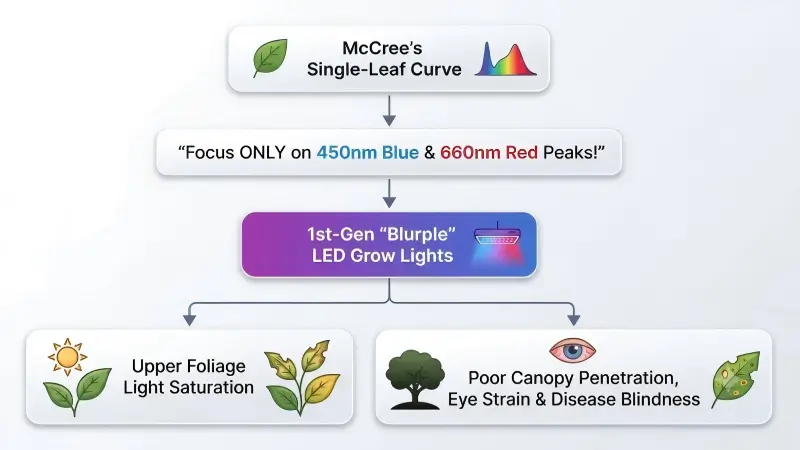
Early manufacturers reasoned: “If McCree’s Curve shows efficiency peaks at 450 nm and 660 nm, and a dip in the green region, we should eliminate green LEDs and build fixtures containing only narrow-band red and blue diodes.”
This approach created the characteristic pink/purple (“blurple”) grow lights. While these fixtures demonstrated high energy conversion efficiency on paper by avoiding phosphor conversion losses, they introduced severe operational drawbacks in commercial facilities:
- Sub-canopy shadowing: Because red and blue photons were absorbed almost completely by the top 2 inches of foliage, lower leaves remained in dark shadow, leading to lower-branch dieback and reduced overall crop biomass.
- Photodamage and heat stress: Concentrating massive photon density into narrow 660 nm and 450 nm bands caused localized photo-inhibition on top leaves.
- Crop inspection blindness: Under magenta light, human technicians cannot detect early pest infestations, nutrient deficiencies, or fungal pathogens (such as powdery mildew or botrytis) because plant tissue colors are completely distorted.
Pro tip: Avoid evaluating LED grow lights purely by single-leaf action spectrum peaks. High-yield commercial facility operation requires a broad, full-spectrum distribution that balances top-canopy photosynthesis with deep lower-foliage light penetration.
From McCree (400–700 nm) to ePAR (400–750 nm) & Far-Red Dynamics
Horticultural lighting physics has advanced beyond the classical 400–700 nm PAR boundary. Over the past five years, photobiologists have redefined the upper limits of photosynthetically active light.
The Emerson Enhancement Effect and Photosystem I/II Synergy
In the 1950s, biophysicist Robert Emerson discovered that exposing plants simultaneously to long-wave red light (>700 nm) and shorter-wave red light (<680 nm) produced a rate of photosynthesis greater than the mathematical sum of the two wavelengths measured independently. This phenomenon is known as the Emerson Enhancement Effect.
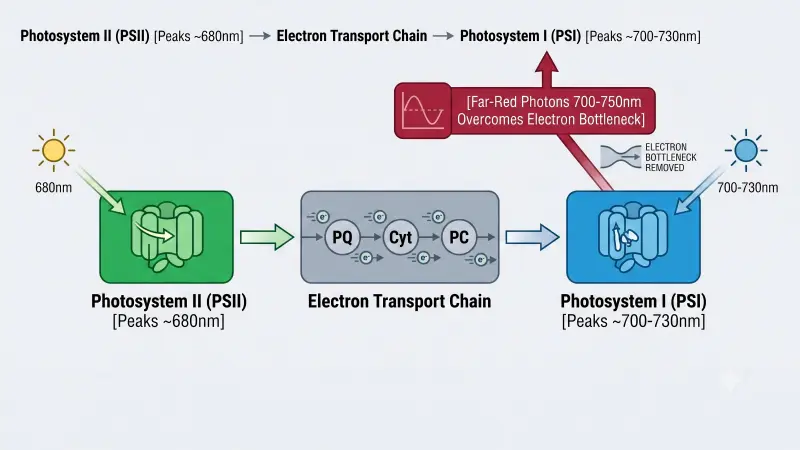
Photosynthesis relies on two reaction centers operating in series:
- Photosystem II (PSII): Absorbs photons preferentially up to 680 nm.
- Photosystem I (PSI): Absorbs longer wavelengths, peaking around 700 nm to 730 nm.
When plants receive light strictly within the traditional 400–700 nm PAR range, Photosystem II can run faster than Photosystem I, creating an electron transport bottleneck. Adding far-red photons (700–750 nm) stimulates Photosystem I, balancing the electron flow and accelerating overall photosynthetic rate.
Modern DLC 3.0+ Standards and Full-spectrum White LED Engineering
Recognizing the photosynthetic contribution of far-red light, the DesignLight Consortium (DLC)—the governing body for utility rebate eligibility in North America—updated its Technical Requirements in 2023. The DLC Qualified Products List (QPL) 3.0 formally introduced ePAR (extended Photosynthetically Active Radiation), expanding the recognized horticultural waveband from 400 nm to 750 nm.
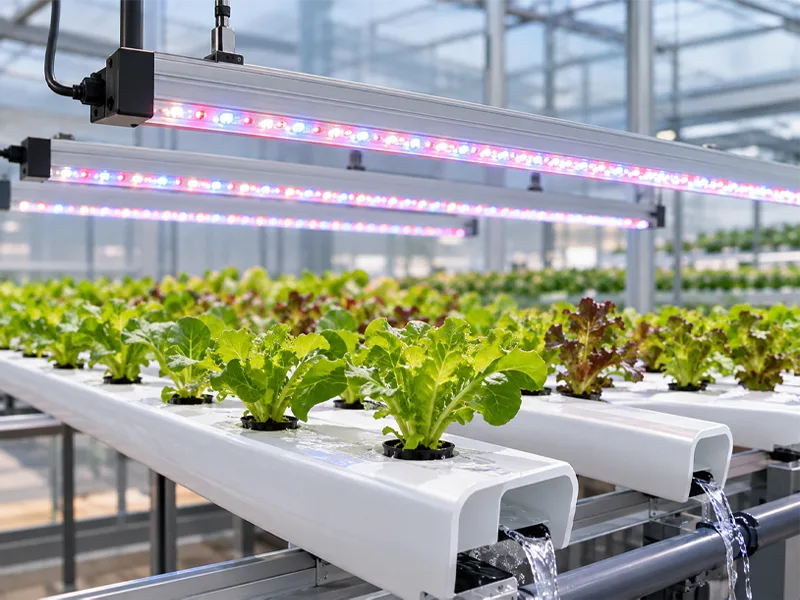
Modern commercial LED fixtures achieve this balanced output by pairing high-efficiency phosphor-converted broad-spectrum white diodes with deep red (660 nm) and far-red (730 nm) supplemental LEDs.
Commercial facilities scaling indoor production often adopt commercial 720W full-spectrum LED fixtures to achieve broad photon distribution that mirrors natural solar proportions across multi-tier setups. For high-density racks requiring precise canopy penetration, deploying high-power 1000W LED grow lights provides uniform PPFD across dense canopy layers while maintaining low thermal output through heavy-duty aluminum heat sinks.
Practical Spectrum Evaluation for Commercial Cultivation Operators
When selecting LED lighting architecture for multi-room commercial farms or vertical facilities, operators should use a structured photobiological evaluation framework.
Beyond Quantum Yield: Evaluating Efficacy (μmol/J), DLI, and Uniformity
Instead of relying solely on historical single-leaf curves, evaluate fixtures based on facility-level performance metrics:
- Photosynthetic photon efficacy (PPEμmol/J): Measures how efficiently a fixture converts electrical power (Watts) into usable ePAR photons. Modern commercial fixtures should deliver ≥ 2.7 to 3.0 μmol/J.
- Canopy PPFD uniformity (≥ 90%): High uniformity across the entire footprint prevents hot spots directly under fixtures and light starvation along rack edges, ensuring uniform crop ripening.
- Daily light integral (mol/m²/d): The cumulative sum of photons delivered over a 24-hour photoperiod. Broad-spectrum lighting allows crops to tolerate higher total DLI without leaf chlorosis or bleaching.
⚠️ Warning: Never evaluate a grow light solely on its center PPFD reading. A fixture with a high center spot reading but poor edge uniformity creates yield variance and uneven irrigation drying rates across commercial tables.
Real-world Facility Impact: HVAC Loads and Thermal Management
Upgrading from HPS to high-efficacy broad-spectrum LED lighting alters facility thermodynamics:
- HVAC heat load reduction: High-efficacy LED fixtures emit significantly less radiant heat (infrared radiation) toward the canopy than HPS lamps. High-DLI rooms requiring maximum photon flux density benefit from 1300W indoor cultivation lighting systems engineered with passive aluminum heat sinks, which reduce facility air conditioning cooling loads by 30% to 40%.
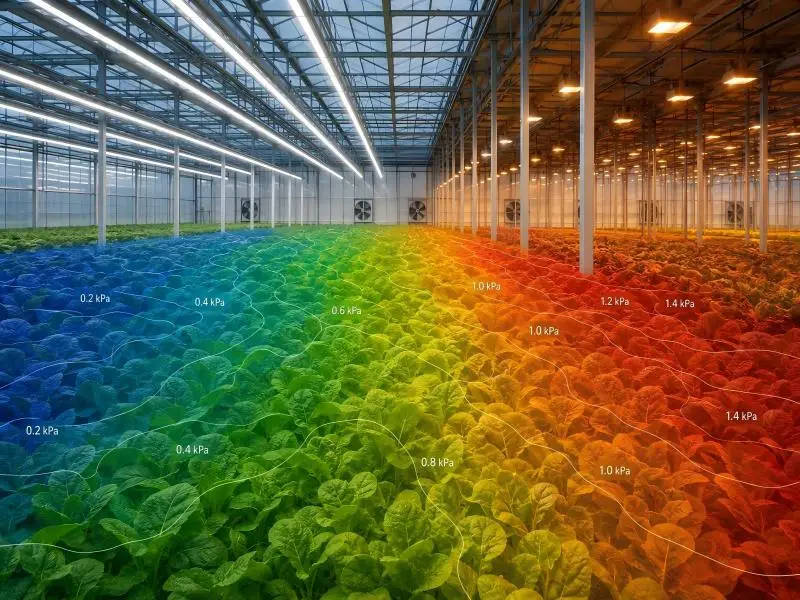
- Canopy microclimate management: Lower radiant heat output means leaf temperatures under LEDs run 2°F to 5°F cooler than under HPS at identical ambient air temperatures. Facility directors must adjust ambient room temperatures and VPD (Vapor Pressure Deficit) targets accordingly to maintain optimal transpiration rates.
FAQ
Is the McCree Curve still accurate?
Yes, the McCree Curve remains scientifically accurate for what it measured: the photosynthetic CO2 exchange of a single, isolated leaf under low-intensity monochromatic light. However, it is incomplete for predicting whole-plant biomass accumulation, canopy photon penetration, or light responses under high PPFD broad-spectrum commercial LEDs.
What is the difference between PAR and ePAR?
PAR (Photosynthetically Active Radiation) measures photons from 400 nm to 700 nm. ePAR (extended Photosynthetically Active Radiation) expands this waveband to 400 nm to 750 nm, formally incorporating far-red photons (700–750 nm) that actively drive photosynthesis via the Emerson Enhancement Effect.
Why is green light included in modern LED grow lights if McCree’s curve showed a dip?
While green light has slightly lower single-leaf absorptance than red or blue light, green photons scatter through upper foliage and penetrate deep into middle and lower canopy layers. Under high-PPFD commercial lighting, green light drives sub-canopy photosynthesis and provides true-color rendering for facility personnel.
How does spectrum selection affect commercial HVAC loads?
Broad-spectrum LED fixtures with high photon efficacy ($\mu\text{mol/J}$) convert a higher percentage of input electrical energy into photons rather than waste heat. This reduces sensible cooling loads on facility HVAC systems compared to legacy HPS or low-efficacy fixtures.
Next Steps: Optimizing Your Facility’s Spectral Strategy
Upgrading or designing a commercial indoor cultivation facility requires balancing photobiological precision with industrial durability, thermal engineering, and electrical compliance.
If you are planning a facility retrofit, multi-tier expansion, or new commercial build-out, partner with an engineering team that understands real-world photometrics. Explore SLTMAKS professional LED lighting solutions to access photobiological layout simulations, spectroradiometric datasheets, and energy rebate consultation tailored to your facility’s target DLI and crop requirements.