Introduction
Electricity consumed by supplemental lighting represents one of the largest operating expenses for commercial greenhouse facilities. Historically, growers operated supplemental lights using rigid timer schedules or simple light-threshold switches. Fixed schedules switch fixtures on full power for a preset photoperiod regardless of solar fluctuations, wasting electric energy during unpredicted afternoon clearings. Simple threshold switches cycle fixtures on and off repeatedly, creating electrical surges, rapid HVAC load shifts, and uneven canopy light delivery.
Dynamic light management replaces fixed operation with a cumulative photobiology metric: Daily Light Integral (DLI). Plants respond primarily to the total accumulation of photosynthetically active photons delivered over a 24-hour cycle rather than constant instantaneous brightness. By continuously measuring natural solar radiation inside the canopy and dynamically filling only the remaining light deficit, intelligent DLI control systems cut electrical usage by 20% to over 50% without compromising crop quality or yield.
Operating an intelligent DLI control greenhouse transforms supplemental lighting from a static overhead cost into an adaptive asset. The control system continuously calculates sunlight accumulation, predicts afternoon weather trends, and regulates dimmable LED fixtures to meet target photon counts with minimal kilowatt-hour (kWh) input.
This guide details the mathematical principles behind DLI tracking, the control mechanisms driving kWh reductions, hardware deployment standards, site-specific ROI modeling, and practical risk mitigation strategies for commercial operations.
Table of Contents
DLI Essentials
PPFD, Photoperiod, and DLI
Understanding light control requires distinguishing between instantaneous light intensity and cumulative daily photon delivery.
Photosynthetic Photon Flux Density (PPFD) measures the instantaneous intensity of photosynthetically active radiation (PAR, 400–700 nm wavelength) hitting a square meter of crop canopy per second. PPFD is expressed in micromoles per square meter per second (μmol·m⁻²·s⁻¹).
Photoperiod is the total duration of light exposure within a 24-hour day, measured in hours.
Daily Light Integral (DLI) quantifies the total cumulative number of light photons delivered to one square meter of crop over an entire day. DLI is expressed in moles per square meter per day (). While PPFD represents speed, DLI represents total distance traveled over the day.
Practical Formula and Quick Examples
Converting instantaneous PPFD and operating hours into cumulative DLI relies on a straightforward physics formula. Because 1 mol = 1,000,000 μmol and 1 hour = 3,600 seconds, multiplying PPFD by hours and by 3,600, then dividing by 1,000,000 yields DLI.
DLI (mol·m⁻²·d⁻¹) = [PPFD (μmol·m⁻²·s⁻¹) × Photoperiod (hours) × 3,600] / 1,000,000
This equation simplifies into a practical conversion factor:
DLI = PPFD × Photoperiod (hours) × 0.0036
Pro Tip: To quickly estimate required PPFD from a target light gap, divide the needed DLI by total available operating hours, then multiply by 277.8.
Consider two commercial greenhouse scenarios:
- Winter sole-source baseline: A commercial leafy green bay receives 300 μmol · m ² · s ¹ of continuous supplemental PPFD over a 16-hour photoperiod. DLI = 300 × 16 × 0.0036 = 17.28 mol·m⁻²·d⁻¹
- Mixed solar + supplemental day: On a partially cloudy spring day, natural sunlight provides an indoor DLI of 8.5 mol·m⁻²·d⁻¹. To hit a crop target of 17.0 mol·m⁻²·d⁻¹, the supplemental lighting must deliver a deficit of 8.5 mol·m⁻²·d⁻¹. Spread evenly over an available 14-hour lighting window: equired PPFD = 8.5 / (14 × 0.0036) = 168.65 μmol·m⁻²·s⁻¹
Running the LED fixtures at 168.7 μmol·m⁻²·s⁻¹ instead of full 300 μmol·m⁻²·s⁻¹ saves 43.7% in fixture energy draw across those 14 hours.
Typical Crop DLI Targets
Every crop species and growth stage possesses a specific light accumulation range for optimal physiological development. According to research published by Purdue University Extension and Virginia Tech Extension, targeting light integral below crop requirements reduces biomass accumulation, while over-lighting beyond the light saturation point yields diminishing returns and wastes electricity.
| Crop Category | Specific Crop | Minimum Acceptable DLI (mol·m⁻²·d⁻¹) | Optimal Target DLI (mol·m⁻²·d⁻¹) | Saturation Threshold (mol·m⁻²·d⁻¹) |
|---|---|---|---|---|
| Leafy greens | Butterhead / Bibb lettuce | 12.0 | 16.0–17.0 | 20.0 |
| Culinary herbs | Sweet basil | 14.0 | 18.0–20.0 | 22.0 |
| Vine crops | High-wire tomatoes | 20.0 | 25.0–30.0 | 35.0 |
| Fruiting crops | Strawberries | 15.0 | 20.0–22.0 | 25.0 |
| Floriculture | Bedding plants / Poinsettias | 10.0 | 14.0–16.0 | 18.0 |
| High-light crops | Medicinal cannabis | 25.0 | 35.0–45.0 | 50.0 |
How DLI Control Saves Energy
Real-time Sunlight and Deficit Logic
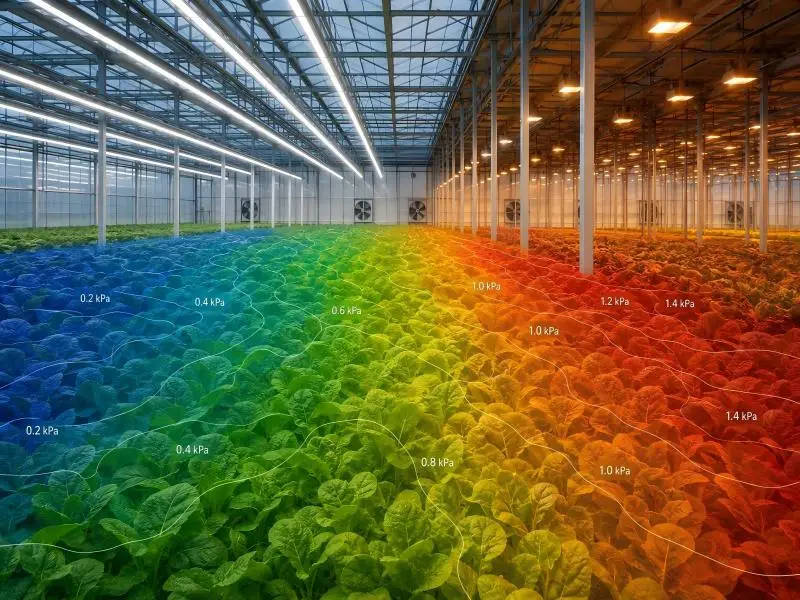
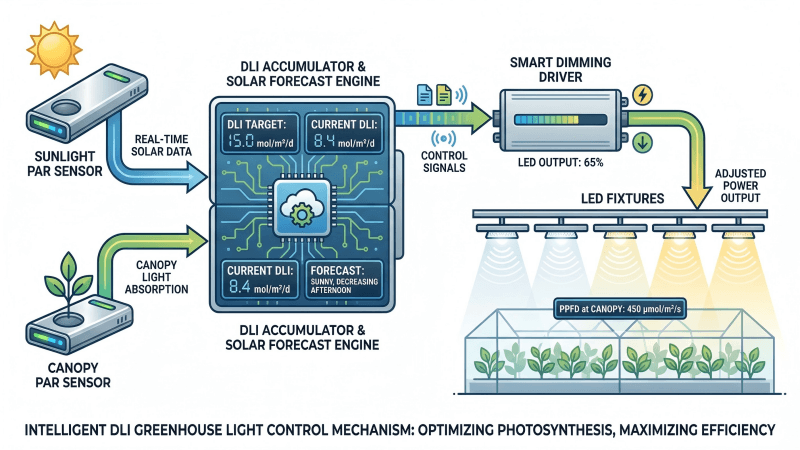
Intelligent light controllers run continuous closed-loop algorithms based on deficit tracking. Rather than forcing fixtures to run at 100% capacity during fixed operating blocks, the controller calculates the exact photon gap remaining between accumulated natural sunlight and the daily crop target.
DLI deficit = DLI target – DLI accumulated solar
Inside the greenhouse, canopy-level quantum PAR sensors measure instantaneous solar PPFD every second. The system integrates these readings continuously into a running daily total. As natural sunlight brightens during late morning, the system reduces supplemental LED wattage. When heavy cloud cover reduces indoor solar PPFD, the controller smoothly increases LED output to compensate.
Field research conducted by the New York State Energy Research and Development Authority (NYSERDA) demonstrated that dynamic light tracking reduced supplemental lighting electricity consumption by 26% compared to standard photoperiod and threshold controls while maintaining target crop yields.
Forecasting and End-of-day Caps
Advanced DLI software integrates local solar radiation forecasting and historical daily curves into its dimming logic. By predicting incoming afternoon solar flux based on real-time barometric and satellite data, the controller avoids over-lighting early in the morning when the sun is projected to satisfy the remaining light integral later in the day.
If the system calculates at 1:00 PM that expected natural solar radiation will meet the target DLI before dusk, it caps supplemental output immediately or turns fixtures off. Once the cumulative daily target is reached, the system enforces an end-of-day cap, preventing unnecessary kWh burn during late afternoon hours.
Smoother Output, Fewer Full-power Hours
Traditional threshold controllers use rigid on/off switching logic (e.g., “turn on full power when indoor PPFD drops below 200 μmol·m⁻²·s⁻¹”). This results in erratic power demand spikes, rapid light stress on plants, and excessive operating hours at full rated power.
Dynamic DLI control modulates LED drivers continuously via 0–10V or digital protocol signals. The system maintains LED fixtures in mid-range dimming bands (e.g., 20% to 60% power) for most of the operating window. Because LED driver efficiency and diode efficacy (μmol/J) remain high across mid-power bands, operating fixtures at reduced current yields cooler junction temperatures and improved electrical efficiency.
Deployment and Integration
Sensors, Zones, and Dimmable Drivers
Deploying an effective DLI control system requires robust hardware integration across three core layers:
- Canopy PAR sensors: Cosine-corrected, optical-grade quantum sensors measure Photosynthetically Active Radiation across the 400–700 nm waveband (or ePAR 400–750 nm). Sensors must be installed directly at the crop canopy level—not on the exterior roof or high above fixtures—to capture true light reaching the leaves, accounting for structure shading and glazing transmission losses.
- Control zoning: Greenhouses feature microclimates caused by structural posts, sidewall shading, and cooling pad placement. Facilities must be partitioned into distinct control zones (typically 5,000 to 20,000 sq. ft. per zone). Each zone relies on dedicated canopy sensors and independent dimming channels.
- Dimmable drivers: LED fixtures must utilize dimmable drivers supporting industrial control signals, including 0–10V analog, DALI-2, or RS485/Modbus digital protocols.
Hardware Specs and Compliance
Selecting horticultural lighting hardware for dynamic control environments requires verifying specific electrical and mechanical standards. Because fixtures undergo thousands of continuous micro-dimming adjustments annually, driver design and component quality directly impact system lifespan.
Key hardware requirements include:
- Low-end dimming stability: Standard industrial drivers often flicker or experience spectral shift when dimmed below 10%. High-performance horticultural fixtures must maintain linear, flicker-free output down to 1% power, allowing precise micro-adjustments during high-sunlight periods without destabilizing the electrical bus.
- Safety and compliance certifications: Facilities require safety compliance for local building inspections and utility incentive approval. Fixtures should carry North American ETL / UL 8800 horticultural lighting certification, European CE compliance, and RoHS environmental compliance.
- Spectral engineering: Fixtures should feature broad-spectrum white with deep red (660 nm) and far-red emission engineered specifically to align with chlorophyll A and B absorption peaks, maintaining consistent spectral balance across all dimming ranges.
- Commercial warranty: Commercial facilities require a minimum 3-year or 5-year comprehensive hardware warranty covering both LED boards and dimmable power supplies.
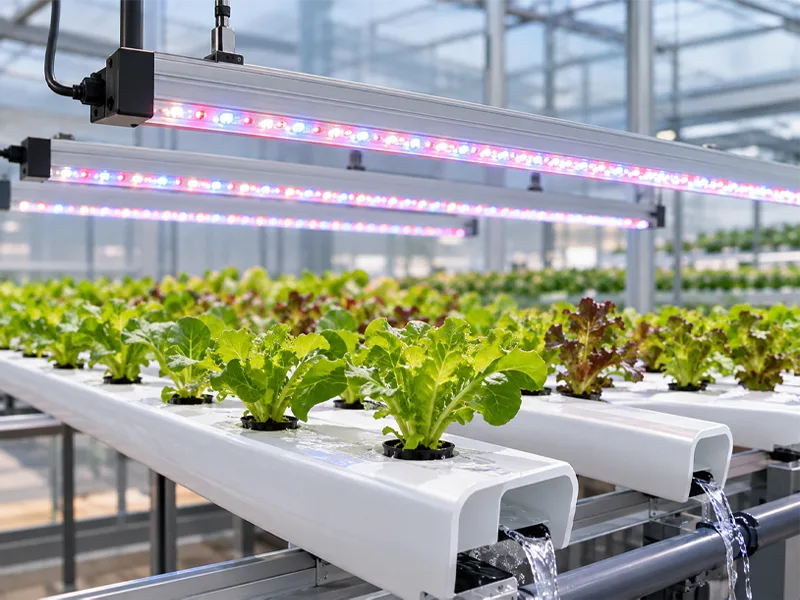
Hardware manufacturers like SLTMAKS build these requirements into commercial LED grow lights, incorporating full-spectrum Samsung diode arrays, low-end dimming driver stability, ETL/CE/RoHS safety compliance, and standard 3-year commercial warranties designed for automated greenhouse integration.
Commissioning, Dashboards, and Fail-safes
System commissioning requires calibrating canopy sensors against portable reference spectroradiometers after installation. The central control interface provides facility managers with real-time operational visibility across all zones.
Key dashboard monitoring features include:
- Real-time instantaneous PPFD vs. outdoor solar PPFD.
- Running cumulative DLI progress bar against daily crop targets.
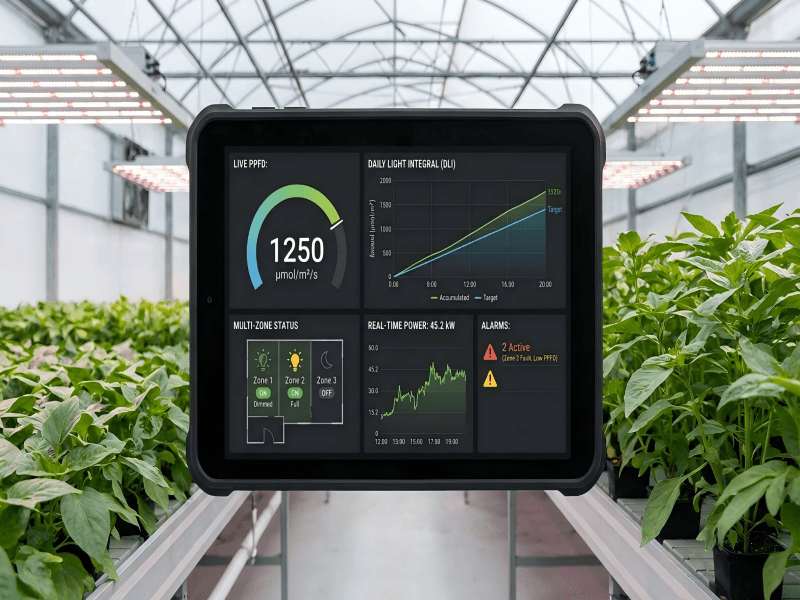
- Live fixture dimming percentage and real-time kW power draw per zone.
- Automated alert triggers for sensor drift, driver communication fault, or thermal thresholds.
Automated fail-safes are essential. If a canopy sensor loses communication or becomes shaded by growing leaves, the controller defaults to a safe fallback schedule based on historical solar averages rather than running fixtures at 100% indefinitely.
ROI and Incentives
Build a Site-specific ROI Model
Evaluating a DLI control retrofitting project involves calculating baseline energy consumption, projected kWh savings, and simple payback period.
Consider a 50,000 sq. ft. commercial greenhouse growing butterhead lettuce with a target DLI of 17.0 mol·m⁻²·d⁻¹:
- Connected lighting load: 250 kW of top-lighting LEDs.
- Electricity tariff: $0.14/kWh.
- Baseline fixed-timer operation: 16 hours/day at 100% output = 4,000 kWh/day = $560/day ($168,000 across a 300-day supplemental season).
- DLI Dynamic control operation: Reduces average daily supplemental lighting draw by 32% across the season through solar tracking and end-of-day caps.
- Daily savings: 1,280 kWh/day saved = $179.20/day.
- Annual energy OPEX reduction: $53,760 saved per year.
With hardware, sensor deployment, and controller installation costing approximately $45,000 for the facility, simple payback is achieved in under 10 months.
Utility Rebates and M&V
Energy efficiency utilities across North America actively subsidize automated lighting control retrofits. According to technical reports from the Greenhouse Lighting and Systems Engineering (GLASE) consortium, incorporating custom controls alongside DesignLights Consortium (DLC) listed LED fixtures qualifies facilities for custom prescriptive or performance-based rebates.
Rebates often cover $0.15 to $0.30 per annual kWh saved or up to 50% of total project equipment cost. Measurement and Verification (M&V) protocols require installing sub-metering on lighting panels for 30 days pre- and post-installation to verify baseline energy reductions for utility payout.
HVAC Interplay and OPEX Impact
Supplemental lighting adds significant sensible heat to the greenhouse microclimate. Every kilowatt-hour of electric lighting energy introduces approximately 3,412 BTU of heat into the space.
When intelligent DLI controllers reduce lighting electrical power during warm mid-day hours, the heat load placed on mechanical ventilation and pad-and-fan or chiller systems drops proportionally. Field measurements show that for every 3 kWh saved in supplemental lighting power, commercial facilities save approximately 1 kWh in cooling and ventilation energy, further accelerating total operational cost recovery.
Risks and Mitigations
Sensor Bias and Calibration
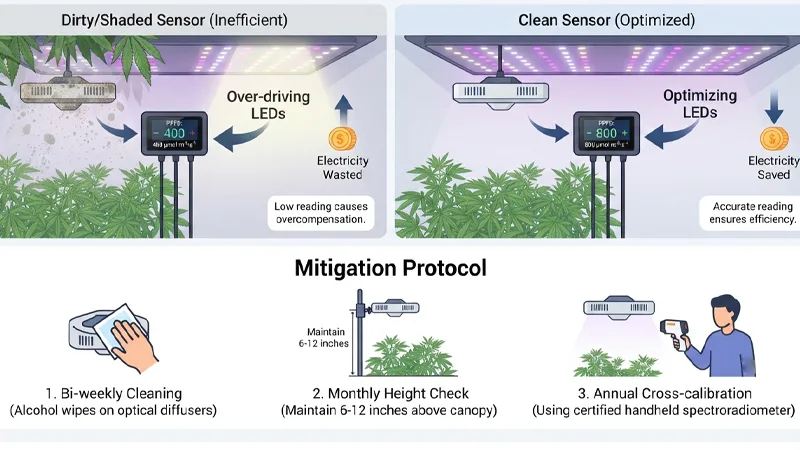
Canopy PAR sensors are subject to environmental contamination, water spotting, dust accumulation, and physical shading from growing plant canopies. A dirty or shaded sensor reports artificially low indoor PPFD, causing the controller to over-drive LED fixtures and waste electricity.
Mitigation Protocol:
- Clean quantum sensor optical diffusers bi-weekly using isopropyl alcohol wipes.
- Re-check sensor mounting height monthly, adjusting physical placement to maintain 6 to 12 inches above the expanding crop canopy.
- Perform annual cross-calibration using a certified handheld PAR spectroradiometer.
Network Reliability and Fail-safe States
Wireless or RS485 communication networks in humid, high-interference greenhouse environments can experience signal dropouts. If a control signal freezes while drivers are at 100% power, energy waste accumulates rapidly.
Mitigation Protocol:
- Configure LED driver hardware with hardware-level watchdogs. If no control signal is received for 300 seconds, the driver automatically steps down to a pre-programmed 20% safe-state output.
- Utilize shielded, twisted-pair cabling for wired RS485/Modbus runs, separating low-voltage control lines from high-voltage AC conduits.
Seasonal Target Tuning
Crop light requirements change dynamically based on seasonal temperature, humidity, and plant developmental stage. Applying a single static DLI target year-round leads to under-lighting during high-growth summer phases or light stress during cold winter months when transpiration rates are constrained.
Mitigation Protocol:
- Establish seasonal DLI recipe profiles within the central control system.
- Gradually ramp target DLI based on crop growth stages (e.g., 10 mol·m⁻²·d⁻¹ for young propagation plugs, ramping to 17 mol·m⁻²·d⁻¹ for finishing heads).
Conclusion
Key Takeaways and Next Steps
- Dynamic efficiency: Intelligent DLI control replaces rigid timer schedules by tracking real-time photon delivery, filling only the actual light deficit needed to reach target daily integrals.
- Proven energy reduction: Automated sunlight tracking, solar forecasting, and end-of-day caps deliver verified 20% to 50%+ electricity savings while maintaining consistent crop yield and quality.
- Hardware integration: Successful deployment requires canopy-level PAR sensors, zoned control networks, and stable dimmable LED drivers with low-end dimming stability and safety compliance (ETL/CE/RoHS).
- Secondary Benefits: Reduced lighting wattage lowers internal heat gain, decreasing HVAC cooling loads and qualifying facilities for substantial utility energy efficiency rebates.
How to Pilot, Measure, and Scale Confidently
- Conduct a facility baseline audit: Sub-meter lighting panel energy consumption across existing zones for two weeks to establish baseline kWh/day metrics.
- Deploy a single-zonepilot: Retrofit one representative greenhouse bay (5,000–10,000 sq. ft.) with canopy PAR sensors, dimmable LED fixtures, and a DLI controller.
- Verify yield and energy metrics: Compare kWh consumption, accumulated DLI, and harvest weight between the pilot zone and control zones over a full crop cycle.
- Apply for Utility Rebates and Scale: Submit pilot M&V data to your local energy utility to secure custom incentives before executing full-facility rollout.
FAQ
What is the main difference between PPFD and DLI in greenhouse light management?
Photosynthetic Photon Flux Density (PPFD) measures the instantaneous light intensity hitting a square meter of canopy per second (μmol·m⁻²·s⁻¹), whereas Daily Light Integral (DLI) measures the total cumulative photons delivered over an entire 24-hour period (mol·m⁻²·d⁻¹). DLI represents the total daily light dosage that directly governs crop biomass accumulation and yield.
How much electricity can intelligent DLI control systems save compared to standard timers?
Automated DLI control systems typically reduce supplemental lighting energy consumption by 20% to over 50%. By continuously measuring natural sunlight and dynamically dimming LED fixtures to fill only the remaining photon gap, the system avoids wasting power during bright hours and caps energy draw once crop targets are achieved.
Why are dimmable LED drivers essential for dynamic DLI control?
Dynamic DLI tracking requires fixtures to adjust output continuously in response to shifting solar radiation. High-performance dimmable LED drivers (supporting 0–10V, DALI-2, or Modbus) ensure linear, flicker-free output down to low dimming levels without spectral shift. Additionally, operating LEDs in mid-range power bands increases diode efficacy and lowers junction temperatures.
Where should canopy PAR sensors be positioned inside the greenhouse?
Quantum PAR sensors must be installed directly at crop canopy level—6 to 12 inches above expanding leaves—rather than on the exterior roof or near the ridge. This positioning captures the exact light intensity reaching the crop while accounting for structural shading and glazing transmission losses.
How does DLI light control impact greenhouse HVAC and cooling loads?
Electric lighting adds sensible heat (~3,412 BTU per kWh). When intelligent DLI controllers reduce fixture power during warm midday hours, cooling and ventilation loads drop proportionally. Typically, facilities save an extra 1 kWh of cooling energy for every 3 kWh reduced in supplemental lighting draw.