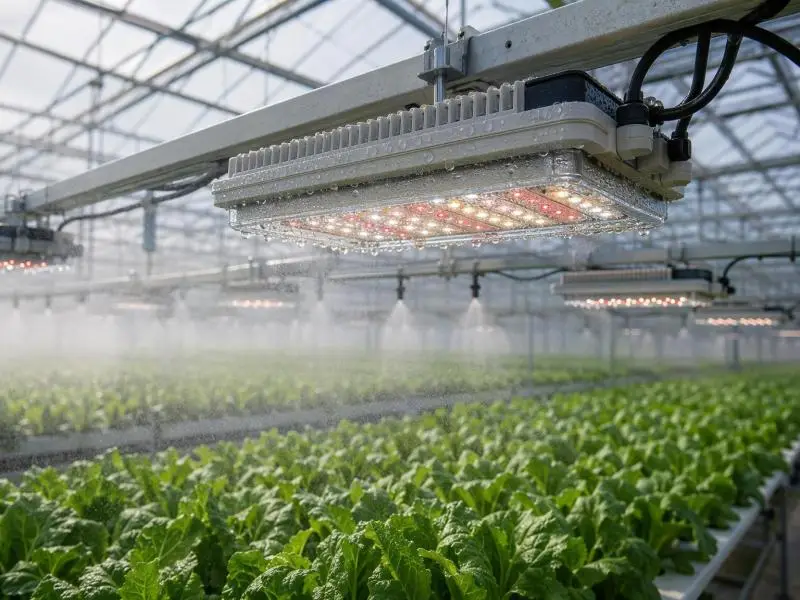
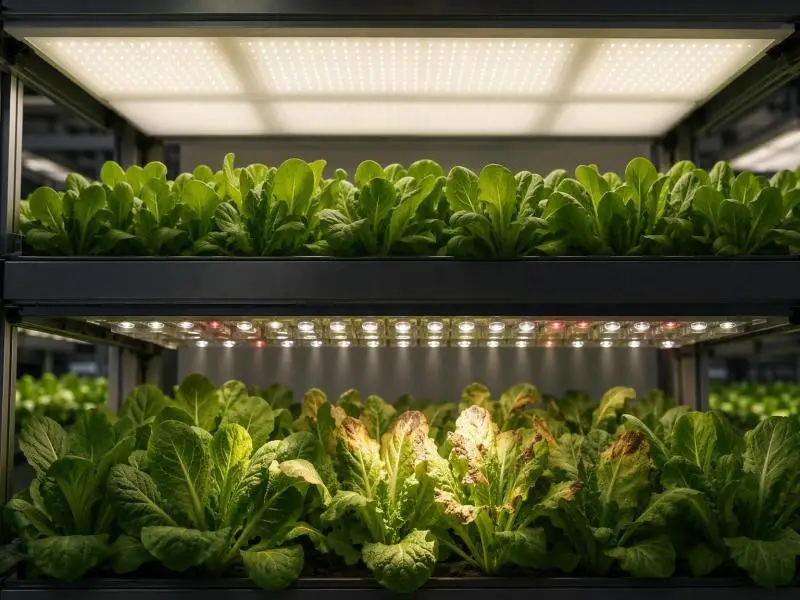
A low-ceiling rack forces a design conflict that no datasheet headline resolves. The fixture hangs perhaps 20–30 cm above the tray, and in that short throw it must still spread photons evenly across the growing area. A fixture that concentrates its output will put a disproportionate share of its energy on the leaves directly beneath it. A fixture that spreads too aggressively may lose photons past the tray edges or pay for the spread in delivered efficiency. Diffused LED grow lights and clear-lens fixtures sit at opposite ends of that trade, and neither is universally correct.
The phrase “light burn” makes the comparison harder, because growers use it for at least four different problems. Optical hotspotting from a concentrated beam is one. Tip burn — a localized calcium disorder — is another. Photo-oxidative damage from an excessive daily light integral (DLI) is a third, and simple heat damage from a fixture mounted too close is a fourth. A diffuser mainly addresses the first and partly the fourth. It cannot fix the second or third on its own, which is why optic choice has to sit alongside dimming, airflow and DLI targets rather than replace them.
What follows is a criteria-led comparison: peak PPFD (photosynthetic photon flux density) and uniformity at the actual mounting plane, the transmission cost of the optic, thermal behaviour in a shallow rack, a measurement method you can repeat, and the documentation to request before purchase. It draws on published horticultural research and optical-design guidance rather than on our own bench testing, and the verdict depends on your mounting height and fixture spacing as much as on the optic itself.
Table of Contents
Quick Comparison: Diffused Optics vs Clear Lenses at Close Range
| Criterion | Diffused / wide-beam optics | Clear narrow lenses |
|---|---|---|
| Beam character | Spreads output across a wide angle; softens the center-to-edge gradient | Concentrates output into a tighter cone under the fixture |
| Peak-to-average PPFD at short throw | Lower peak relative to average; minimum values rise | Higher peak directly beneath the fixture; steeper falloff toward tray edges |
| Transmission loss | Quality secondary optics typically lose 5–15% of emitted light (Lumistrips) | Also subject to optic losses; a bare emitter avoids them but keeps the full Lambertian spread |
| Hotspot risk at 20–30 cm | Reduced, provided LED density and module pitch give adequate beam overlap | Elevated unless fixtures are densely spaced or dimmed |
| Cleaning and fouling | Textured diffuser surfaces can trap dust and condensation; check IP rating and cleaning instructions | Smooth lens surfaces generally easier to wipe down |
| Spectral mixing | Diffusers help blend multi-channel spectra (red, blue, far-red) into a more uniform color at the canopy | Mixing depends on LED layout; channel-resolved PPFD can vary across the tray |
| Thermal exposure at the leaf | Slightly lower radiant concentration at any one point; fixture heat rejection is unchanged | Higher localized radiant load under the beam center |
| Best fit | Tight headroom, sparse fixtures, heat-sensitive or tipburn-prone crops | Generous fixture overlap, taller throw, or maximum delivered efficacy as the priority |
No row wins outright. The table describes tendencies that reverse when geometry changes: a clear lens in a densely overlapped rack can deliver acceptable uniformity, and a diffuser in a sparsely populated rack can still leave dark zones between modules.
How Should You Define “Light Burn” before Choosing an Optic?
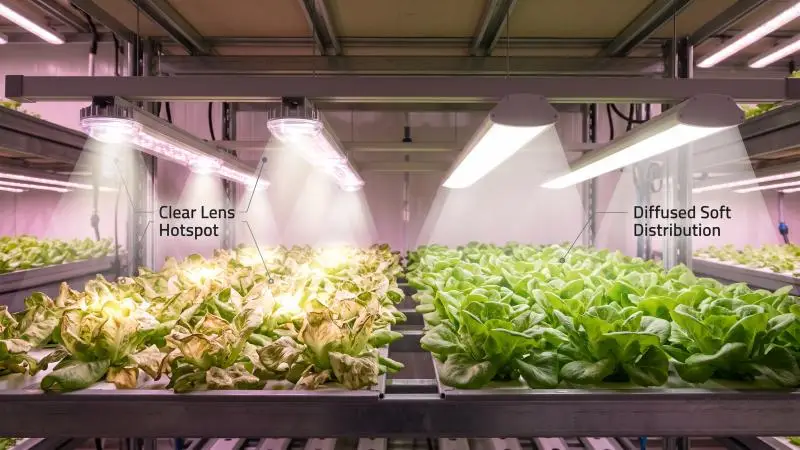
Before comparing optics, separate the symptoms. The fix differs for each, and a diffuser applied to the wrong diagnosis wastes capital and delays the real correction.
Optical overexposure and hotspotting. A concentrated beam puts a narrow column of high PPFD on a few leaves while neighboring tissue receives much less. The visible result is often a bleached or scorched patch directly under the fixture, with normal-looking growth a short distance away. This is the disorder a diffuser or wide-beam optic most directly addresses.
Tipburn. Tipburn is a physiological disorder, not a light-burn injury in the optical sense. It is characterized by browning, necrosis, and curling of leaf tips and margins, primarily affecting young leaves in the enclosed center of the head, and its underlying cause is localized calcium deficiency — calcium demand from rapid growth exceeding supply (Frontiers in Plant Science, 2025).
Calcium moves with transpiration, so conditions that limit transpiration in the growing tip can produce tipburn even at moderate light. A frequently cited controlled-environment study found the highest tipburn occurrence at 300 µmol·m⁻²·s⁻¹ combined with the lowest air velocity tested (0.25 m·s⁻¹), with incidence falling significantly as air velocity rose (Ahmed et al., 2022a, as summarized in Sheikhi et al. 2026). Light intensity and airflow interacted; neither alone told the whole story.
Bleaching and photo-oxidative damage. When the daily light integral exceeds what the crop can use, excess excitation energy drives reactive oxygen species accumulation and lipid peroxidation. A study on lettuce under continuous light concluded that photo-oxidative stress was attributable to excessive DLI rather than to circadian disruption, with stress markers rising as light intensity increased (Zha et al., 2019). This is a dose problem measured in mol·m⁻²·d⁻¹, not a beam-shape problem.
Heat damage. LED emitting surfaces run cooler than high-pressure sodium lamps, but drivers and heat sinks still reject heat into the rack. In a low-headroom compartment, heat accumulates near the canopy.
The implication for optic choice is narrow but real: a diffuser addresses hotspotting and, by spreading radiant energy, slightly reduces the peak thermal load at any one leaf. It does not correct a calcium-transport problem, an excessive DLI, or inadequate air exchange. Those require airflow, calcium management, dimming, and photoperiod control.
Peak PPFD and Uniformity at Your Actual Mounting Height
A center-point PPFD reading and a bare PPF (photosynthetic photon flux) figure describe different things, and neither tells you what a plant receives at short throw. PPF, in µmol·s⁻¹, is a property of the luminaire: the total photosynthetically active photons it emits per second, regardless of destination. PPFD is what actually lands on a square meter of canopy. A luminaire specification quoting only PPF without PPFD at defined mounting heights and spacings is incomplete for installation planning (Lumistrips).
The underlying physics explains why close mounting changes the picture. LED packages approximate Lambertian emitters: intensity peaks at nadir and falls off with the cosine of the angle, so a row of LEDs produces overlapping cosine lobes — a hot stripe under each fixture and rapid falloff toward the tray edges (Lumistrips optical-design guide).
Much of that oblique output radiates beyond the growing area. As the fixture-to-canopy distance shrinks, the fraction of the beam that lands on the tray rises, which is the basis of the close-canopy lighting strategy: reducing separation distance improves canopy photon capture efficiency, the fraction of emitted photons actually incident on foliar canopies (Sheibani et al., 2023).
But close mounting also compresses the gradient. At 20–30 cm, the difference in distance from the fixture center to a point directly below versus a point 15 cm off-axis is proportionally much larger than at 60 cm. That is why a concentrated beam produces a sharper peak at short throw, and why diffusers and wide-beam secondary optics — which spread intensity across a wider angle — raise the minimum values and reduce the peak-to-average ratio. Clear narrow lenses do the opposite: they concentrate output, which suits long-throw greenhouse top-lighting where a tight beam maintains useful PPFD across a large canopy from 3–5 m up.
One caveat from the close-canopy research deserves emphasis. In preliminary testing, spectroradiometer readings showed that individual LEDs were spaced too widely to provide adequate beam overlap at closer separation distances, producing non-uniform growth within trays. The researchers noted that not all LED arrays currently used at standard 40–50 cm separation may work for close-canopy advantages without redesign of lamps, supports, and benches (Sheibani et al., 2023). A diffuser cannot compensate for an array whose diode pitch is too coarse for the mounting height.
What Diffused LED Grow Lights Cost You in Transmission
Every optical element in the light path absorbs some photons. Quality secondary lenses and reflectors typically introduce transmission losses in the range of 5–15%, depending on material, geometry, and the number of optical surfaces (Lumistrips). The same source illustrates the arithmetic: a luminaire with a system photosynthetic photon efficacy (PPE) of 3.0 µmol·J⁻¹ before optics may deliver effectively 2.6–2.85 µmol·J⁻¹ to the canopy after a secondary lens is added.
That loss is a fixed energy penalty. It applies whether or not the uniformity gain is worth having. The gain, by contrast, is scenario-dependent. It is largest where headroom is tight, and fixture spacing is sparse, because those are the conditions that produce the steepest peak-to-average gradient in the first place. It is smallest where fixtures already overlap heavily, since overlapping bare emitters sum toward a flatter distribution on their own.
This asymmetry is why the decision should be framed as delivered uniformity per watt at the canopy, not as raw fixture efficacy. A fixture quoting a high pre-optic PPE and a narrow beam may deliver a lower minimum PPFD across the tray than a slightly less efficient diffused fixture, and the plants at the tray edges will grow and mature on a different schedule.
The economic consequence of poor uniformity — lower output per unit energy, non-uniform maturity, sorting losses at harvest — is diffuse and hard to attribute to the lighting design in routine operations, which is precisely why it tends to be undervalued in procurement (Lumistrips optical-design guide).
A practical way to weigh it: calculate the delivered PPE after optics for each candidate, then compare the minimum PPFD each achieves at your actual mounting height and module pitch. If the diffused option’s minimum is materially higher and its delivered PPE is within a few percent, the transmission tax is buying something. If the clear-lens option already achieves an acceptable minimum because your fixtures overlap, the tax buys little.
Measurement: Grid, Sensor and Reference Plane
Uniformity claims are only as good as the measurement behind them, and several common errors inflate or distort PPFD readings in ways that matter at short throw.
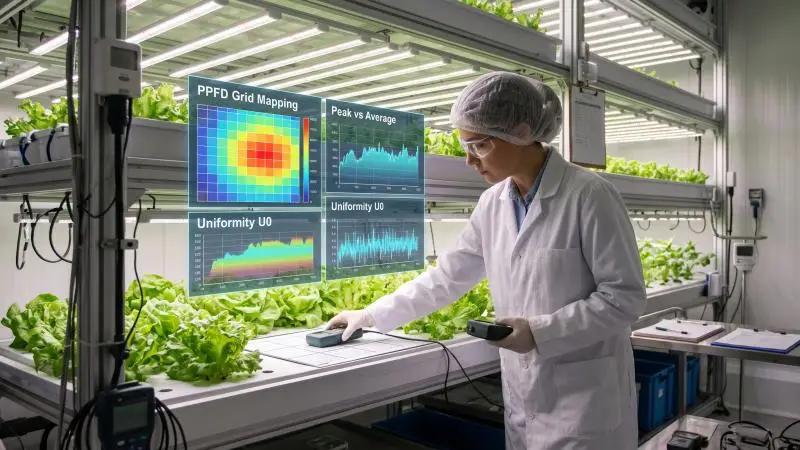
Sensor. Use a calibrated quantum sensor with a flat spectral response across 400–700 nm. Standard silicon photodiodes give incorrect readings under narrow-band LED spectra because of their wavelength-dependent response; a spectrally corrected sensor is required (Lumistrips). A broadband lux meter is the wrong instrument entirely under red-dominant spectra, where it over-reads relative to PPFD.
Grid and reference plane. Measure at the design plane — the height of the canopy you are designing for, not the height of the empty tray if the crop will grow toward the fixture. State the grid density explicitly: a practical approach is a grid across the tray at intervals fine enough to catch the gradient between fixtures, with readings at tray center, under each fixture, and at the tray edges.
Report minimum, average, and maximum PPFD plus a uniformity ratio (minimum divided by average, often written U0) or coefficient of variation. Average alone hides the problem: a room at 400 µmol·m⁻²·s⁻¹ average with a 20% hotspot grows crops of inconsistent quality, because plants under the hotspot and plants at the edge experience different light integrals and mature on different schedules (PPFD mapping guidance).
Common errors. Measuring at a height different from the design plane makes PPFD appear higher or lower than design. Ignoring mutual illumination between benches causes measured values at tray edges to exceed prediction, because light from neighboring fixtures contributes. Leaving far-red channels out of the reporting obscures morphology differences with no PPFD explanation.
Repeat as the canopy grows. With fixed tier heights, the canopy-to-fixture distance shrinks as the crop grows, so PPFD at leaf level rises through the cycle. A design targeting 400 µmol·m⁻²·s⁻¹ at transplant distance may over-deliver by 20–30% at maturity unless the luminaires are dimmed or raised (PPFD mapping guidance). Modern installations handle this with a dimming schedule that follows the crop cycle. Repeat the grid measurement at two or three points in the cycle to confirm the schedule is holding peak PPFD inside tolerance.
Dimming, Spacing and Photoperiod at Close Distance
Once the optic is chosen, peak PPFD is controlled by three levers: dimming, fixture spacing, and photoperiod.
The arithmetic that connects them is straightforward. DLI equals PPFD multiplied by the photoperiod in seconds, converted to moles: a fixture delivering 200 µmol·m⁻²·s⁻¹ for 16 hours (57,600 seconds) supplies 11.52 mol·m⁻²·d⁻¹. The same daily dose can be delivered at 150 µmol·m⁻²·s⁻¹ over roughly 21.3 hours, or at 250 µmol·m⁻²·s⁻¹ over about 12.8 hours. Lower PPFD with a longer photoperiod holds the dose while cutting the peak intensity that any one leaf experiences — which is the relevant variable for hotspotting and for photo-oxidative stress at the leaf surface.
Published ranges give a starting point, not a prescription. For lettuce, the optimal DLI typically falls between 12 and 16 mol·m⁻²·d⁻¹ depending on genotype, and studies have identified an ideal PPFD range of roughly 150–300 µmol·m⁻²·s⁻¹ under artificial lighting, with higher values potentially beneficial depending on cultivar and conditions (Frontiers in Plant Science, 2026).
Exceeding that range may trigger photoprotective responses that dissipate energy as heat, reducing photosynthetic efficiency and biomass accumulation. A separate study on iceberg lettuce in a vertical hydroponic system recommended 11.5 mol·m⁻²·d⁻¹, noting that 14.4 mol·m⁻²·d⁻¹ had a negative impact on fresh weight, dry weight, and leaf area (Gavhane et al., 2023). Optima vary by cultivar, so treat these as brackets to test within.
Fixture spacing and overlap are the levers for uniformity. Where modules are spaced widely, the gap between them shows up as a trough in the PPFD map regardless of optic; adding fixtures or reducing pitch raises the minimum. Dimming is the lever for peak control: it scales the whole distribution down without changing its shape, so it cannot fix a uniformity problem, but it can keep the peak inside tolerance once uniformity is acceptable.
One finding worth noting for energy planning: under a constant DLI, photoperiod manipulation by adjusting PPFD had limited impact on lettuce physiology across a wide range of combinations, while continuous lighting improved energy use efficiency and reduced lighting cost per unit of biomass (Frontiers in Plant Science, 2026). That does not make 24-hour lighting a universal recommendation — cultivar and quality targets still govern — but it does mean the photoperiod lever is worth modeling rather than assuming.
Heat, Airflow and the Disorders A Diffuser Cannot Fix
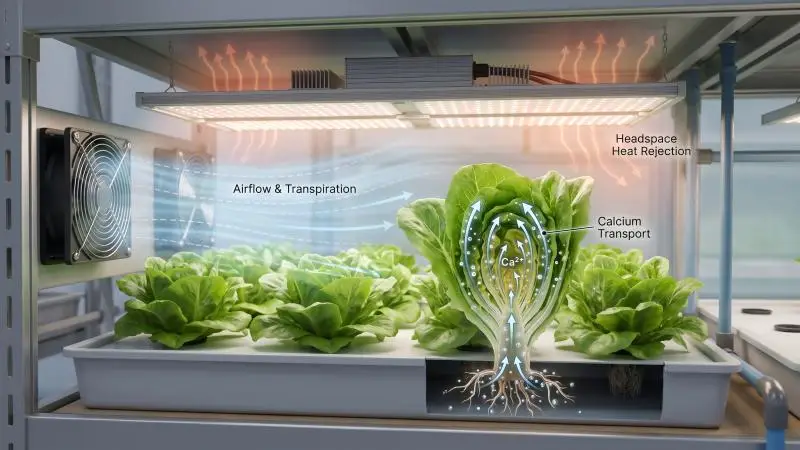
A diffuser changes the optics. It does not change the thermal or physiological conditions in the rack, and conflating the two leads to the wrong fix.
On the thermal side, LED emitting surfaces run cooler than high-pressure sodium lamps, which is what makes close mounting physically possible without scorching tissue. But the fixture still rejects heat — from the drivers and from the heat sinks — into the growth compartment. In a low-headroom rack with limited air exchange, that heat accumulates near the canopy. A diffuser spreads radiant energy across a wider area, which slightly reduces the peak radiant load at any one leaf, but it does nothing about convective heat building in the headspace.
On the physiological side, restricted airflow near the canopy is associated with higher tipburn incidence. In the controlled-environment study cited earlier, tipburn occurrence was highest at the combination of high light intensity (300 µmol·m⁻²·s⁻¹) and low air velocity (0.25 m·s⁻¹), and decreased significantly as air velocity increased (Ahmed et al., 2022a, as summarized in Sheikhi et al. 2026). Air movement supports transpiration, and transpiration is what carries calcium to the young, enclosed leaves where tip burn develops. A diffused beam does not move air.
Calcium management is a separate lever. A greenhouse study on deep-water-culture lettuce found that a calcium-mobilizing biostimulant added to the nutrient solution reduced tip burn comparably to vertical airflow fans, with inner-leaf calcium concentrations increasing under biostimulant application and correlating inversely with tip burn severity (Frontiers in Plant Science, 2025). Foliar calcium chloride is another established route, though it requires frequent application and carries phytotoxicity risk if mishandled. None of these are lighting decisions.
DLI control is the third separate lever. Photo-oxidative damage from excessive daily light integral is a dose problem, and the correction is to reduce the dose — through dimming, photoperiod or both — not to change the beam shape.
The practical consequence: if you see tip burn in a low-ceiling rack, check airflow, calcium delivery, and DLI before concluding the optic is at fault. Misdiagnosing tip burn as light burn leads to a diffuser purchase that leaves the disorder in place.
Documents to Request before You Buy
A fixture that quotes only PPF without installation geometry is incomplete for planning. The following documents let you compare candidates on the criteria that actually determine performance at short throw.
- Goniophotometric PPID data and spectral quantum distribution (SQD). Under the DLC Horticultural Lighting Program, TM-33 .xml documents must contain photosynthetic photon intensity distribution (PPID) data produced by goniophotometric testing per ANSI/IES LM-79-19, and SQD data measured in an integrating sphere per the same standard (DLC Horticultural Lighting FAQ). Ask for the TM-33 file, not a marketing polar plot.
- PPFD maps at stated mounting heights and spacings. Request maps at your actual fixture-to-canopy distance and module pitch, with minimum, average, maximum, and a uniformity ratio or CV. A single average figure is not enough.
- Delivered efficacy after optics. Ask for system PPE after all optical elements, not the pre-optic LED figure. This is the number that determines energy cost per delivered photon.
- Thermal data at the intended dimming level. Driver and heat-sink temperatures at the dim level you will actually run, since a low-ceiling rack may operate dimmed for much of the cycle.
- IP rating and cleaning instructions. Relevant for diffuser surfaces, which can trap dust and condensation in a humid rack.
- Warranty terms. The DLC expects warranted products to be covered for a minimum of five years when used as directed; compare that benchmark against the manufacturer’s terms (DLC Horticultural Lighting FAQ).
- Channel-resolved PPFD where multi-channel spectra are involved. A fixture that appears uniform in lux because it includes enough white light to move a photometer may be deeply non-uniform in the red and far-red bands that drive photosynthesis (Lumistrips optical-design guide).
Who Should Choose Which
The decision rules below follow from the geometry, not from a product hierarchy.
Choose diffused or wide-beam optics when: headroom is tight (roughly 20–30 cm), fixtures are spaced sparsely relative to the tray width, the crop is heat-sensitive or tipburn-prone, or the spectrum is multi-channel and color mixing at the canopy matters. In these conditions, the peak-to-average gradient is steep, and the transmission tax buys a materially higher minimum PPFD across the tray.
Clear narrow lenses may win when: fixtures already overlap heavily, the throw is taller (greenhouse top-lighting at 3–5 m is the classic case), or maximum delivered efficacy is the priority, and the PPFD map shows acceptable uniformity without diffusion. A narrow beam concentrates output where it is needed across a large canopy from height; at short throw in a sparse rack, the same concentration becomes a liability.
Mixed facilities should specify per rack zone, not per site. A propagation room with dense trays and low headroom has different optics requirements from a finishing zone with taller clearance. Specifying one fixture across the whole facility forces a compromise that is wrong somewhere.
Whichever route you take, the optic is one variable among several. Dimming controls peak intensity, spacing controls uniformity, airflow controls transpiration and tip burn risk, and DLI targets control the daily dose. A diffuser that is not paired with adequate airflow and a sensible dimming schedule will not prevent the disorders it is sometimes expected to solve.
Verdict: Matching the Optic to the Rack, Not to A Category
| Criterion | Winner |
|---|---|
| Uniformity at 20–30 cm with sparse fixtures | Diffused / wide-beam optics |
| Delivered efficacy per watt | Clear lenses or bare emitters, where uniformity is already acceptable |
| Hotspot risk at short throw | Diffused / wide-beam optics |
| Long-throw coverage from height | Clear narrow lenses |
| Ease of cleaning | Clear lenses, generally |
| Spectral mixing across channels | Diffused optics, generally |
| Tipburn and photo-oxidative control | Neither — airflow, calcium management and DLI control govern |
The decision rule is geometric. Diffusers buy uniformity with a transmission tax of roughly 5–15%, and that trade only pays where the geometry makes hotspots likely: tight headroom, sparse fixture spacing, heat-sensitive crops. Where fixtures already overlap, or the throw is tall, the tax buys little, and a clear lens may deliver more photons per watt to a canopy that is already evenly lit.
Before committing, request the PPFD map at your actual mounting height and module pitch, compare delivered efficacy after optics, and measure the installed result on a grid rather than trusting a center-point reading. Then set dimming, spacing, airflow, and DLI targets around the optic, because those are the variables that determine whether the crop experiences the light as a uniform dose or as a series of peaks.
FAQ
How do I tell light burn from tipburn and bleaching?
Location and pattern are the first clues. Optical hotspotting tends to produce damage directly under the fixture, with a sharp boundary and normal tissue a short distance away. Tipburn affects the young, enclosed leaves at the center of the head — browning, necrosis, and curling of leaf margins — and is a calcium-transport disorder, not an optical injury (Frontiers in Plant Science, 2025). Bleaching is associated with excessive DLI, with photo-oxidative stress rising as light intensity increases (Zha et al., 2019). Where the diagnosis is ambiguous, an agronomist or lab tissue analysis can confirm calcium status; the light measurements described above can confirm whether peak PPFD or DLI is out of range.
Can I mix diffused and clear fixtures in one room?
Physically, yes, but the PPFD map becomes harder to predict because the two beam profiles sum differently across the tray. If you mix them, measure the combined installation on a grid rather than adding the two suppliers’ individual maps, and check that the transition zone between fixture types does not create a uniformity trough. Specifying per rack zone — diffused in the low-headroom racks, clear lenses where clearance is greater — is usually cleaner than alternating fixture types within a single tray.
Does a diffuser alone prevent burn at very short distance?
No. A diffuser reduces the peak concentration of radiant energy, which lowers hotspot risk, but it does not control DLI, does not move air, and does not manage calcium. At very short distances, the canopy also grows toward the fixture, so PPFD at leaf level rises through the cycle unless the luminaires are dimmed or raised (PPFD mapping guidance). A diffuser is one element of a control strategy, not a substitute for it.
How do I compare two suppliers’ PPFD maps fairly?
Check four things before comparing numbers: the mounting height, the fixture spacing, the reference plane, and whether the map reports minimum and uniformity alongside average. Maps generated at different heights or spacings are not comparable, and a map reporting only average hides the gradient that matters. Where possible, ask for the underlying TM-33 data and confirm the measurement followed ANSI/IES LM-79-19 conventions (DLC Horticultural Lighting FAQ). If a supplier cannot state the conditions behind a map, treat the map as illustrative rather than as a design input.