Introduction
A plant under a lamp is not simply eating light; it is reading it. Photosynthesis converts photons into sugar, but a separate set of photoreceptors converts photons into instructions, driving the intricate processes of light phytohormone regulation. The first recipients of those instructions are the hormones that decide whether a stem extends, a leaf flattens, or a bud stays dormant. Auxin and gibberellin (GA) are the two levers this article follows. Light does not merely supply the energy for their effects; it rewrites the message they carry.
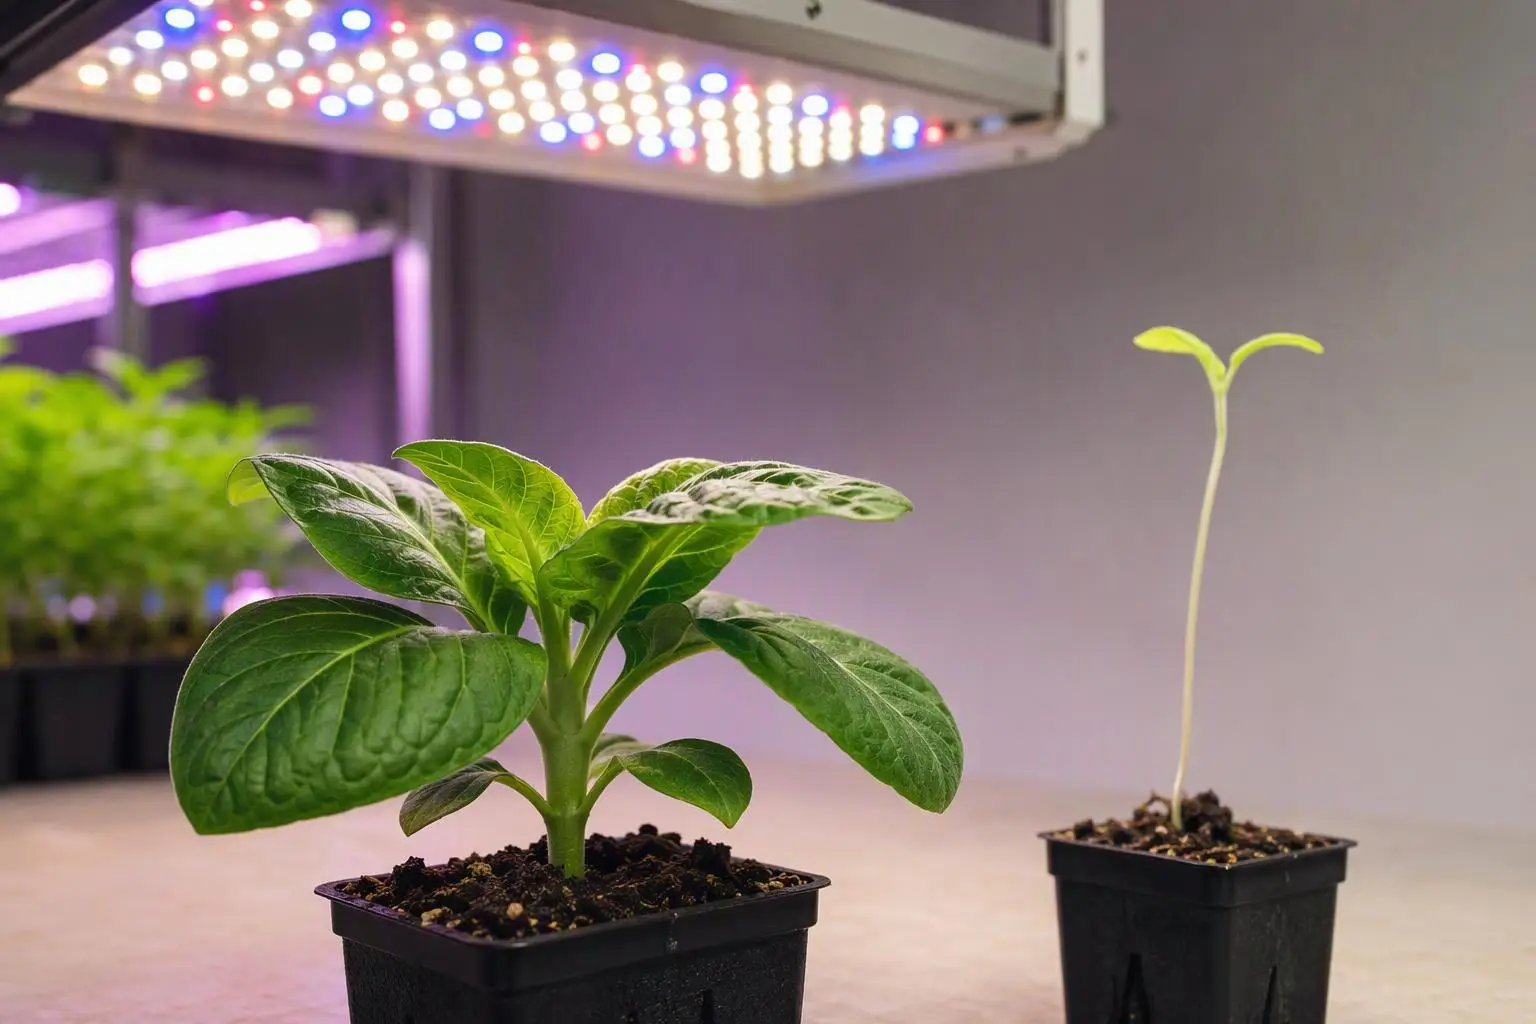
The practical consequence is that two fixtures delivering the same photosynthetic photon flux density (PPFD) can produce compact, well-branched plants or stretched, spindly ones. The difference lies in spectrum, geometry and timing — the red to far-red ratio a leaf actually sees, the direction the beam arrives from, and the hour at which it arrives. What follows traces the chain of light phytohormone regulation from photoreceptor to hormone to morphology, then converts it into a diagnostic sequence for a cultivation or procurement decision. The progression runs: photoreceptors, auxin, GA and DELLA, shade avoidance, the distinction between hormone concentration and sensitivity, a four-variable diagnostic framework, and finally what a specification sheet can and cannot tell you.
Table of Contents
The Signal Before the Hormone: Initiating Light Phytohormone Regulation
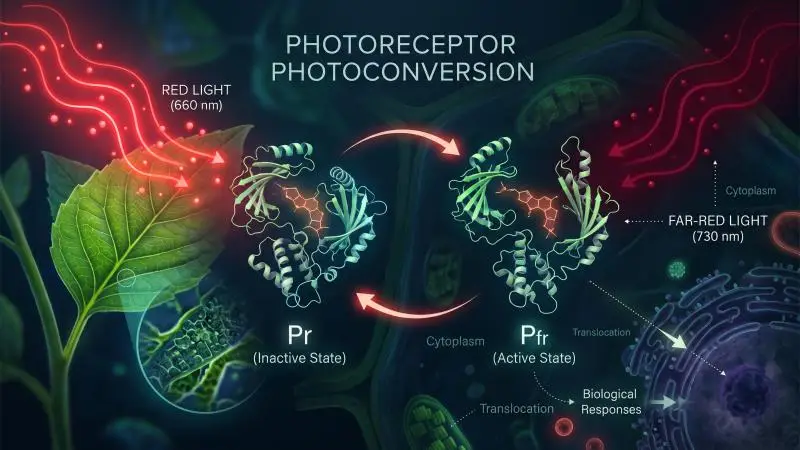
Phytochromes are the most extensively studied plant photoreceptors. They are dimeric chromoproteins, each monomer carrying a covalently linked phytochromobilin chromophore, and they exist in two photo-reversible forms: a red-absorbing Pr form and a far-red-absorbing Pfr form, with Pfr generally treated as the biologically active state. In Arabidopsis, five genes encode the family, PHYA through PHYE; phyA is classified as a light-labile type I phytochrome, while phyB through phyE are relatively light-stable type II phytochromes (phytochrome signalling review).
R: FR and PSS are different metrics measured under different conditions. R: FR is a spectral photon ratio whose value depends on the waveband definition used (Both et al. recommend 640–680 nm ÷ 710–750 nm); PSS is a calculated equilibrium proportion of Pfr. The canopy values are single reported cases (sugar-beet canopy for R: FR; a closed plant canopy for PSS), not ranges, and the two canopy figures come from different sources. Sunlight R: FR at the start and end of the photoperiod (≈0.6) is shown for context; no PSS value was reported for that condition.
In darkness, phytochromes are biosynthesised as inactive Pr and accumulate in the cytoplasm. Light drives the conformational change to Pfr, and that conformational change is the first step in signalling. Phytochromes are not the only input: cryptochromes handle the blue arm and UVR8 the UV-B arm, and all three feed the same downstream network of transcription factors (shade-avoidance review).
The key point for a grower is what the system measures. The phytochrome photostationary state (PSS) — the equilibrium proportion of Pfr — tracks the spectral composition of the incident light, and is strongly correlated with the red to far-red (R: FR) proportion rather than with absolute photon count (Demotes-Mainard et al., 2016). A plant is not measuring brightness. It is measuring ratio and direction, and handing that measurement to the hormone system.
Phytochrome Photoconversion and the R: FR Ratio
The reported values are worth having on hand, provided they are read as observations from specific conditions rather than universal constants. In sunlight, the R: FR ratio is about 0.6 at the beginning and end of the photoperiod and about 1.0 to 1.3 at solar noon; it varies only slightly with cloud cover and is little sensitive to season. Under a canopy it collapses — the Demotes-Mainard review cites 0.033 under a sugar-beet canopy (Demotes-Mainard et al., 2016).
Calculated PSS values follow the same gradient: about 0.7 for midday sunlight, falling to about 0.1 under a closed plant canopy, and extension growth generally increases as PSS decreases (Both et al., 2017). The reason this matters disproportionately is that within canopy-range ratios, slight R: FR variation causes large variation in phytochrome photoequilibrium. Near the bottom of the range, a small spectral change moves the switch a long way.
Why Direction is A Separate Channel from Quantity
Phototropism proves that light carries spatial information as well as spectral information. In Arabidopsis hypocotyl endodermis cells, light represses transcription of the PINOID (PID) kinase; PIN3, the auxin efflux carrier, is then polarised specifically to the inner cell sides by GNOM ARF-GEF-dependent trafficking. Differential trafficking between the shaded and illuminated sides aligns PIN3 polarity with the light direction and, the authors propose, redirects auxin flow toward the shaded flank, where auxin promotes growth, bending the hypocotyl toward the light (Ding et al., Nature Cell Biology).
The Plants review is candid that the exact mechanisms linking photoreceptor signalling to PIN localisation remain uncertain, and that PIN polarisation is a constant trafficking process influenced by gravity, temperature and salinity as well as light (photoreceptor–auxin review). The practical reading is nonetheless robust: a fixture’s position and beam angle change hormone distribution independently of its spectrum. Geometry is a hormone input.
Auxin: How Light Rewrites Synthesis, Transport and Sensitivity
Auxin is the hormone most directly re-scripted by light, and the literature organises the effect at three levels: biosynthesis, conjugation and transport, and signalling (photoreceptor–auxin review). The biosynthetic route runs from tryptophan to indole-pyruvic acid (IPyA) via TAA1 and TAR proteins, then to active indole-3-acetic acid (IAA) via YUCCA (YUC) flavin monooxygenases, with the YUC step rate-limiting. PIF transcription factors regulate YUC expression. Because light acts on all three levels at once, a single “auxin level” reading is a poor summary of what the plant is doing.
Biosynthesis and the PIF–YUC Axis
In shade or low R: FR, phyB is driven toward its inactive Pr form, releasing PIF7, PIF4 and PIF5 from suppression. Activated PIFs promote shade-induced growth gene expression, and PIF7’s transcriptional regulation of YUCCA links photoperception to auxin biosynthesis. Shade-stimulated free IAA is blunted in taa1 mutants, and pif7 mutants confirm that auxin production through the TAA1–YUC pathway is required to initiate shade avoidance in seedlings (shade-avoidance review).
One nuance is easy to miss and matters for interpretation: although taa1 was identified in a shade-avoidance mutant screen, TAA1 and TAR expression are not typically stimulated by low R: FR (photoreceptor–auxin review). The transcriptional lever sits mainly at YUC. These findings come from Arabidopsis seedlings; the specific gene-level pattern should not be assumed identical across species or life stages.
Transport: PIN Polarization and Long-Distance Movement
Shade-induced hypocotyl elongation is a plumbing problem at canopy scale. Tissue-level measurement in Brassica rapa seedlings suggests auxin is generated in the cotyledons and transported to the hypocotyl; the auxin transport inhibitor NPA abolishes shade-induced hypocotyl elongation entirely, and pin3 mutants show impaired response (shade-avoidance review).
Phototropic bending is a different scale of problem. The Plants review describes it as regulated by auxin transport and signalling across only a few cell layers, while shade-induced hypocotyl elongation and petiole hyponasty depend on long-distance transport from the cotyledon and leaf tip, respectively (photoreceptor–auxin review). Canopy-scale shade responses are plumbing; directional bending is a local valve. A lighting layout affects each differently — a uniform overhead array can still produce asymmetric bending if one flank is brighter, while a genuinely uniform canopy removes the directional cue but not the ratio cue.
Signalling: TIR1/AFB, Aux/IAA and the Sensitivity Shift
In the nucleus, IAA binds the TIR1/AFB receptors of the SCF^TIR1/AFB^ complex; ubiquitination of Aux/IAA repressor proteins follows, and their degradation frees the ARF transcription factors to act (photoreceptor–auxin review).
Here is the correction that should travel with any discussion of auxin and shade: the shade-induced rise in auxin is often transient, lost by the second day of treatment, and a subsequent increase in auxin sensitivity is required to maintain signalling under prolonged low R: FR (photoreceptor–auxin review). Growth continues after the concentration has fallen. This is developed further in the section on concentration versus sensitivity, but it belongs here as a flag.
There is also a brake built into the same photoreceptor family. Unlike phyB, phyA is stabilised in deep shade and represses excessive auxin-induced gene expression and hypocotyl elongation; in deep shade, strong phyA activity can outcompete TIR1 for Aux/IAA binding (photoreceptor–auxin review). The same family of photoreceptors pushes and pulls.
Gibberellin and DELLA: The Growth Brake That Light Sets
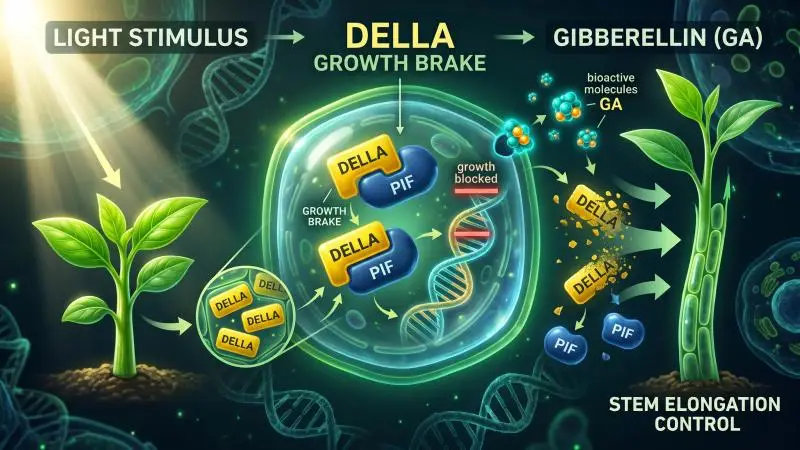
Gibberellin is the second lever, and DELLA proteins are the brake worth visualising. Bioactive GA leads to proteasomal degradation of DELLA proteins; DELLAs lack direct DNA-binding capability and act as direct interactors of PIFs, and their binding prevents PIF proteins from binding DNA, negatively regulating cell-elongation genes (shade-avoidance review; Feng et al., Nature).
The light connection is specific: light inhibition of Arabidopsis hypocotyl growth is in part dependent on the DELLAs; light activation of phytochromes promotes DELLA accumulation, and a GFP-tagged DELLA (GFP-RGA) accumulates in elongating cells of light-grown but not dark-grown hypocotyls (Achard et al., Plant Physiology). Light raises the brake by lowering bioactive GA.
GA Metabolism Under Light: GA20ox, GA3ox and GA2ox
Bioactive GA levels rise with transcripts encoding GA 20-oxidase (GA20ox) and GA 3-oxidase (GA3ox), which catalyse successive synthesis steps, and fall with transcripts encoding GA 2-oxidase (GA2ox), which deactivates bioactive GA. In the Achard study’s Arabidopsis seedlings, continuous-light-grown hypocotyls contained relatively high GA2ox transcripts (particularly GA2ox1) and accumulated relatively low bioactive GA, while dark-grown hypocotyls combined high GA20ox and low GA2ox activity to accumulate bioactive GA and target DELLAs for destruction. Transferring seedlings from dark to light produced pronounced GA2ox1 accumulation within one hour, alongside decreased GA5 and GA4 transcripts (Achard et al.).
That transcript pattern belongs to this study and its Arabidopsis seedling context; it should not be generalised to all species or life stages. And it runs in the opposite direction from the shade response: low R: FR increases GA synthesis through enhanced GA20-OXIDASE transcription (photoreceptor–auxin review). Continuous light and low R: FR are different cues, read differently.
DELLA as the Integration Node
DELLA is where GA status and light status meet, because it binds the same PIFs that light regulates. Two findings anchor this. The GA-insensitive gai gain-of-function mutant, which carries a stable DELLA protein, shows reduced shade avoidance, indicating that DELLA proteins constrain the response (shade-avoidance review). And light-induced growth inhibition is reduced in DELLA-deficient hypocotyls (Achard et al.).
There is a circadian layer on top. GID1a and GID1b mRNA levels are very low at dawn; DELLA protein levels are lowest at night, rise just after dawn as GID1 levels decrease, and are highest in the light; PIF4 and PIF5 protein levels are highest at the end of the night, when seedlings show their fastest growth rate (DELLA review). The same hormone dose lands differently depending on when it arrives. GA is not a growth promoter to be maximised; it is what the plant spends to release a brake that light keeps applying.
Shade Avoidance: When Low R: FR Tells the Plant to Stretch
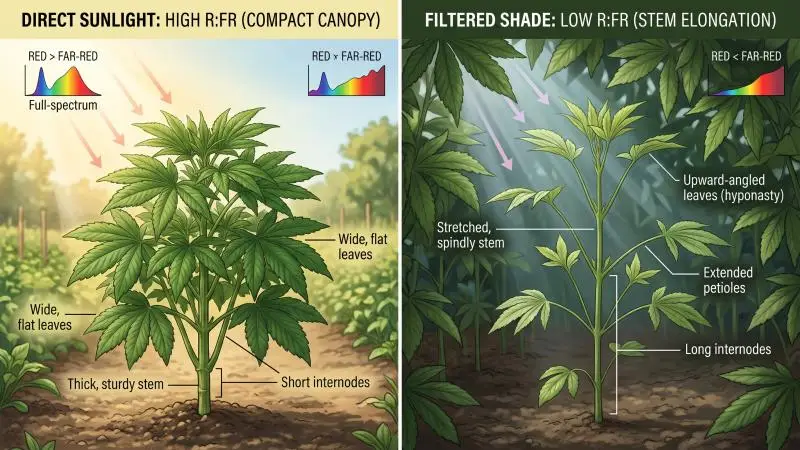
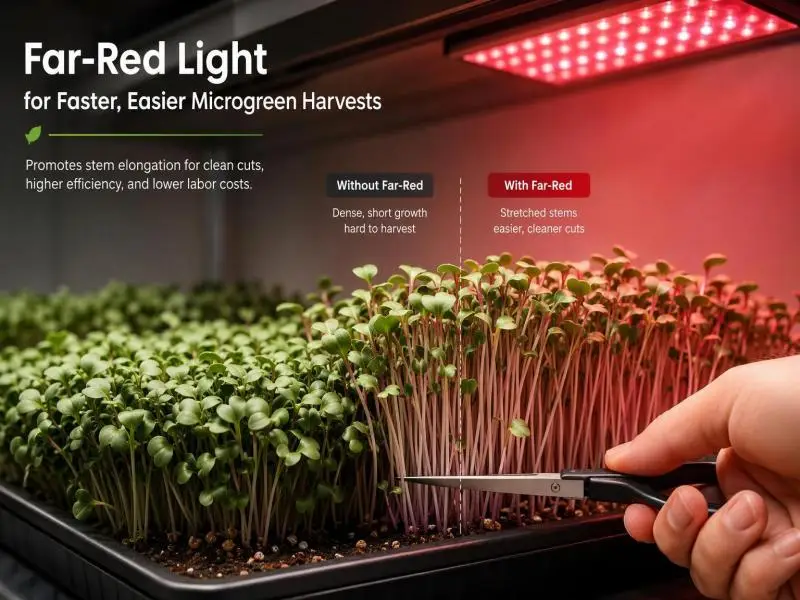
Shade avoidance syndrome is the commercially consequential synthesis of everything above. At high vegetation density, shade-intolerant plants sense a reduction in the red to far-red ratio in addition to a general reduction in light intensity. The morphological suite includes leaf hyponasty, increased hypocotyl and internode elongation, and extended petioles; prolonged shade exposure leads to early flowering, less branching, increased susceptibility to insect herbivory, and decreased seed yield (shade-avoidance review).
The trigger is spectral as much as energetic. Phytochromes, cryptochromes, and UVR8 monitor the changes, with phyB playing the dominant role in inhibiting the response — the constitutive shade-avoidance phenotype of Arabidopsis phyB mutants makes the point. High R: FR establishes a high proportion of phyB Pfr, which interacts with PIFs and triggers their phosphorylation, ubiquitination and degradation; low R: FR drives Pfr-to-Pr conversion and releases that suppression.
Which Hormones Carry the Elongation Signal
PIF-governed modulation of auxin biosynthesis, transporter and signalling genes is the major driver of shade-induced hypocotyl elongation. But auxin is not sufficient on its own: gibberellins, brassinosteroids and ethylene are also required for shade-induced hypocotyl or petiole elongation. In leaves, accumulated auxin stimulates cytokinin oxidase expression to break down cytokinins and inhibit leaf growth; in young buds, shade promotes abscisic acid accumulation to repress branching (shade-avoidance review).
The wording matters: these hormones are required for the full response, not sufficient to produce it individually. Because multiple pathways are required, a product that manipulates one of them rarely reproduces or fully suppresses the whole syndrome.
Why the Response is Adaptive but Costly in A Canopy
Elongation is a race to escape canopy shade. In nature, it works. In cultivation, it trades stem for harvestable tissue, and the review’s observation that prolonged shade reduces branching and yield is the commercial translation. The response is triggered by spectral ratio rather than by photosynthetically active radiation (PAR) alone.
Connect this to the PSS numbers. A canopy at R: FR 0.033 sits deep in the range where slight ratio changes swing phytochrome photoequilibrium sharply, which is why dense canopies produce strong stretching even when total light remains adequate. The plant is not short of photons. It is short of red relative to far-red, and it is behaving accordingly.
Concentration Is Not the Message: Why Hormone Levels Mislead
Hormone concentration alone is an unreliable predictor of growth response, because the plant regulates sensitivity in parallel with level.
The clearest evidence is the shade response itself. Auxin concentrations increase rapidly in shade and at elevated temperature, but the increase is often transient and lost on the second day of treatment; a subsequent increase in auxin sensitivity is required to maintain auxin signalling for a longer duration in low R: FR (photoreceptor–auxin review). Growth continues after the concentration has returned toward baseline. A measurement taken on day three would miss the event that started the response.
The receptor system explains part of the variability. AUX/IAA degradation rates and TIR1/AFB–Aux/IAA affinities vary widely, so the same IAA concentration produces different signalling output depending on tissue and receptor complement. The relationship is not even monotonic: in pea, natural IAA produces a biphasic dose-response curve with maxima in the 1 μM and 1 mM ranges, while the synthetic auxin NAA shows only a single maximum around 10 μM (auxin review).
The diagnostic implication is blunt. A tissue test reporting a hormone number without light history, tissue type, and sampling time cannot tell you why a plant is stretching. The number is one input; the light record is the other, and the second is usually the one missing from the file.
A Diagnostic Framework: Separating Spectrum, Intensity, Duration and Direction
The four light variables — spectrum, intensity, duration and direction — are separable in principle, and a crop response should be attributed to one only after the others have been held or ruled out. What follows is reasoning from the mechanisms above, not a validated protocol.
Step 1 — Fix the Geometry Before Touching the Spectrum
Direction and distance come first because they change the hormone signal through phototropism and through the R: FR a plant actually sees at each leaf, independent of the fixture’s spectrum. Measure at canopy height rather than at the fixture. Check for asymmetric light on one flank. Confirm that a stretching crop is not simply reaching toward a stronger side — phototropic bending and shade-avoidance elongation can look similar in a photograph and have different causes.
Step 2 — Separate Ratio from Dose
R: FR and PPFD are different measurements. A fixture can deliver high PPFD with a low R: FR, or the reverse. The Demotes-Mainard review treats R: FR as the ratio of spectral photon flux in the red and far-red bands — a spectral measurement, not an intensity one (Demotes-Mainard et al.). Record both, plus photoperiod, so that a shade-avoidance diagnosis is not confused with a low-light diagnosis. They call for different corrections.
Step 3 — Separate Duration and Timing from Instantaneous Conditions
The circadian evidence argues that when a treatment is applied matters as much as what is applied: GID1 is low at dawn, DELLA protein peaks in the light, and PIF4/PIF5 peak at the end of night (DELLA review). End-of-day far-red and a morning spectrum are different interventions and should be logged separately. Because the cited work is in Arabidopsis, treat this as hypothesis-generating for a commercial crop rather than as an established schedule.
Step 4 — Change One Variable and Watch the Right Tissue
Choose an outcome measure that matches the mechanism. Internode length and leaf angle for shade avoidance. Bending direction for phototropism. Node count or flowering time for developmental shifts. Fresh weight alone can improve under stretching while quality falls, so the metric has to match the commercial goal rather than the easiest measurement.
Reading a “Full Spectrum” Spec Sheet: What It Can and Cannot Tell You
“Full spectrum” is a marketing description, not a measurement. The useful numbers are the spectral power distribution, the R: FR ratio, the phytochrome photostationary state if reported, and the PPFD at a stated distance.
PSS is calculated from the spectrum using values from Sager et al., and Both et al. propose it as a label metric (Both et al., 2017). A fixture that reports PSS is giving the reader something checkable. One that reports only a correlated colour temperature (CCT) is not: CCT describes the colour appearance of light emitted by a lamp in degrees Kelvin, and the paper notes the confusion built into Kelvin labelling, since low temperatures are associated with warmer colours. CCT is a human-vision metric. It is not a plant-signal metric.
Measurement conditions belong on the label too. Recommended testing procedures specify ambient temperature maintained at 25 °C, measured close to the lamp, with the sensor shielded from direct radiation from the light source. This is not pedantry: the light output of all lamps, including LEDs, is influenced by operating temperature, and the paper’s example shows case temperature rising by 300% while PAR flux dropped by 5% (Both et al.). A bare output figure without its thermal condition is only partly informative.
The honest limit is that a spec sheet describes the fixture’s output, not the spectrum at the canopy. Reflection, absorption, and inter-plant shading intervene, so the same fixture can produce different R: FR at different canopy densities. The number on the sheet is the start of the calculation, not the answer.
Conclusion
The chain runs in one direction: photoreceptor photoconversion, then PIF and DELLA integration, then auxin and GA levels plus sensitivity, then growth and morphology. Light enters at the top and emerges as stem length, leaf angle and branch number.
Direction, ratio, and timing are as load-bearing as intensity. A canopy can be photon-rich and still stretch, because the ratio is wrong. A crop can bend toward a wall of light rather than a lamp, because the geometry is wrong. A treatment can be applied at the wrong hour and land on a different hormonal state than intended.
The decision rule is to diagnose the light variable before adjusting anything hormone-adjacent, and to treat any single hormone number or PPFD figure as one input among several. The plant is not measuring brightness. Neither should the specification review.
FAQ
How do photoreceptors turn light into a hormone signal?
Phytochromes shift between a red-absorbing Pr form and a far-red-absorbing Pfr form depending on the red and far-red content of the light, and the Pfr form interacts with PIF transcription factors to control their stability, which in turn changes the expression of auxin biosynthesis and signalling genes. Cryptochromes and UVR8 feed the same downstream network (phytochrome review; shade-avoidance review).
Does light increase or decrease auxin?
Both, depending on the cue and the tissue. Low R: FR raises auxin through PIF-driven YUC expression, while red light acting through phyB can lower YUC expression in specific tissues such as the root apical meristem. The rise under shade is often transient, so any claim that light “increases auxin” needs a time frame attached (photoreceptor–auxin review).
What do DELLA proteins actually do?
DELLAs are nuclear growth repressors that bind PIF transcription factors and prevent them from activating elongation genes; bioactive GA triggers their degradation via GID1 receptors, releasing the brake (Feng et al.). Light raises DELLA accumulation by lowering bioactive GA, so light and GA act on the same node from opposite directions (Achard et al.).
Why does low red:far-red light cause stretching?
Low R:FR shifts phytochrome toward the inactive Pr form, releasing PIFs to drive auxin synthesis, transport and signalling, while GA rises and DELLAs are degraded — together producing shade-avoidance elongation. Brassinosteroids and ethylene are also required for the full response, and the syndrome trades harvestable tissue for stem (shade-avoidance review).
Is hormone concentration a reliable predictor of growth?
No. The plant adjusts sensitivity alongside level, and shade-induced auxin increases are often transient while growth continues. Receptor–repressor affinities vary widely and dose-response can be biphasic, so a concentration reading without light history and sampling time is weak evidence (photoreceptor–auxin review; auxin review).
Can a “full spectrum” label tell me how a plant will respond?
Not on its own. The label is descriptive; the checkable numbers are the spectral distribution, R:FR ratio, PSS and PPFD at a stated distance. CCT describes human colour appearance, and measured output depends on operating temperature and measurement conditions (Both et al.).
How should I isolate the cause of a stretching crop?
Hold three variables and change one: check geometry and direction first, then record R:FR separately from PPFD, then log timing and duration, and measure an outcome that matches the mechanism such as internode length or leaf angle. This is a reasoning sequence, not a validated protocol.
Related Resources
- Phytochrome signalling review (PMC9916439) — the Pr/Pfr photoconversion mechanism, the phyA–phyE family, and the type I versus type II distinction.
- Demotes-Mainard et al., Environmental and Experimental Botany (2016) — red and far-red light in horticulture, including the reported sunlight and canopy R: FR values.
- Shade-avoidance review (PMC5591575) — the full shade-avoidance syndrome, the PIF–YUC axis, and the division of labour among auxin, GA, brassinosteroids, ethylene, cytokinin and ABA.
- Photoreceptor–auxin review (PMC7463442) — the three levels of auxin regulation, the transient-versus-sensitivity finding, and the phyA brake in deep shade.
- Achard et al., Plant Physiology (PMC1820925) — light-induced DELLA accumulation and the GA20ox/GA3ox/GA2ox transcript pattern in Arabidopsis hypocotyls.
- Both et al., HortTechnology (2017) — the proposed lamp label, PSS as a metric, CCT limitations and measurement conditions.
- DELLA review (PMC3440232) — the circadian pattern of GID1, DELLA, and PIF levels.
- Auxin review (PMC5761761) — the biphasic IAA dose-response in pea and the range of TIR1/AFB–Aux/IAA affinities.
Still Have Questions?
If a crop is stretching and the cause is not obvious, the useful next step is to assemble the light record rather than to change the fixture. Send the spectral distribution, the R: FR ratio, the PPFD measured at canopy height, the photoperiod, and the fixture geometry relative to the canopy. With those five inputs, a response can be reasoned from the framework above and the most likely variable identified before anything is adjusted.
This article will be updated as the cited literature develops. The mechanisms described here are drawn from published research, largely in Arabidopsis; they are a basis for diagnosis, not a substitute for a trial on your own crop.