Introduction
An unrooted hemp cutting is a plant with a demand it cannot yet meet. It transpires through leaves that are fully functional while its stem has no roots to replace the water. Light sits on both sides of that problem. Photons drive the photosynthesis that supplies carbohydrates for adventitious root formation, and radiant energy warms leaf tissue and pulls more water vapor out of the cutting. Get the intensity right and rooting is faster and heavier. Overshoot and the cutting spends its reserves on damage control.
The published work does not converge on a single setpoint, and any guide that offers one is overselling its evidence. What cannabis propagation trials and floriculture extension guidance support is a staged band: a low ceiling while the cutting is callusing, then a deliberate ramp as roots take over water uptake. This guide builds that band from the primary sources, works through the DLI arithmetic, sets out a bench-mapping procedure, and closes with an SOP and audit structure a commercial facility can run and defend.
The evidence base is mixed and should be read that way. Cannabis-specific rooting trials exist — Holweg et al. 2025 in HortScience, a Korean study by Kim and colleagues in Horticultural Science and Technology, and a hemp cutting trial reported in Acta Horticulturae — but they use different cultivars, photoperiods, humidity control, and auxin protocols. The most detailed staged light guidance comes from Michigan State University extension work on unrooted ornamental cuttings, which is a starting point to validate in your room, not a cannabis optimum.
Table of Contents
What PPFD for Hemp Clones Actually Controls
PPFD — photosynthetic photon flux density — is the instantaneous flux of photons in the 400–700 nm waveband reaching a surface, expressed in µmol·m⁻²·s⁻¹. It is a rate, not a total. DLI, the daily light integral, is the accumulated total in mol·m⁻²·d⁻¹. Photoperiod is the hours of light per day, and spectrum is the distribution of wavelengths within the band. All four interact, but they are separate levers and should be recorded separately.
For a cutting, PPFD sets two things at once. It sets the rate of photosynthesis, which produces the sugars and starch that fund the wound response, callus formation, and root primordia. It also sets the radiant load on leaf tissue. Absorbed photons that are not used in photochemistry become heat, leaf temperature rises above air temperature, and the vapor pressure deficit (VPD — the difference between the water-holding capacity of saturated air and its actual moisture content) between leaf interior and room air widens.
A rooted plant answers that with more water uptake. A cutting cannot. Its water loss comes out of its own reserves, and once those are spent, the tissue desiccates before roots arrive.
That trade-off is why propagation light is managed as a sequence rather than a number. The three-stage model used by MSU extension and echoed in the P.L. Light propagation guidance maps onto root function: Stage 1 runs from sticking until the stem has callused and the first root initials are visible; Stage 2 runs from first root emergence until roots reach the edge of the cell; Stage 3 runs from there to a well-rooted, toned liner. Each stage changes what the cutting can do with light, so each stage gets its own target. URC, unrooted cutting, is the term used throughout the extension literature for material at Stage 1.
The Evidence Base: What Cannabis and Floriculture Trials Show
Four cannabis datasets and one extension framework carry most of the weight here. Their scopes differ enough that the numbers should not be averaged into a single recommendation.
Holweg et al. 2025, HortScience. Apical cuttings of two medicinal cannabis genotypes, ‘Original Blitz’ and ‘King Harmony’, were propagated without exogenous auxin for three weeks under 50, 150, and 250 µmol·m⁻²·s⁻¹ in climate chambers at a 16-hour photoperiod, 22/20 °C day/night, and 75% RH, with tray covers vented from day 6 and removed at day 14. Higher propagation intensity did not change the fraction of rooted cuttings, but it increased root and cutting dry mass at 14 days. The authors concluded that 250 µmol·m⁻²·s⁻¹ can be applied during propagation.
Two scope notes matter: no rooting hormone was used, and the authors suggest the light effects on rooting might be less evident if a rooting agent were applied.
Fuentes et al., Acta Horticulturae 1426. In experiment 2 of this hemp cutting trial, light treatments of 51, 101, and 200 µmol·m⁻²·s⁻¹ ran for two weeks, and increasing intensity linearly increased root dry mass — from 22.5 mg at 51 µmol·m⁻²·s⁻¹ to 80.5 mg at 200. The same paper’s first experiment found IBA raised root dry mass 2.6-fold against an untreated control (38.5 vs. 14.7 mg).
Campbell et al., PLoS ONE 2021. Essential oil hemp cuttings were rooted in controlled propagation rooms at 25 °C air temperature, 63.6% average RH, and a 24-hour photoperiod from T5 fluorescent lamps. Bench PPFD averaged 54 µmol·m⁻²·s⁻¹ across ten representative positions at canopy level, giving a DLI of 5 mol·m⁻²·d⁻¹. This is a study of substrate and hormone effects, not a light-intensity trial; the light level is a description of the environment, not a tested optimum.
Kim et al. 2025, Horticultural Science and Technology. Two Korean cannabis cultivars, ‘IT342810’ and ‘IT342811’, were rooted under 80 ± 5 µmol·m⁻²·s⁻¹ with a 20/4 photoperiod for three weeks. The study varied light quality, RH, and temperature rather than intensity. Its findings: optimal light quality differed between cultivars, high RH consistently promoted adventitious rooting in both, and optimal rooting temperature was 25–30 °C for one cultivar and 20–30 °C for the other.
MSU extension, Runkle. For unrooted ornamental cuttings: Stage 1 DLI 4–5 mol·m⁻²·d⁻¹ with peak PPFD not exceeding 200 µmol·m⁻²·s⁻¹; Stage 2 DLI 6–8 with a maximum of 400; Stage 3 DLI 8–12. This is ornamental guidance, and the crops behind it are not cannabis.
Where do these agree? Every cannabis trial that tested intensity found that more light, within its range, increased root or cutting dry mass without reducing the fraction of cuttings that rooted. Where do they diverge? The tested ranges run from about 50 to 250 µmol·m⁻²·s⁻¹, photoperiods from 16 to 24 hours, and humidity control from open-room 63% RH to sealed trays at 75%. None of these studies identified a cannabis optimum, and none tested a ceiling.
Recommended PPFD Bands for Fresh Unrooted Cuttings
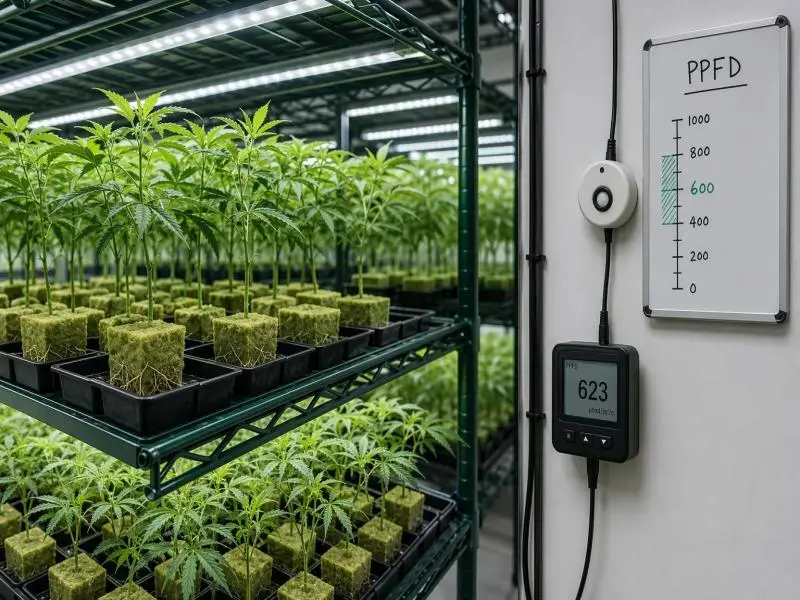
For the first days after sticking, run roughly 50–150 µmol·m⁻²·s⁻¹ at canopy and hold peak intensity at or below 200 µmol·m⁻²·s⁻¹ until callus and the first root initials are visible. Pair that with a DLI of 4–5 mol·m⁻²·d⁻¹.
The lower bound comes from the two cannabis studies that rooted successfully in that region: Campbell at an average of 54 and Kim at 80 ± 5. The upper bound is the MSU Stage 1 ceiling, which is also the top of the Fuentes intensity series and below the 250 µmol·m⁻²·s⁻¹ that Holweg showed to be tolerable. Sitting between the demonstrated-success range and the demonstrated ceiling is the defensible position, while the cutting has no roots.
Confidence in this band is moderate, not high. It is an operating band synthesized from different systems, not a proven cannabis optimum. Three factors move a facility within it. Cultivar: Holweg found genotype-specific responses to light in the mother-plant phase, and Kim found cultivar-specific light-quality and temperature optima, so a slow-rooting genotype is a reason to sit low.
Source-stock condition: cuttings arrive from shipping already dehydrated, and the e-GRO rehydration guidance notes losses of up to roughly 20% relative to optimal internal water status, which argues for the low end until turgor is restored. Humidity control: a room that holds VPD near 0.3 kPa can support more light than a dry sticking area, because the transpirational penalty of each photon is smaller.
| Source | Species | PPFD (µmol·m⁻²·s⁻¹) | Photoperiod | Auxin | RH / enclosure | What it tested |
|---|---|---|---|---|---|---|
| Holweg et al. 2025 | Medicinal cannabis, 2 genotypes | 50 / 150 / 250 | 16 h | None applied | 75% RH, covered trays vented day 6, removed day 14 | Intensity effect on rooting and dry mass |
| Fuentes et al., Acta Hortic. 1426 | Hemp | 51 / 101 / 200 | Not stated in excerpt | Experiment 2 light series; Exp. 1 tested IBA | Not stated in excerpt | Intensity effect on root dry mass |
| Campbell et al. 2021 | Essential oil hemp | 54 average (10 positions) | 24 h | IBA/NAA treatments varied | 63.6% RH, controlled room | Substrate and hormone, not intensity |
| Kim et al. 2025 | Cannabis, 2 cultivars | 80 ± 5 | 20/4 | Not the variable tested | RH varied 30–90%; 90% in light/temperature runs | Light quality, RH, temperature |
| MSU extension (Runkle) | Ornamental URCs | Peak ≤200 | Limit to ~13 h recommended | Not specified | Stage 1 VPD ≤0.3 kPa | Staged guidance |
Read the table as a map of scope, not a ranking. The MSU row is the only one that states a ceiling, and it is the only one that is not cannabis.
Ramping Intensity After Roots Appear
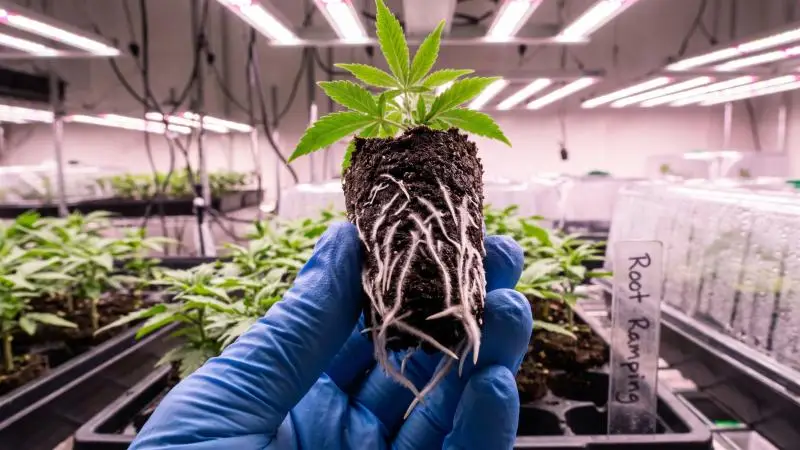
Anchor the ramp to root milestones, not to the calendar. The day counts below are typical durations from the extension staging, and a fast cultivar can compress them while a slow one stretches them.
Stage 1 — sticking through callus and first root initials (typically 5–7 days). 50–150 µmol·m⁻²·s⁻¹, DLI 4–5 mol·m⁻²·d⁻¹, peak capped near 200. Hold VPD low. Do not ramp on schedule if no root initials are visible.
Stage 2 — first roots emerging to roots reaching the cell edge (typically 4–6 days). Raise toward a peak of 200–400 µmol·m⁻²·s⁻¹ and a DLI of 6–8 mol·m⁻²·d⁻¹. The cutting can now take up water and fertilizer, which is what makes the higher radiant load survivable. Holweg’s result at 250 µmol·m⁻²·s⁻¹ — no loss in the fraction rooted, more root and cutting dry mass — supports the lower half of this range for cannabis specifically, and it is the strongest cannabis evidence for going above the Stage 1 ceiling once roots exist.
Stage 3 — well rooted, toning for transplant (typically 6–8 days). DLI 8–12 mol·m⁻²·d⁻¹, with PPFD allowed to rise further as the plug holds together and turgor is stable between irrigations. The purpose here is acclimation: a liner that has only ever seen 100 µmol·m⁻²·s⁻¹ arrives in a vegetative room under several hundred and stalls.
Two cautions on the ramp. First, the stage boundaries and the DLI figures are MSU ornamental guidance; the cannabis-specific support for the upper end of Stage 2 is Holweg’s 250 µmol·m⁻²·s⁻¹ treatment, which was a fixed intensity for three weeks, not a ramp. Second, ramp rate should be conservative for slow-rooting cultivars and for any batch that arrived dehydrated. A useful rule is to raise intensity in steps of no more than about 50 µmol·m⁻²·s⁻¹ per adjustment and to check turgor the following morning before the next step. If leaves are flagging at lights-on two days after a step, the step was early.
PPFD, Photoperiod, and DLI: The Arithmetic and Which to Control
The arithmetic is simple and worth doing explicitly rather than estimating.
DLI (mol·m⁻²·d⁻¹) = PPFD (µmol·m⁻²·s⁻¹) × photoperiod (hours) × 3,600 ÷ 1,000,000
Two worked examples at the Stage 1 ceiling:
- 100 µmol·m⁻²·s⁻¹ × 16 h × 3,600 ÷ 1,000,000 = 5.76 mol·m⁻²·d⁻¹
- 150 µmol·m⁻²·s⁻¹ × 18 h × 3,600 ÷ 1,000,000 = 9.72 mol·m⁻²·d⁻¹
The second example is instructive: 150 µmol·m⁻²·s⁻¹ is inside the recommended Stage 1 band, but stretched over 18 hours it delivers a DLI near the top of the Stage 2 range. Intensity and duration are not interchangeable. The same DLI can be reached with low intensity over a long day or higher intensity over a short one, but the two routes differ in what they do to the cutting. Long, low-light days reduce the instantaneous radiant load on the leaf, which is gentler on transpiration, but they accumulate the same total energy, and they push the photoperiod signal toward flowering in photoperiod-sensitive crops.
That is the photoperiod tension in the literature. MSU recommends limiting photoperiod to about 13 hours during propagation to prevent premature flowering in long-day crops. The cannabis studies did not: Holweg used 16 h, Kim used 20/4, and Campbell used 24 h.
Cannabis is a short-day plant for flowering, so a long day is vegetative rather than flower-inducing, but continuous light is not free — a Biology 2025 study of cannabis plantlets under photoautotrophic micropropagation found that at 200 µmol·m⁻²·s⁻¹ with a 24-hour photoperiod, antioxidant enzyme activity reached its maximum, indicating oxidative stress under continuous lighting, and that 100–150 µmol·m⁻²·s⁻¹ with a 20-hour photoperiod gave the best root elongation and plantlet quality in that system. That is tissue-culture material, not cuttings, but it is a caution against treating 24 h as a default.
The practical recommendation: control PPFD as the primary variable and treat photoperiod as a separate decision. Set the photoperiod your cultivar and flowering-risk tolerance allow, calculate the DLI that combination produces, and check it against the stage target. If the DLI is short, raise PPFD within the stage ceiling before extending the day.
Measuring and Mapping PPFD Across Benches and Racks
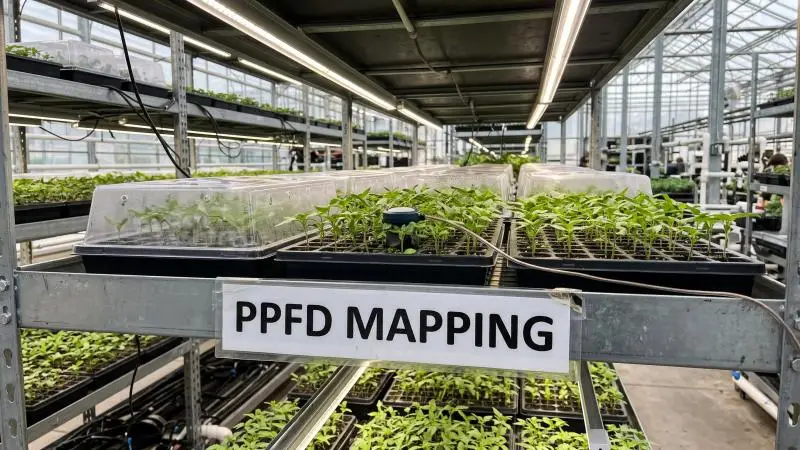
A propagation light number is only as good as the measurement behind it. The requirement is a clean, level quantum sensor reading at canopy height — the top of the cuttings, not the fixture and not an empty aisle. MSU notes that sensors more than 10 years old likely need recalibration or replacement, and that sensors mounted outside the greenhouse are only marginally useful because they miss shade curtains, whitewash, fogging, and supplemental lighting.
Sample enough positions to see the pattern. The Campbell study measured ten representative positions across the bench at canopy level. A cannabis LED-spectrum propagation study published in HortScience in 2023 measured on a 0.1 × 0.1 m grid — 25 locations — under each fixture and calculated uniformity per plot as the mean of minimum PPFD divided by average PPFD. That min/average ratio is the number to report, because the lowest-reading position is where cuttings root slowest and where the batch becomes uneven.
Expect the low readings in predictable places. Bench edges and corners under a linear fixture receive less direct light and more of it at an oblique angle. On multi-tier racks, the lowest tier sits furthest from the fixture and often nearest the floor, where reflected light is weakest. Mist benches add a second problem: wet foliage and condensation on domes change the optical path, and a sensor reading taken through a fogged dome is not the light the leaf receives. Measure with the dome in place if the dome stays on, and note the condition in the record.
Re-measure after any change that alters the optical geometry: fixture height, dimming setting, a new rack configuration, shade or energy curtain deployment, or a change in dome type. A retrofit that swaps HPS for LED changes both the distribution and the radiant heat load, and the old map does not carry over.
A workable mapping worksheet has six columns: grid coordinate, measured PPFD, target PPFD for the stage, deviation, calculated DLI at the recorded photoperiod, and a pass/fail flag against a tolerance you set — for example, no position more than 25% below target. Summarize each map as min, average, max, and min/average uniformity, and file it with the batch record so that a rooting problem can later be checked against the light the cuttings actually received.
Light, VPD, and Dome Removal: Managing the Interaction
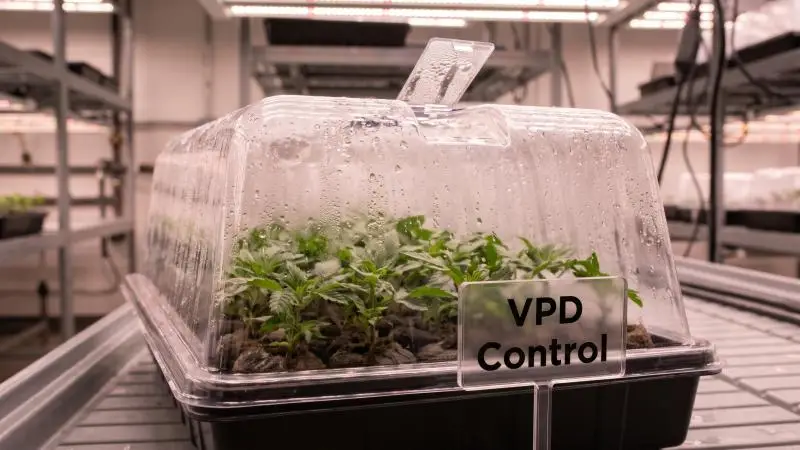
Light intensity and humidity are one control problem wearing two labels. Raising PPFD raises leaf temperature and widens the leaf-to-air VPD, which increases water loss from a cutting that has no roots to replace it. The e-GRO rehydration guidance lays out a VPD sequence that pairs with the light stages: 0.1–0.3 kPa during arrival, rehydration, and pre-stick holding; 0.2–0.4 kPa immediately after sticking during early callus; and 0.4–0.6 kPa as callus develops and root initials form, typically three to ten days after sticking depending on species and temperature. MSU uses about 0.3 kPa or lower as the Stage 1 target for ornamental URCs. These are non-cannabis extension figures and should be treated as starting points.
The pairing rule follows directly: raise light only as fast as you can hold VPD down. A Stage 2 intensity increase in a room that cannot keep VPD below about 0.6 kPa will produce wilt regardless of what the light schedule says. Time the increase to root emergence, when water uptake capacity actually changes, and stage the humidity change alongside it.
Dome removal is the highest-risk moment in the sequence. A dome suppresses transpiration by holding a saturated boundary layer around the leaf. Lifting it under high PPFD exposes the cutting to the room’s full VPD in a single step. The e-GRO guidance on acclimation describes gradually venting domes rather than removing them outright, and the commercial lesson from that work is that calendar age is a poor transfer trigger — a cutting that needs another week is not a failed cutting. Vent in increments, watch turgor through the first afternoon and the following lights-on, and drop intensity for a day if the leaves flag.
One counterweight: excessive misting is more harmful than mild dehydration. The e-GRO authors state this directly, noting that overly wet conditions slow root development and increase disease risk, and MSU warns that over-misting and waterlogged media lead to uneven rooting, rot, and Botrytis. High room RH, wet leaves, and a saturated plug are three separate conditions; log all three rather than treating a humidity reading as the whole diagnosis.
Separating Light Stress from Humidity, Temperature, and Substrate Problems
Light stress is a common diagnosis and often the wrong one. The table below separates the differentials using the mechanisms already established, and each row implies a different corrective action.
| Symptom | Most likely cause | Why | First check |
|---|---|---|---|
| Leaf edges dry and crisp, bleaching or scorch on upper leaves, worst at bench edges and top tier | Excess PPFD | Radiant energy raises tissue temperature and transpiration beyond what the cutting can replace | PPFD map at canopy; compare worst positions to target |
| Persistent wilt under low light, condensation on dome, limp stems | VPD too high or dome leaking | Water loss exceeds uptake even at modest intensity | VPD calculation from canopy temperature and RH; dome seal |
| Stem brown and soft where it enters the plug, sour smell | Substrate waterlogging and poor aeration | Saturated media excludes oxygen and invites rot; not a light problem | Plug weight, drainage, odor |
| Slow callus, pale cuttings, no root initials by day 10–14 | Temperature, especially root zone | Temperature controls the rate of callus and root development; P.L. Light cites a media target of 22–24 °C | Media temperature probe, not air temperature |
| Uneven rooting across a bench with no clear symptom pattern | Light non-uniformity | Low min/average means some positions received far less than the average | Min/average PPFD from the map |
| One genotype consistently slower than others in the same room | Cultivar | Kim found cultivar-specific optima for light quality and temperature; Holweg found genotype-specific light responses | Compare against that cultivar’s own history |
The root-zone row deserves emphasis after an LED retrofit. P.L. Light notes that HPS luminaires radiate significant heat downward and that growers running HPS over propagation benches relied on it to warm the media, whereas LED fixtures deliver less downward radiant heat. If media temperature falls short of the 22–24 °C target after a retrofit, it has to be restored with bench or root-zone heating or a higher air setpoint. Measure it rather than assuming it.
Change one variable at a time and record the change. A batch that gets new light, a new mist interval, and a new dome schedule in the same week teaches nothing about which one mattered.
Building a Propagation Light SOP and Audit Record
The SOP is the document that makes the band repeatable across shifts and operators. It should contain, at minimum:
- Stage definitions with root-milestone triggers — callus and first root initials, first roots reaching the cell edge, plug cohesive and toned — rather than day counts alone.
- PPFD and DLI targets per stage with explicit tolerances, including the Stage 1 ceiling and the maximum permitted deviation at any measured position.
- Photoperiod and the reasoning behind it, including the flowering-risk constraint for the cultivars in the room.
- Fixture settings — dimming percentage, height, and any zoning — recorded as numbers an operator can set, not as descriptions.
- Measurement procedure — sensor model and calibration date, grid layout, number of positions, canopy reference height, and measurement frequency.
- VPD, RH, and temperature setpoints by stage, with the root-zone target stated separately from air temperature.
- Dome-removal and venting sequence, written as steps with a turgor check between them.
- Cultivar-specific overrides, so a slow-rooting genotype has a documented slower ramp instead of an improvised one.
- Escalation criteria — the conditions under which an operator stops the ramp and calls a grower, such as wilt that persists past lights-on or a plug that stays saturated for more than a set interval.
The audit record is the per-batch counterpart. Log date; cultivar and source stock with mother ID and test status; stage; the PPFD map summary (min, average, max, and min/average uniformity); calculated DLI; photoperiod; canopy air temperature; root-zone temperature; RH and calculated VPD; irrigation and mist events; observations; and any fixture or SOP change made during the batch. The GrowGoyle clone-environment checklist is a useful model for the observation categories — root emergence and distribution, plug weight and odor, foliage turgor and leaf wetness, canopy and root-zone environment, and PPFD at canopy with photoperiod — because it separates conditions that are easy to conflate into a single humidity reading.
This is operational reasoning, not an empirically validated form. Its value is that it makes the next batch comparable to this one, and it keeps a source-stock problem from being blamed on humidity.
Common Mistakes in Clone-Room Lighting
Treating one PPFD number as universal. The tested ranges span 50 to 250 µmol·m⁻²·s⁻¹ across different cultivars, photoperiods, and humidity regimes, and Kim found cultivar-specific optima. A single setpoint applied across a multi-cultivar room will be too high for some genotypes and unnecessarily low for others.
Chasing PPFD while ignoring DLI. A 150 µmol·m⁻²·s⁻¹ setting at 18 hours delivers 9.72 mol·m⁻²·d⁻¹, which is Stage 2 territory delivered to a Stage 1 cutting. Calculate the DLI for every combination before it goes on the schedule.
Measuring at fixture height or in an empty aisle. The number that matters is at canopy, at the cuttings. Fixture-height readings overstate what the plants receive, and aisle readings say nothing about the bench.
Assuming an LED retrofit delivers the same radiant heat as HPS. P.L. Light states plainly that LED luminaires deliver less radiant heat downward. Media temperature that used to come free from the fixtures now has to be measured and, if short of 22–24 °C, supplied by bench heating.
Ramping light before roots can carry the transpiration load. The Stage 2 increase is justified by water uptake capacity, not by the calendar. Holweg’s 250 µmol·m⁻²·s⁻¹ result was obtained over a three-week propagation period with covers vented at day 6 and removed at day 14 — not by lifting a fresh cutting into that intensity on day one.
Removing domes abruptly under high intensity. Domes suppress transpiration; lifting one under full room VPD creates a step change the cutting did not earn. Vent in increments and check turgor.
Over-misting as insurance. The e-GRO authors note that excessive misting is more harmful than mild dehydration, and MSU ties over-misting to uneven rooting, rot, and Botrytis. Wet foliage, saturated media, and high room RH are separate faults with separate fixes.
FAQ
What PPFD should fresh unrooted hemp cuttings receive?
Roughly 50–150 µmol·m⁻²·s⁻¹ at canopy for the first days after sticking, with peak intensity held at or below 200 µmol·m⁻²·s⁻¹ until callus and first root initials are visible, paired with a DLI of 4–5 mol·m⁻²·d⁻¹. Confidence is moderate: the band sits between cannabis studies that rooted successfully at 54 and 80 µmol·m⁻²·s⁻¹ and the MSU Stage 1 ceiling of 200, which is ornamental guidance. It is an operating band, not a proven cannabis optimum. See the bands and source table above.
When and how much should I ramp after roots appear?
When roots are visible and reaching toward the cell edge — typically 4–6 days after the first initials — raise toward a peak of 200–400 µmol·m⁻²·s⁻¹ and a DLI of 6–8 mol·m⁻²·d⁻¹. Holweg’s 250 µmol·m⁻²·s⁻¹ treatment supports the lower half of that range for cannabis. Then move to DLI 8–12 for toning. Ramp in steps of about 50 µmol·m⁻²·s⁻¹ and check turgor before the next step.
How do I calculate DLI, and which variable should I control?
DLI = PPFD × photoperiod in hours × 3,600 ÷ 1,000,000. At 100 µmol·m⁻²·s⁻¹ over 16 h that is 5.76 mol·m⁻²·d⁻¹; at 150 over 18 h it is 9.72. Control PPFD as the primary variable within the stage ceiling, and treat photoperiod as a separate decision constrained by cultivar and flowering risk. The two routes to the same DLI are not interchangeable for transpiration stress or flowering signals.
How should I map PPFD across benches and racks?
Use a clean, level quantum sensor at canopy height, sample multiple representative positions — ten as in the Campbell study, or a 0.1 × 0.1 m grid as in the spectrum work — and report min, average, max, and min/average uniformity. Expect low readings at bench edges, corners, and the lowest rack tier. Re-measure after any fixture, dimming, curtain, or rack change, and replace or recalibrate sensors over 10 years old.
How do light, VPD, and dome removal interact?
Higher PPFD raises leaf temperature and VPD, so intensity increases must be paired with humidity management. Target roughly 0.2–0.4 kPa after sticking during callus and 0.4–0.6 kPa as root initials form, per e-GRO, with MSU’s ~0.3 kPa as the Stage 1 reference. Vent domes gradually rather than lifting them under high intensity, and watch turgor through the first afternoon.
How do I tell light stress from a humidity, temperature, or substrate problem?
Scorch and bleaching on upper leaves, worst at bench edges, points to excess PPFD. Persistent wilt under low light points to VPD or a leaking dome. A brown, soft stem base with a sour smell points to waterlogged media. Slow callus with pale cuttings points to temperature, especially root zone below 22–24 °C. Uneven rooting with no symptom pattern points to light non-uniformity. Change one variable at a time and record it.
What belongs in a propagation light SOP and audit record?
The SOP carries stage definitions with root-milestone triggers, PPFD and DLI targets with tolerances, photoperiod, fixture settings, the measurement procedure, VPD/RH/temperature setpoints, the dome-removal sequence, cultivar overrides, and escalation criteria. The audit record carries date, cultivar and source stock, stage, the PPFD map summary and uniformity, calculated DLI, photoperiod, canopy and root-zone temperature, RH/VPD, irrigation events, observations, and any changes made during the batch.
Conclusion
Match PPFD to root function. Hold fresh cuttings in a low band near 50–150 µmol·m⁻²·s⁻¹ with a ceiling near 200 until callus and root initials appear, then ramp toward 250–400 as roots develop and the cutting can replace its own water loss, and finish at a DLI of 8–12 for toning. Control DLI arithmetic and VPD alongside intensity, because a PPFD number without a photoperiod and a humidity setpoint is only a third of a specification.
None of these figures is a proven cannabis optimum. They are operating bands synthesized from cannabis propagation trials and ornamental extension guidance, and they should be validated per cultivar and per facility with recorded measurements. The facilities that get this right are not the ones with the best single number; they are the ones that know what light their cuttings actually received.
The next action is concrete: build the PPFD map at canopy across every bench and rack tier, write the stage-based SOP around root milestones, and run one full propagation cycle with the audit record. Compare rooting uniformity and timing against your previous cycle before changing anything at scale. If the retrofit to LED has left media temperature short of the 22–24 °C target, plan bench or root-zone heating into the same change rather than discovering the gap in the first crop.